IMPLAN’s economists have completed our newest Census of Employment and Wages (CEW) data set which is now available for purchase. A lot of work goes into delivering the best, most detailed CEW data out there. And since we have CEW data for all counties for all years back to 2001, it makes for fantastic statistical and trend analysis for anyone wanting to look deeper into the U.S. wage and salary business sphere.
What Makes IMPLAN CEW Data Special
CEW data differs from the core IMPLAN data and software used to perform various types of impact analysis in that it goes down to the 6-digit NAICS level (giving it more sector detail). There are more than 2,000 sectors in CEW, whereas IMPLAN has 536. CEW data's level of sector detail makes it a great addition for specific modeling scenarios.
 Many state, county, and city offices rely on a staff economist or economic modeling software to gauge the costs and benefits of tax incentive programs and the economic contributions of industries within their climes. If a study seems spurious to you, ask your local government offices about the study. Download "5 Questions to Ask When Fact-Checking an Economic Impact Analysis" to learn more.
The CEW data product includes establishment counts, wage and salary employment, and wage and salary income for all NAICS levels and four ownership types (private, federal government, state government, and local government). The establishment counts are fully disclosed so we don’t ever have to estimate or approximate for that number. There are no output numbers, taxes, profits, etc. While the CEW data does not include proprietors or proprietor income, a certain proprietor could have employees and if that proprietor owned his own consulting business (for example) and hired his own accountant who worked as an actual employee, then that accountant would show up in the CEW data even though the proprietor wouldn’t. So the consulting business would show up in this case. Basically, CEW accounts for all employees who fill out a W2—a form that proporetors don’t fill out.
The core source for IMPLAN’s CEW data is the Bureau of Labor Statistics (BLS). This primary data source (by law as a government entity) doesn’t disclose certain data. We fill in some of the holes using other available data to create a more complete dataset and estimate all the missing values. While it’s awesome for its sector detail, it does not have enough information to give an entire picture of the industry the way that IMPLAN data and software can.
How do we do it?
There are several steps and options for estimating and filling in gaps in the data. First, we look to see if last year’s number was disclosed. If it was, then we’ll use that as our first guess after projecting it based on a growth rate from a higher geographic level or some other source which would inform to some level how that number may have changed since the previous year. If that previous year’s number also wasn’t disclosed, then we turn to a different data set called County Business Patterns (CBP) from the Census Bureau. CBP is very similar to BLS’s CEW data in that it only has the same three data points and relies on NAICS codes. But CBP data in addition to including the establishment counts breaks them out by establishment and firm size. So we’re able to disclose those firm size data as part of the IMPLAN CEW data set even though BLS’s CEW doesn’t.
Now, you may be wondering why we even bother with the BLS’s data if CBP gives us so much more. But CBP employment data is a year lagged. So in making estimates for whichever the most recent data-year might be, we rely on the BLS for the core, up-to-date numbers and then fill in with some estimations for what might be missing with the most recently released CBP data which will be based on the prior year. On top of that, the CBP’s wages data are two years old—which we don’t use at all.
If CBP data are not available, we use ratios from higher NAICS aggregates or higher geographic levels applied to the establishment count, which is always disclosed.
We follow this process of checking through a prioritized list of publicly available sources until we have a first estimate for every place that says there’s an establishment of some kind within its borders. Once we get those first estimates, we do what we call “rolling up” where we make sure that the totals for the constituent parts of the classification sum up to what the established totals are from the original data set.
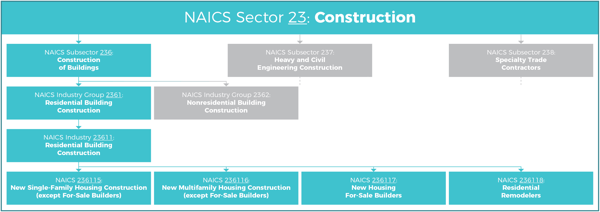
NAICS classifications are ordered in such a way that a particular group of firms with their own unique 6-digit NAICS codes will belong to a 5-digit classification. Then that 5-digit classification together with other similar 5-digit groups will belong to a 4-digit classification. In the CEW data, there are numbers reported at each level which we use as a guide to ensure that our estimates reflect what’s known about employment and establishments counts for the most recent data set. In other words, whatever numbers we have for the 6-digit firms, all need to sum up to their 5-digit parent sector, 5-digit sectors to their 4-digit parent sectors, and so on. But ultimately, if a number is disclosed for the most recent data set then we will not change it in the finished IMPLAN CEW data.
Coming Soon
“Data season,” as we call it, is now upon us. This means that we’ll have some exciting other data sets to release this summer and into the fall culminating in the release of our IMPLAN data for impact analyses in November. To learn more about what’s coming down the line, you can check out the data release notes from last year as well as more information about our Time Series data here. Call to order or for more info or click here to see a sample data set.