America has had a long and sometimes troubled relationship with its energy sources—it’s not just your imagination. A lot is said nowadays about the rise in renewable energy and the downfall of traditional fossil fuels. But when it comes to making the switch to solar or other renewable energy sources, the United States might be torn between two lovers. But don’t give up on us—despite the storied history, there’s still a lot of road ahead.
This begs the question in my mind: What are the current economic impacts of the shift in energy production from traditional sources to modern renewables in the United States.?
Before we try to tackle that question, let’s catch up on what we may have missed. Cue the recap sequence!
 Estimating the economic impact of expanding renewable energy production in your region is easy, check out the white paper “The Economic Developer's Guide to Impact Analysis” to find out how to conduct an analysis of your own.
Don’t Stop ‘Til You Get Enough
Let’s kick it off with the decade my dad likes to call “the golden age of music”... the 1970s. The music scene may have been diverse, but the U.S. energy market in the late 1960s and early 1970s was characterized by monopoly-based organizational structures. For those who don’t remember fueling up at gas stations based on whether you had an odd or even license plate number, there were also two gasoline crises in the decade and an Organization of the Petroleum Exporting Countries (OPEC) embargo in 1973 which saw oil prices jump 350% in the US, and the higher costs ripple through the economy.
So how did the country respond? Two ways: reduce and diversify. The major shortages in fuel caused state governors to plead with citizens that they do everything in their power to try and conserve electricity. Many energy conservation rules were in place until 1974, but when prices still didn’t drop, larger government stepped in with some good ol’ fashioned intervention.
Intervention came in the form of legislation focused on using other forms of energy to reduce the United States’ dependence on oil or fossil fuels. The highlights are the Emergency Petroleum Allocation Act (1973), Energy Policy and Conservation Act (1975) and the birth of the Department of Energy in 1977, which seeks to promote and advance technology related to energy within the United States.
If you’re curious about how the environment fits into this fossil fuel and energy discussion, keep in mind the Environmental Protection Agency (EPA) was established by President Richard Nixon in 1970, before the aforementioned energy sector policies were passed by his successor, President Gerald Ford.
Groovy, man! Netflix binge of the recent history of the U.S. energy sector complete, now onto our next episode.
Tell Me Something Good
So we know a good bit of legislation and focus was placed on the energy sector and developing new technologies to reduce the sole dependence on oil. The big question around any policy change is always, “Did it achieve the desired results?”
I’ll say this next bit now (if you just want to know who shot J.R. and not dig into longtime rivalry between the Ewings and the Barneses).
The most prominent impacts from the shift in energy production from traditional sources to modern renewables are:
- increased energy efficiency
- an increase in renewable energy construction and decrease in active coal plants
- job growth in renewables
- stable energy prices
- increased energy grid resiliency.
Now I’m not going to go all "Dallas"-season-9 on you and say this is just a dream. However, I will contest that there are some shortcomings to green energy beyond the general positive outcomes listed above. What are they? Well, now I’m going to go all entire-"Dallas"-series on you and leave that as a cliffhanger for later. Stay tuned!
Energy Efficiency
First, let’s get some more detail on the impacts of the shift in energy production sources. You remember the concerted effort to reduce energy consumption back in the early 70s? We’ve come a long way.
In fact, don’t leave it to me to paraphrase what Mims, Bell and Doig effectively concluded: “The adoption of more efficient products and services is responsible for 60% to 75% of the increase in energy productivity since 1970.”
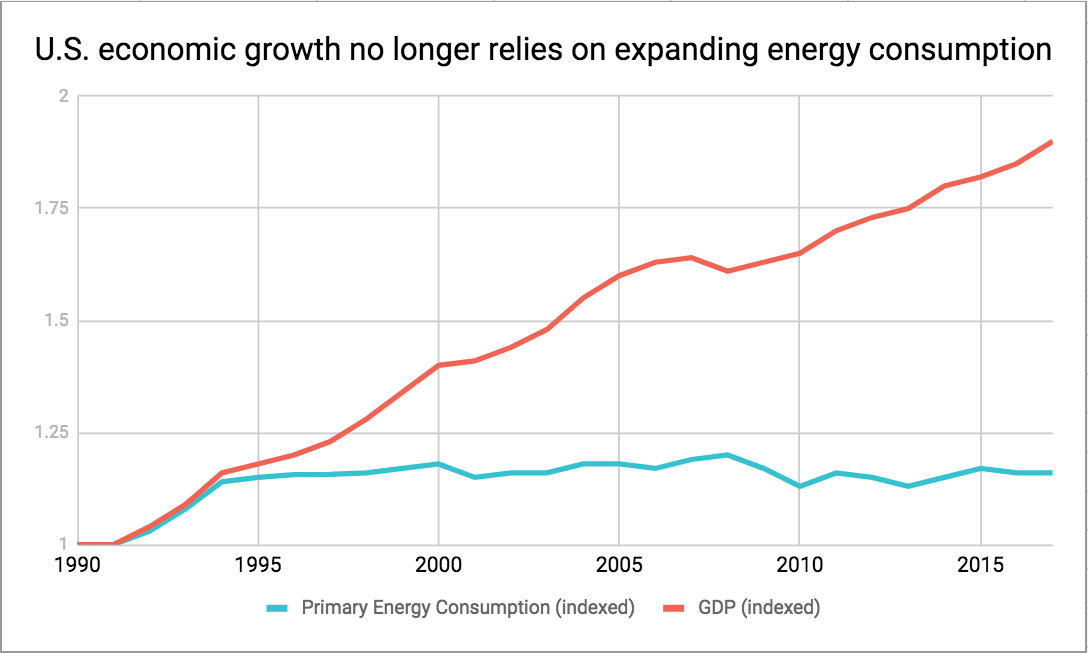
Additionally, if we look at just the past 10 years, it’s now safe to say that U.S. economic growth no longer relies on expanding the country’s energy appetite. Per the Business Council for Sustainable Energy by Bloomberg New Energy Finance’s 2018 Sustainable Energy in America Factbook, the national GDP has grown 10% while energy consumption has decreased 1%. I’d say we get an A+ on increasing efficiency.
Changing Skylines
This drastic increase in efficiency has been reinforced by the rapid technological advancement of the past 40 or so years as well. However, new technology has also brought about new competition for traditional energy sources like coal.
As a result, U.S. Energy Information Administration data on power plant retirements from 2007—the starting point of the U.S. shale gas revolution—through 2016, revealed a total of 531 coal units were retired at an increasingly rapid pace.
Remember that “efficiency” word? Well it appears again in a study that Columbia University released on the three primary factors for the reduction in coal production and consumption, which are as follows:
- “U.S. electricity demand contracted in the wake of the Great Recession, and has yet to recover due to energy efficiency improvements in buildings, lighting and appliances.”
- “A surge in U.S. natural gas production due to the shale revolution has driven down prices and made coal increasingly uncompetitive in U.S. electricity markets.”
- “Coal has also faced growing competition from renewable energy, with solar costs falling 85 percent between 2008 and 2016 and wind costs falling 36 percent.”
Technology is crazy, eh? That last point is also of key consideration. Solar and wind power units are becoming progressively cheaper which has also resulted in their share of roughly 62% of new power construction in 2017. Fewer smokestacks and more turbine blades are on the horizon.
Job Growth in Renewables
“If you build it, he will come” seems to be ringing true for the solar and wind power industries, because not only are the two industries leading new construction, they are also each creating jobs at a rate 12 times faster than that of the rest of the U.S. economy. Furthermore, the study published by the Environmental Defense Fund’s (EDF) Climate Corps program, says that solar and wind jobs have grown at rates of about 20% annually in recent years.
What’s driving job expansion in these industries, you might ask? Well, aside from the rapid industry growth, money may have a bit to do with it.
When you look at the numbers, per the Bureau of Labor Statistics, the two highest anticipated job growth rates from 2016-26 are solar photovoltaic installers and wind turbine service technicians.
Considering the growth rate of each industry’s construction, the fact that both jobs have modest entry-level educational requirements and the median pay for solar PV installers is about $39,000/yr and about $53,000/yr for the wind power service tech job compared to the 2016 U.S. Census median personal income of $31,099, it’s pretty easy to see the appeal.
Stable Energy Prices
Kevin Costner was on the verge of bankruptcy when he chose to build a baseball field instead of grow corn. It took some time and money up front, but in a very roundabout way, people showed up and the farm wasn’t sold. Profit achieved!
Although renewable facilities do require some significant upfront investment to build, once completed, they can then operate at very low cost. For most green energies, the “fuel” like wind, water, or sunlight is free for utilization. As a result, renewable energy prices can be very stable over time when compared to traditional fossil fuels.
Easy for me to say, but the proof is in the pudding. For example, the average price to install solar dropped more than 70 percent between 2010 and 2017. The cost of generating electricity from wind dropped 66 percent between 2009 and 2016. Compare those figures with those of coal and natural gas, and you see how fossil fuel prices can vary dramatically and are prone to substantial price swings.
There was a rapid increase in US coal prices as a result of rising global demand before 2008, then a rapid fall after 2008 when global demands declined. Likewise, natural gas prices have fluctuated a great deal since 2000.
Increased Resiliency in Weather Events
Hang with me now, last effect. We talked earlier about how the DOE establishment was part of the policy initiative in the 1970s to reduce dependence on oil and assuage the energy crises of the decade.
The DOE’s current mission statement reads: “to ensure America's security and prosperity by addressing its energy, environmental and nuclear challenges through transformative science and technology solutions.”
We’ve pretty well covered prosperity, but that word “security” has also effectively come into play. And the technology behind the advancement of renewable energy sources has provided said security and resiliency.
The 1970s gas rationing reference wasn’t made in vain. In 2012, Hurricane Sandy caused New York and New Jersey to enact gas rationing for the first time since the 1970s. Sandy damaged fossil fuel-dominated electric generation and distribution systems in New York and New Jersey and left millions of people without power. By contrast, while this was going on, renewable energy projects in the Northeast weathered the storm with minimal damage or disruption. Aha, resiliency!
The reason this works is that wind and solar are primarily classified as distributed and modular systems. Distributed systems exist over a large geographical area, so a severe weather event in one location will not cut off power to an entire region. Whereas, modular systems are compartmentalized and composed of numerous individual wind turbines or solar arrays, for example. What this means is that in the event some of the equipment is damaged, the remaining units can continue to function uninterrupted. Pretty useful after a natural disaster.
Another contributing factor to renewable energy’s resiliency is the non-risk of water-scarcity. Coal, nuclear, and natural gas rely on water as a coolant for plant operations, which puts them at risk during severe droughts or heat waves. Wind and solar on the other hand, can continue to operate without the need for an additional resource like water and can continue to function reliably in the same conditions that may require closing a fossil fuel-powered plant.
One less material to have to depend upon means one less reason to shut down a plant which equates to, you guessed it, resiliency.
So this seems like a good case for green energy and evidence that the policy changes enacted in the 1970s have been pretty successful, right?
Ain’t No Sunshine
Finally, the end of the cliffhanger! J.R. lost Ewing Oil to Cliff Barnes and shot himself! (Sorry, that's how "Dallas" ended.) The cliffhanger I alluded to earlier in the ‘Tell Me Something Good’ section is about the shortcomings of green energy. So time to tell you something bad… about green energy.
Before you start thinking I’m voting straight ticket Libertarian party, I have to tell you that renewable energy does have some disadvantages. Let’s take solar energy, for example. Using California as a case study, there’s a thing called the “Duck Curve”, can you see it in the graph below? I promise this isn’t some corny Rorschach test.
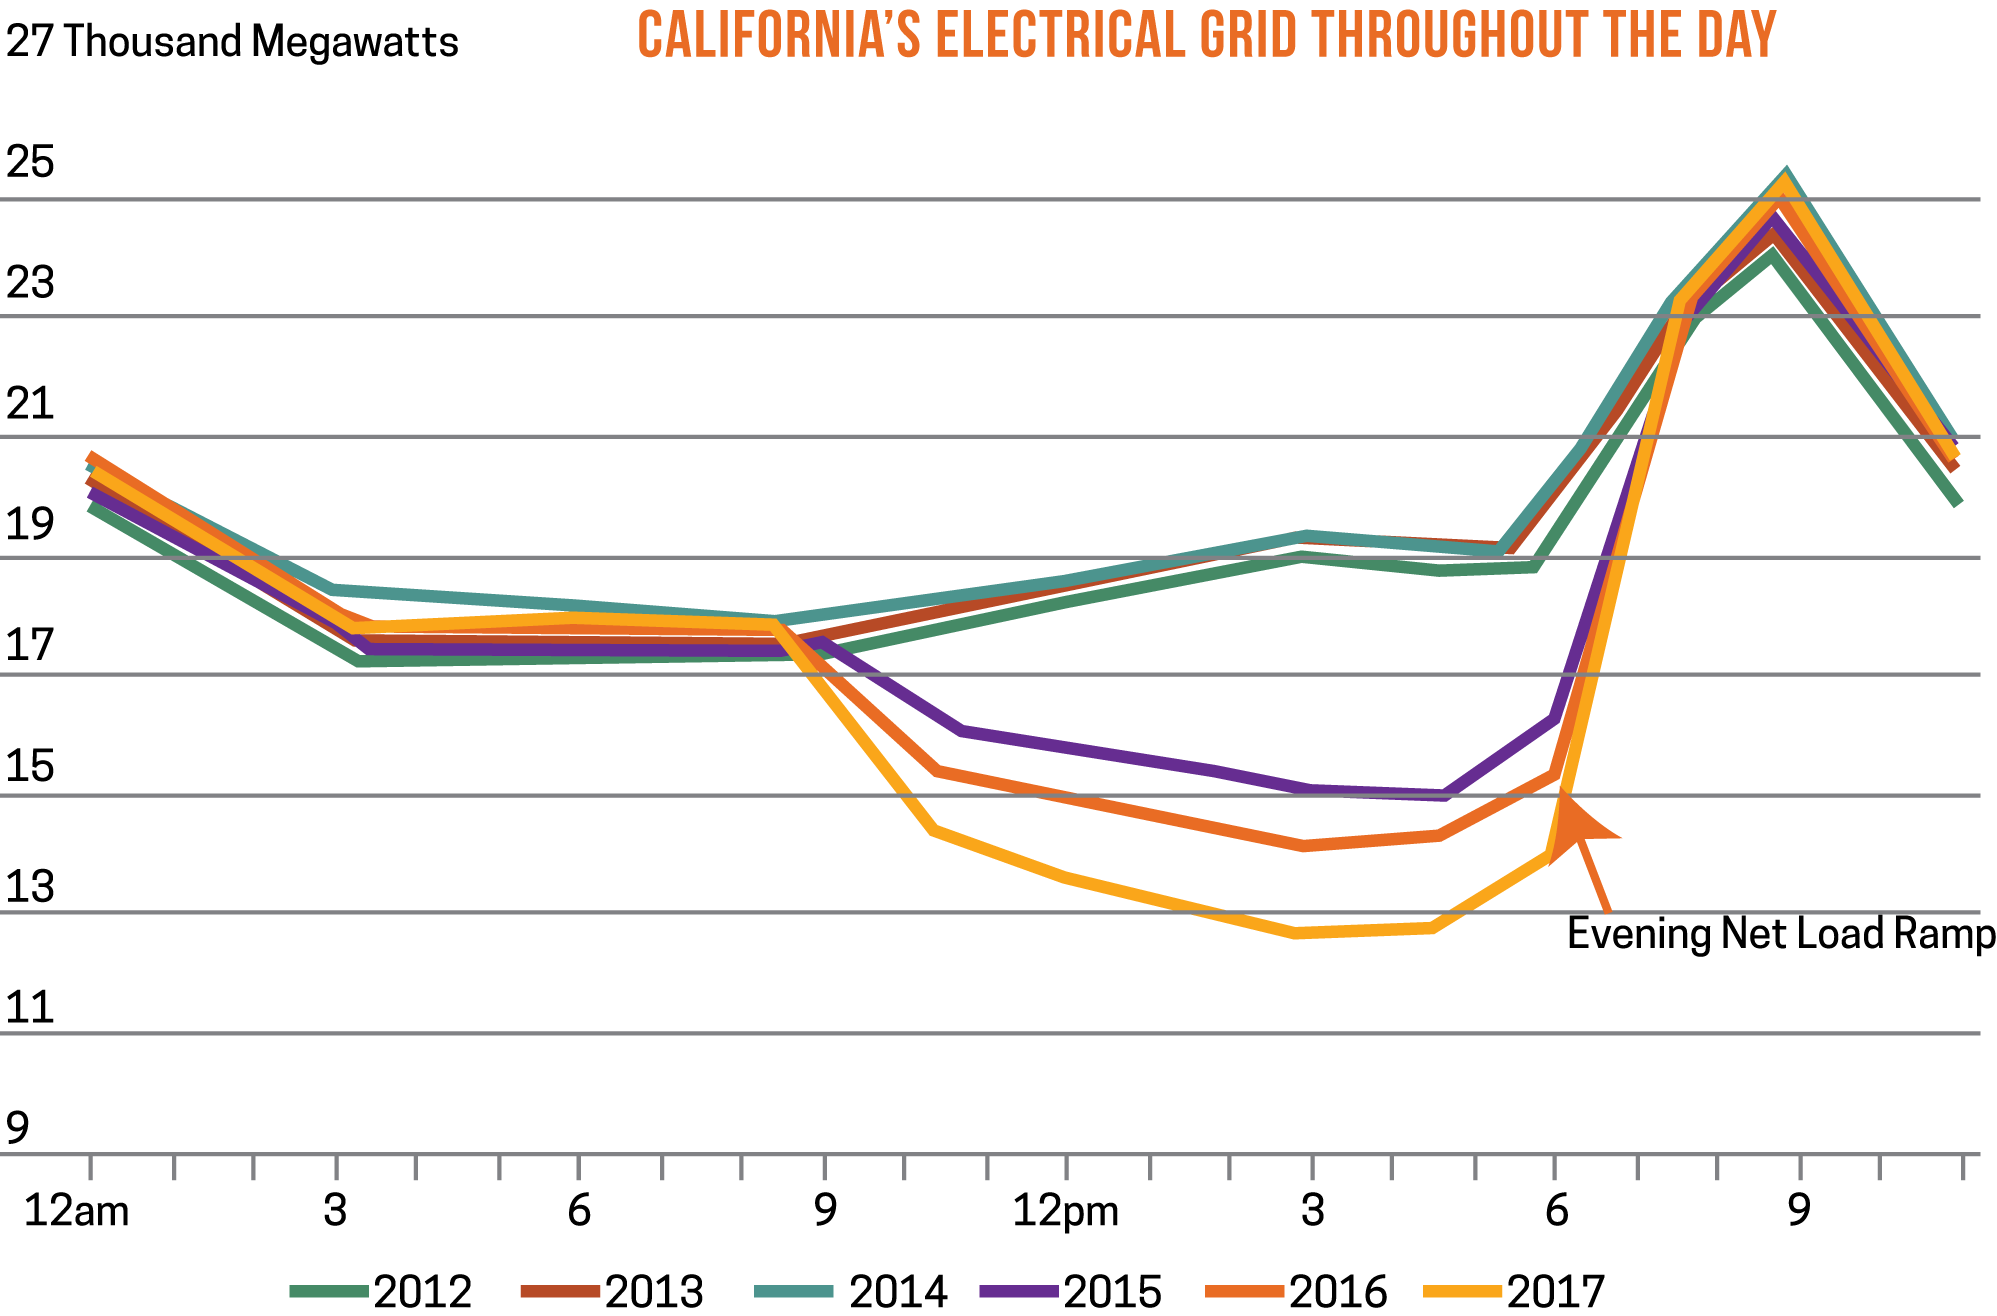
The duck curve is named for the shape the graph resembles when you plot the difference in energy demand during the day and amount of available solar energy at night. The deficit between solar energy production and grid demand causes a strain on the power grid when demands for energy are higher after dark.
When the sun shines during the day, the market is flooded with energy supply. However, when the sun sets and people get home to turn on a lamp, fix a bourbon and branch and watch TV, there’s less supply. (Sorry, but Dallas really is a good show, y’all.)
The renewable energy supply-demand discrepancy California experiences has become increasingly extreme since 2012. How is this solved? Well, until storage technology improves, solar will have to rely on traditional power sources to offset the shortage.
There’s another key factor in our energy discussion. Transportation.
Before you think, “Well let’s build wind turbines and electric vehicles, what do we need gas for?” Ask yourself this: When was the last time you saw someone sail a car like a catamaran? Or, why didn’t the Wright brothers use electric engines to fly their plane? Physics are a helluva drug.
First, let’s define the scope of how the energy produced by traditional and renewable sources is used.
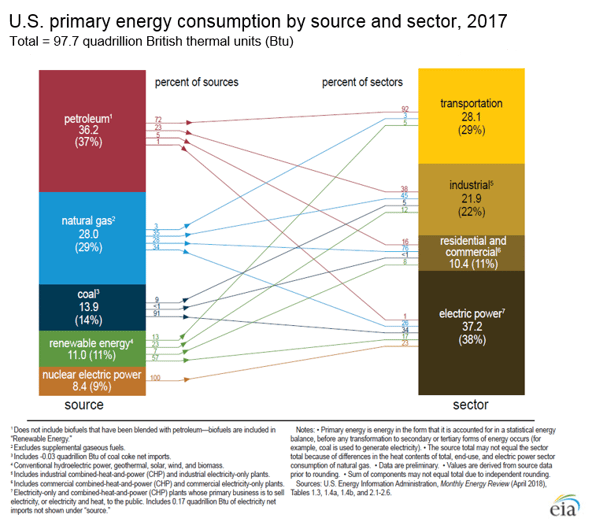
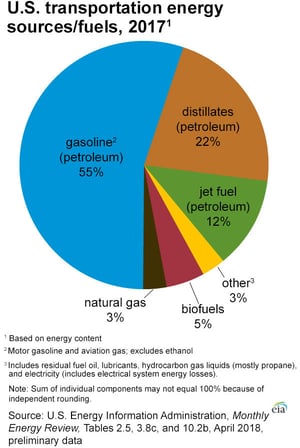
For all the strides renewable energy is making, Petroleum still maintains over a third of the U.S. energy production sector and fossil fuels dominate an 80% market share. Furthermore, while you can say the electric power sector is primed for a shift in the energy source mix, the second largest sector, transportation, still has a few more hurdles to jump. Your honor, I present exhibit B: U.S. transportation energy sources/fuels for evidence.
When it comes to the transportation sector, mechanical engineering likes to throw a wrench into plans to convert renewable energy into stored lithium batteries and/or electric-powered engines.
Taking the kids home from school in a Tesla Model 3 is very different than shipping bulk goods to a warehouse, or a Boeing 767 shipping a full load of Amazon Prime orders.
Now before the card is played, yes, I am aware Tesla’s cars are making huge strides in the field. Also, I know about the Tesla Commercial Semi Truck, but don’t think that hasn’t come with its own set of complications, both from an operating cost standpoint and physics standpoint. Plus, as exciting as electric motors are, jet engines are used in aircraft because they are very lightweight and use a comparatively small amount of fuel per unit of mass flowing through the engine. The Wright brothers discovered that fact, and we continue to affirm it today.
Long story short, thrust-to-weight ratios are very real, and petroleum-based engines outperform electric over a continuous length of time in transportation and logistics.
Cool, so we know a few shortcomings of renewables like solar power’s deficiency in the dark, as well as the limitations of renewables in mass cargo transit. Shortcomings, covered. Now, let’s bring it home!
Goodbye Yellow Brick Road
Seems like a good song title to end on, eh?
Wrapping it all up, the United States has exhibited prominent effects as a result of the shift in energy production from traditional to renewable sources since the 1970s including: a significant uptick in energy efficiency, a shift in types of new power construction, new job growth in renewable technology, more stable energy prices, and increased grid resiliency.
However, as of today we still rely heavily on traditional fossil fuels to power a majority of the nation’s economic activity and will likely continue to do so into the near future. Until technology can account for things like the “duck curve” or the inefficiencies of the electric motor in freight, renewables will have to settle for the most improved award and forego any championship dreams to fossil fuels.