It’s important to keep an eye on economic diversity, especially in times of economic uncertainty and when supply and demand are shifting. The Shannon-Weaver index is a powerful tool for measuring how evenly or unevenly the employment in any region is distributed among its industries. In today’s blog, we’re exploring how the S-W index works in IMPLAN and what it means for your economic impact studies.
Why Is Economic Diversity Important?
For an economy to withstand supply and demand shocks, it must either maintain its competitive advantage or have enough variety of industries to reemploy displaced workers1. While economic specialization takes advantage of economies of scale2 and competitive advantage3, the performance of a regional economy dominated by a single sector is likely to be closely tied to the performance of that sector, which can become a liability for the region if the core industry suffers a national or regional downturn4. Economic diversity is thought to enhance economic performance by shielding a region from the adverse effects of economic shocks and increasing the proportion of goods and services that can be produced locally (whether for intermediate or final demand), thereby slowing the leakage of money out of the local economy.
Measuring Economic Diversity
The Shannon-Weaver (S-W) entropy function5 has been used to calculate indices of economic diversity6. The S-W index measures the economic diversity of a region against a uniform distribution of employment where the norm is equi-proportional employment in all industries. In other words, it is a measure of the extent to which the employment of a region is evenly distributed among its industries. It ranges in value from zero to one, with zero indicating minimum diversity and a value of one indicating maximum diversity. A value of zero (complete specialization) occurs when the economic activity of a region is concentrated in only one industry. A value of one (perfect diversity) occurs when all industries are present in the region, with employment spread equally among them.
In IMPLAN, the S-W index for a region is calculated as follows:
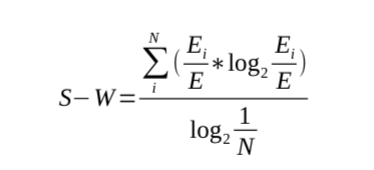
where Ei is employment in industry i, E is total employment, and N is the number of possible industries.
The S-W index therefore varies by region and year, and can prove very useful for mapping trends. For example, the figure below shows the changing economic diversity of U.S. counties, as measured by the S-W index, from 2001 to 2019.

Limitations and Important Considerations
The S-W index does not account for the fact that many industries are closely related and would therefore provide less protection were one of the other closely related industries to suffer a major decline. For example, a given region would receive the same S-W index if its 1,000 employees were spread in either of the two hypothetical patterns shown in the table below. While both cases have 1,000 employees and five industries, with employment spread evenly among the five industries, it should be apparent that Case 1 represents a much more diverse economy than Case 2. This subtle difference between the two cases is not reflected in the S-W index, which will be the same value in both cases.
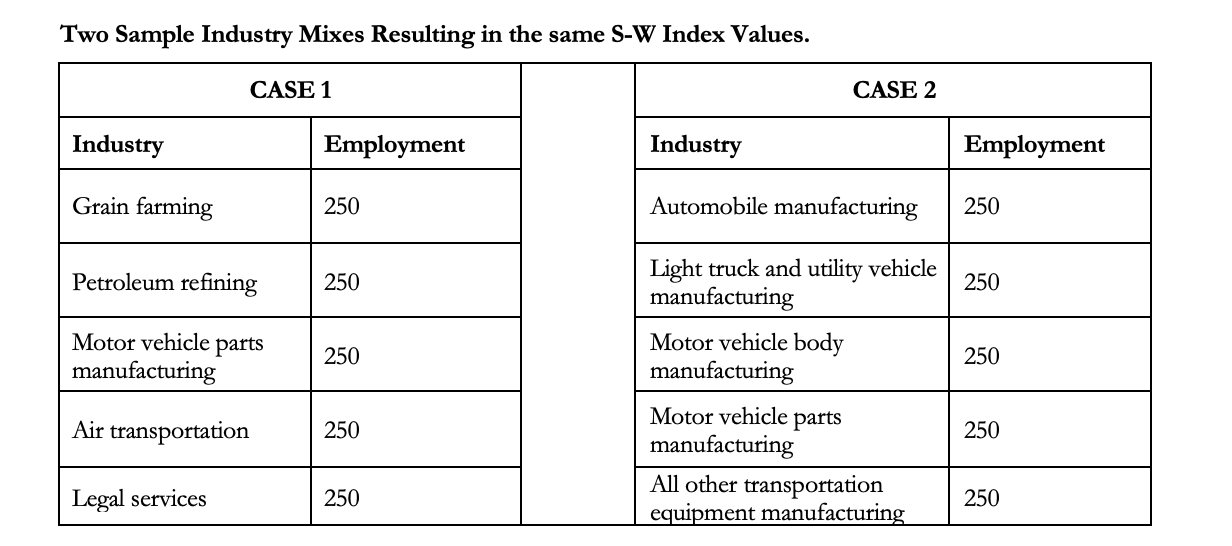
One might expect that aggregating closely related sectors together (e.g., aggregating all the sectors in Case 2 in the table above into a single “Auto industry”) would improve the S-W index by treating related sectors as a single sector rather than as distinct sectors. Yet the S-W index as currently calculated actually increases when the employment data are aggregated into a smaller number of related sectors. This occurs for two reasons: when a region’s employment data are aggregated into fewer sectors, a) there are fewer sectors with zero employment and b) the employment appears to be more evenly spread among those aggregated sectors – i.e. the aggregated sector smooths out the variation between the individual industries within the aggregated industry.
Another consideration relates to the comparison of S-W indices over time. In order for a year-over-year comparison to be valid, the S-W indices must have been calculated from data using the same sectoring scheme. Because the IMPLAN sectoring scheme changes when new BEA Benchmark I-O tables are published (roughly every five years), the number of IMPLAN sectors changes, which influences the S-W index calculation, and thus, the S-W index values. Thus, to compare S-W indices over time, one should use the time series data in IMPLAN’s online Data Library, in which all IMPLAN data dating back to 2001 have been re-estimated using the same, latest IMPLAN sectoring scheme, using current best practices and revised raw data where available.
Another consideration related to comparisons over time is that a loss of employment in a highly concentrated industry, all else equal, will cause a region’s S-W index to increase; yet no one would argue that the loss of employment was a good thing. In such a case, the increase in S-W index is not due to the region expanding into new industries or growing its fledgling industries, but rather the shrinkage of a dominant industry.
In the case of bedroom community counties (i.e. counties in which most residents commute to another county to work), a relatively low S-W index may represent less of a concern since for these counties, it is the economic strength of the county in which its residents work which is of most importance.
As the above notes make clear, interpreting S-W index values over time or across geographies is not always straightforward due to the influence of many factors on the S-W calculation. As such, it is best to investigate S-W index changes in the context of any changes in the underlying employment data. In light of this, as well as times and places where a certain degree of specialization is appropriate and desirable, the S-W index should not be used in isolation to proclaim a region’s economic health or prospects for future economic growth. Nonetheless, the S-W index can serve as a useful tool when considered alongside other metrics, both economic and non-economic.
Learn More About IMPLAN Today
Are you interested in harnessing the power of IMPLAN to better understand the economic diversity of your region and so much more? Schedule a demo today!