
Amazon HQ2: Gauging Its Impact

Much has been written regarding Amazon’s HQ2 decision and what factors ultimately led to the choice of Arlington, VA. In September 2017, Amazon requested proposals for their new headquarters in North America. Ultimately 238 cities across the U.S., Mexico, and Canada submitted bids. Amazon’s RFP stated that 8 million square feet would be required for the campus and approximately $5 billion would be invested in capital expenditures. Additionally, on-site mass transit, a skilled employee base and strong university system (to fill an estimated 50,000 jobs), and easy access to an international airport were ideal site features. However, tax incentives were the ultimate prize for the tech giant.
In order to maximize their potential offers, localities needed to understand their threshold to offer incentives. Economic impact analyses were a critical tool used by bidders for calculating the potential economic benefit that Amazon could bring to their locale, and, in turn, how significant any incentives offered could be. The analyses were a crucial step taken prior to the proposals, however they also informed actions taken after site selection.
Anticipated Impact
Being awarded Amazon HQ2 represented a “once-in-a-generation economic opportunity” for all interested cities. This statement is taken directly from the Greater Washington Partnership’s analysis of Amazon’s potential impact on the overall economic makeup of their region. The Greater Washington Partnership (GWP) super-region spans from Richmond, VA to Baltimore, MD and encompasses the Washington, D.C. metro area as well. In this region, federal government employees support a much larger portion of the economy than in any other metro area across the U.S. With this in mind, the GWP identified the HQ2 opportunity as the means to “create a more dynamic system that leverages our federal capabilities while ensuring long-term growth isn’t dependent on federal employment and spending.”
The GWP used IMPLAN to run multiple analyses in order to capture the total effects. They began with the construction impacts associated with the project. In the scenario, the construction of Amazon HQ2 would create an immediate need for more than 2000+ construction jobs. Spread over 11 years, construction would support a yearly average of 1,556 jobs. Construction spending would also support 744 indirect and induced jobs annually. This work would ultimately account for $1.2 billion in labor income and $1.5 billion in GDP growth between 2019 and 2030.
The construction impacts alone are salivation-inducing, but Amazon’s overall benefits on a yearly basis were unsurprisingly staggering. A total of 50,000 jobs would be created and maintained annually. From these direct employees, an additional 47,096 jobs would be supported through indirect and induced effects. Amazon jobs also represented $5 billion in annual labor income. An additional $3.2 billion in labor income would then be generated upstream for supported industries.
Post-Decision Analysis
Once the Crystal City announcement was made, groups across the Commonwealth of Virginia and throughout the region were interested in calculating and publicizing the impact that Amazon would bring to their respective locales. The Virginia Chamber Foundation partnered with a consultant to develop a report “in order to help the public understand this project’s potential to transform the region.” Most of the data plugged into IMPLAN to run the analysis was provided by Amazon, including intended jobs created, average salary, and construction cost data..
Amazon committed an estimated $1.8 billion in capital spending on the HQ2 project between 2019-2030 which equated to $1.1 billion in direct spending. Capital expenditure is a large economic contribution, but obviously pales in comparison to the ongoing impact from the company’s operations. In their analysis, the Virginia Chamber Foundation calculated the impact of operations at multiple points in time due to the scaling up of operations to full capacity of 25,000 employees in 2030. In 2021, 3,544 employees create a direct impact of just over $1 billion and support 4,719 jobs with $702.9 million of indirect and induced impacts. The noted impact increases considerably as the employee number expands through 2030. Overall, Amazon will support an average of 26,715 jobs and generate an average impact over $6.1 billion annually.
Virginia Employment Supported
| DIRECT | INDIRECT | INDUCED | TOTAL IMPACT | |
| 2021 |
3,544 |
1,591 | 3,127 | 8,263 |
| 2025 | 11,643 | 5,228 | 10,274 | 27,145 |
| 2028 | 19,850 | 8,913 | 17,517 | 46,280 |
| 2030 | 25,000 | 11,225 | 22,061 | 58,287 |
| Annual Average (2019-2030) | 11,459 | 5,145 | 10,112 | 26,715 |
Virginia Economic Impact in Millions
| DIRECT | INDIRECT | INDUCED | TOTAL IMPACT | |
| 2021 |
$1,009.8 |
$310.1 | $392.8 | $1,712.7 |
| 2025 | $3,546.8 | $1,089.2 | $1,379.5 | $6,015.5 |
| 2028 | $6,357.8 | $1,952.4 | $2,472.8 | $10,783.0 |
| 2030 | $8,279.4 | $2,542.6 | $3,220.2 | $14,042.2 |
| Annual Average (2019-2030) | $3,604.4 | $1,106.9 | $1,401.9 | $6,113.2 |
Commuters represent a sizable portion of the workforce in Northern Virginia. With this in mind, the Virginia Chamber Foundation was also interested in calculating the impact for the surrounding area—referred to as the Washington MSA. The Washington MSA consists of the District of Columbia; Counties of Frederick, Montgomery, Calvert, Charles, Prince George’s in Maryland; Counties of Arlington, Clarke, Culpepper, Fairfax. Fauquier, Loudoun, Prince William, Rappahannock, Spotsylvania, Stafford, Warren, and the Cities of Alexandria, Fairfax, Falls Church, Fredericksburg, Manassas, and Manassas Park in Virginia; and Jefferson County in West Virginia.
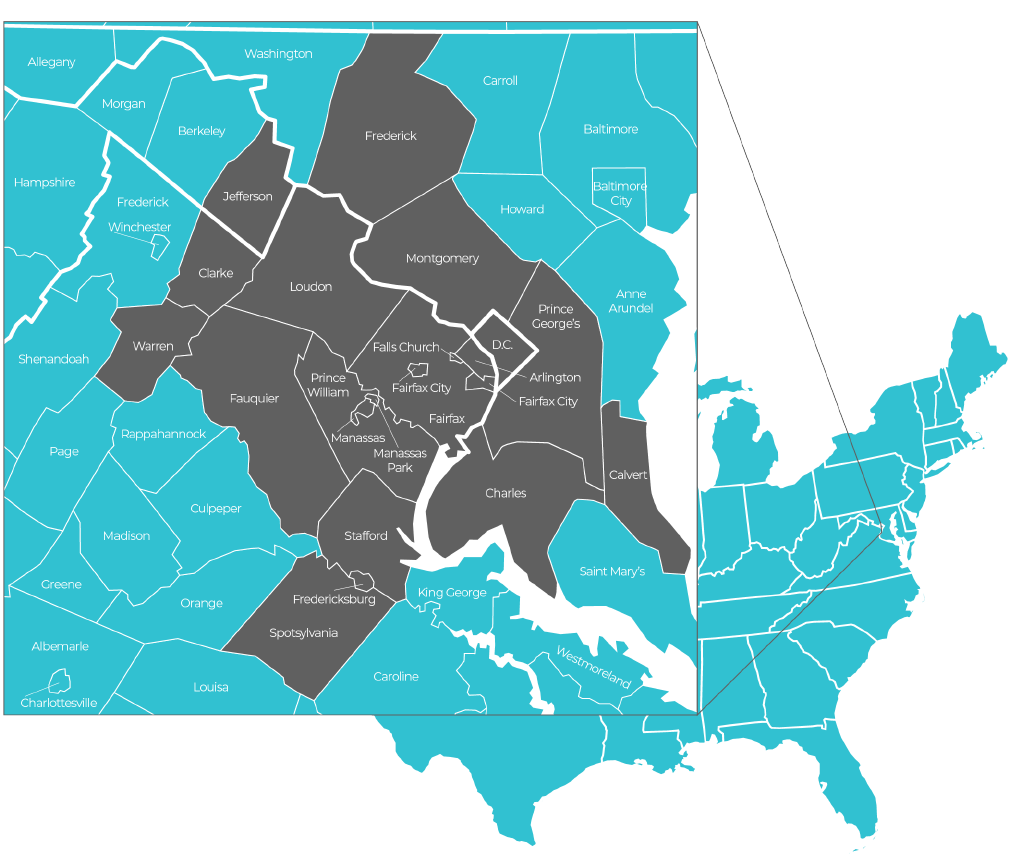
The surrounding regions outside of the state also receive a noteworthy boost from the infusion of business in the Commonwealth. In 2021, 5,094 jobs will be generated and $794.5 million of indirect and induced impact will be supported. Between 2019-2030, Amazon will support an average of 27,928 jobs and generate an average impact of over $6.4 billion annually within the Washington MSA.
Washington MSA Employment Supported
| DIRECT | INDIRECT | INDUCED | TOTAL IMPACT | |
| 2021 |
3,544 |
1,702 | 3,391 | 8,638 |
| 2025 | 11,643 | 5,593 | 11,141 | 28,377 |
| 2028 | 19,850 | 9,535 | 18,995 | 48,380 |
| 2030 | 25,000 | 12,009 | 23,923 | 60,932 |
| Annual Average (2019-2030) | 11,459 | 5,504 | 10,965 | 27,928 |
Washington MSA Economic Impact in Millions
| DIRECT | INDIRECT | INDUCED | TOTAL IMPACT | |
| 2021 |
$1,009.8 |
$345.0 | $449.5 | $1,804.3 |
| 2025 | $3,546.8 | $1,211.8 | $1,578.7 | $6,337.3 |
| 2028 | $6,357.8 | $2,172.2 | $2,829.9 | $11,359.9 |
| 2030 | $8,279.4 | $2,828.8 | $3,685.2 | $14,793.4 |
| Annual Average (2019-2030) | $3,604.4 | $1,231.5 | $1,604.3 | $6,440.2 |
Who Else is Impacted?
A separate study performed by Sage Policy Group (Sage) and Transwestern sought to specifically gauge the economic and office market impacts related to the Amazon HQ2 decision. They used Multi-Region Input-Output (MRIO) within IMPLAN in order to isolate the impact felt in neighboring locales from Amazon jobs—not additional job growth in adjacent industries. The two adjacent cities set to experience the greatest economic benefit from Amazon HQ2 are Washington D.C. and Alexandria. The analysis was split into 3 parts based on Amazon’s 3 defined capital investment phases set to occur within 15-17 years of their initial investment. Additionally, the effects felt from capital expenditures (single impact) and operations (recurring impacts) were modeled and represented separately.
Washington D.C. Capital Expenditure Impact
| INDIRECT | INDUCED | TOTAL IMPACT | |
| Phase I Jobs Supported | 11 | 27 | 38 |
| Phase I Output | $2,514,857 | $4,628,931 | $7,143,788 |
| Phase II Jobs Supported | 23 | 54 | 77 |
| Phase II Output | $5,067877 | $9,382,864 | $14,450,741 |
| Phase III Jobs Supported | 39 | 94 | 133 |
| Phase III Output | $8,677,537 | $16,065,929 | $24,743,466 |
| Total Jobs Supported | 73 | 176 | 248 |
| Total Output | $16,260,271 | $30,077,723 | $46,337,994 |
Washington D.C. Operations Impact
| INDIRECT | INDUCED | TOTAL IMPACT | |
| Phase I Jobs Supported | 229 | 50 | 279 |
| Phase I Output | $33,058,015 | $8,651,793 | $41,709,808 |
| Phase II Jobs Supported | 482 | 103 | 585 |
| Phase II Output | $69,147,303 | $17,911,190 | $87,058,493 |
| Phase III Jobs Supported | 758 | 161 | 919 |
| Phase III Output | $108,573,692 | $27,964,973 | $136,538,665 |
| Total Jobs Supported | 1,469 | 314 | 1,783 |
| Total Output | $210,779,010 | $54,527,956 | $265,306,966 |
Alexandria Capital Expenditure Impact
| INDIRECT | INDUCED | TOTAL IMPACT | |
| Phase I Jobs Supported | 9 | 26 | 35 |
| Phase I Output | $1,951,409 | $4,399,777 | $6,351,186 |
| Phase II Jobs Supported | 17 | 54 | 71 |
| Phase II Output | $3,932,432 | $8,919,606 | $12,852,038 |
| Phase III Jobs Supported | 29 | 91 | 121 |
| Phase III Output | $6,733,357 | $15,272,709 | $22,006,066 |
| Total Jobs Supported | 55 | 171 | 227 |
| Total Output | $12,617,198 | $28,592,092 | $41,209,290 |
Alexandria Operations Impact
| INDIRECT | INDUCED | TOTAL IMPACT | |
| Phase I Jobs Supported | 14 | 8 | 22 |
| Phase I Output | $3,068,267 | $1,373,807 | $4,442,074 |
| Phase II Jobs Supported | 29 | 17 | 46 |
| Phase II Output | $6,141,693 | $2,798,608 | $8,940,301 |
| Phase III Jobs Supported | 45 | 26 | 70 |
| Phase III Output | $9,547,443 | $4,346,680 | $13,894,123 |
| Total Jobs Supported | 88 | 51 | 138 |
| Total Output | $18,757,403 | $8,519,095 | $27,276,498 |
Outside of these two cities, the remaining Washington Metro Area was also analyzed for the induced and indirect impacts. This region was defined as Fairfax, Frederick, and Loudon Counties in Virginia and Montgomery, Prince George’s, and Prince William Counties in Maryland. This area in totality experienced a larger effect from capital expenditures than the District or Alexandria, but received a smaller economic benefit than D.C. from the site’s operations.
Remaining Washington Metro Area Capital Expenditure Impact
| INDIRECT | INDUCED | TOTAL IMPACT | |
| Phase I Jobs Supported | 36 | 22 | 58 |
| Phase I Output | $9,670,025 | $3,683,387 | $13,353,413 |
| Phase II Jobs Supported | 73 | 44 | 117 |
| Phase II Output | $19,486,798 | $7,443,531 | $26,930,330 |
| Phase III Jobs Supported | 125 | 74 | 199 |
| Phase III Output | $33,366,520 | $12,745,282 | $46,111,801 |
| Total Jobs Supported | 234 | 140 | 374 |
| Total Output | $62,523,343 | $23,872,200 | $86,395,543 |
Remaining Washington Metro Area Capital Operations Impact
| INDIRECT | INDUCED | TOTAL IMPACT | |
| Phase I Jobs Supported | 71 | 70 | 141 |
| Phase I Output | $19,675,967 | $13,053,810 | $32,729,779 |
| Phase II Jobs Supported | 142 | 142 | 285 |
| Phase II Output | $39,535,023 | $26,532,735 | $66,067,757 |
| Phase III Jobs Supported | 222 | 220 | 442 |
| Phase III Output | $61,425,470 | $41,160,765 | $102,586,235 |
| Total Jobs Supported | 435 | 432 | 867 |
| Total Output | $120,636,460 | $80,747,310 | $201,383,770 |
Wrapping It Up
Amazon’s search created not only unprecedented competition, but also collaboration between regions to attempt to lure the massive company. In order to present the most complete and enticing pitch, economic impact analyses were a critical step in informing the proposals. IMPLAN was chosen by many groups to not only put their best foot forward, but then provide context and outline economic plans after site selection had been locked in. By quantifying the impact, the region surrounding Crystal City could not only set their pitch apart, but create buy-in from all interconnected parties in the next steps of bolstering economic development.