
IMPLAN Impact Maps
Bring Your Economic Story to Life, Where It Matters Most
Economic impact analysis is powerful, but only if people understand it.
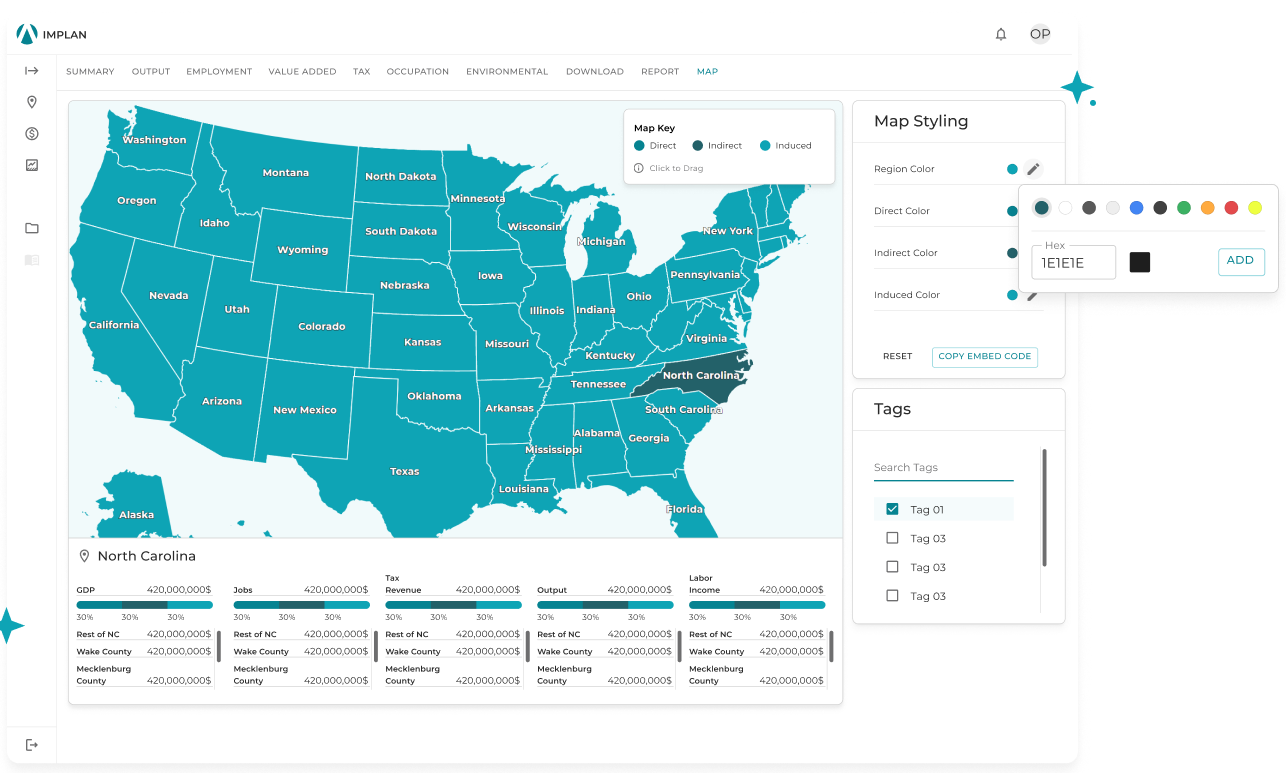
IMPLAN Impact Maps help organizations turn economic data into clear, interactive visuals that show where impacts occur and who they affect. These maps can be embedded directly into your website and make economic insight accessible to decision-makers, stakeholders, and the public, without requiring technical expertise or a development team.
From Analysis To Understanding
Too often, economic impact studies live in PDFs or spreadsheets that are hard to interpret and easy to overlook. IMPLAN Impact Maps transform economic analysis into an experience:
- Visual
- Location-specific
- Easy to explore
- Ready to share
By showing economic impact on a map, organizations can communicate value instantly, no explanation required.
What Are IMPLAN Impact Maps?
IMPLAN Impact Maps are interactive, web-based visualizations that display economic impact results, such as jobs, output, labor income, and tax revenue, across states and counties.
They are designed to be:
Interactive:
Users can hover and explore results by location
Publishable:
Embed maps directly on websites and digital reports
Accessible:
No coding, GIS expertise, or development support required
Designed For Real-World Communication
IMPLAN Impact Maps are used wherever economic insight needs to be understood quickly and clearly, including:
- Economic development websites
- Government and policy pages
- Grant and funding applications
- Sustainability and ESG reports
- Investor and stakeholder communications
- Research dashboards
- Economic development websites
- Government and policy pages
- Grant and funding applications
- Sustainability and ESG reports
- Investor and stakeholder communications
- Research dashboards
- Economic development websites
- Government and policy pages
- Grant and funding applications
- Sustainability and ESG reports
- Investor and stakeholder communications
- Research dashboards
- Economic development websites
- Government and policy pages
- Grant and funding applications
- Sustainability and ESG reports
- Investor and stakeholder communications
- Research dashboards
- Economic development websites
- Government and policy pages
- Grant and funding applications
- Sustainability and ESG reports
- Investor and stakeholder communications
- Research dashboards
- Economic development websites
- Government and policy pages
- Grant and funding applications
- Sustainability and ESG reports
- Investor and stakeholder communications
- Research dashboards
- Economic development websites
- Government and policy pages
- Grant and funding applications
- Sustainability and ESG reports
- Investor and stakeholder communications
- Research dashboards
- Economic development websites
- Government and policy pages
- Grant and funding applications
- Sustainability and ESG reports
- Investor and stakeholder communications
- Research dashboards
- Economic development websites
- Government and policy pages
- Grant and funding applications
- Sustainability and ESG reports
- Investor and stakeholder communications
- Research dashboards
- Economic development websites
- Government and policy pages
- Grant and funding applications
- Sustainability and ESG reports
- Investor and stakeholder communications
- Research dashboards
Instead of asking audiences to interpret tables or charts, Impact Maps let them explore the data themselves.
Why Visualization Changes The Conversation
Maps do something static reports can’t. They create shared understanding.
IMPLAN Impact Maps help organizations:
- Accelerate stakeholder alignment by making impacts immediately clear
- Increase strategic visibility with policymakers, funders, and communities
- Maximize the return on analysis by extending the life and reach of economic studies
By embedding maps directly into high-visibility touchpoints, economic insight stays visible long after the analysis is complete.

See Impact At Every Level
IMPLAN Impact Maps allow users to explore economic outcomes across:
States
Counties
Multi-state regions
Congressional Districts
Key metrics commonly visualized include:
Employment impacts
Economic output and GDP contribution
Labor income
Tax revenues
Industry-level ripple effects
Built for Clarity, Not Complexity
IMPLAN Impact Maps are intentionally easy to use.
Organizations can:
- Generate maps directly from IMPLAN analysis
- Customize visuals to align with branding
- Embed maps using a simple code snippet
- Share interactive results without relying on developers
If you can copy and paste, you can publish an impact map.
Impact Maps In Action: A Real-World Example
Imagine a major automotive manufacturer expanding operations across the Southeast.
Using IMPLAN Impact Maps, the organization can:
- Visualize employment impacts across multiple states
- Show county-level economic contributions
- Highlight indirect and induced job creation
- Communicate tax and income impacts clearly
These maps can be embedded directly into investor relations pages, government affairs sites, or public-facing reports, helping stakeholders see the economic footprint instantly.
The data stays rigorous. The story becomes clear.
Built On Trusted IMPLAN Analysis
IMPLAN Impact Maps are powered by the same trusted data and methodology used across the IMPLAN platform.
This means:
- Results are consistent with published economic impact studies
- Assumptions and inputs remain defensible
- Visuals reflect real economic relationships—not estimates or shortcuts
Turn Data Into a Story People Understand
Economic insight shouldn’t be locked behind spreadsheets or technical reports.
IMPLAN Impact Maps help organizations show their impact clearly, credibly, and where it matters most.
See Your Economic Impact On The Map
Discover how IMPLAN Impact Maps can transform your economic analysis into a compelling, interactive story, ready to share anywhere.