
New CEW Data Available Now

It’s that time again! Our data team here at IMPLAN works tirelessly to ensure that IMPLAN can offer the most comprehensive wage and salary dataset possible. Thanks to their efforts, the 2018 Census of Employment and Wages (CEW) dataset is complete and now available. Because of the level of detail and historic data available, the CEW data is perfect for establishing trends and running statistical analyses.
What Is It?
The Bureau of Labor Statistics (BLS) releases CEW data, however there are certain non-disclosures within their data. The data contains employment, wages, and establishments in a given sector and area (down to the county level) and contains this information down to the 6-digit NAICS level. This allows for even greater detail in specific modeling scenarios. Our team adds value by filling in these non-disclosures based on existing data to be able to provide a complete picture.
In order to compile the data and fill in the gaps of non-disclosed information, we start with the previous year’s data. If a number was disclosed, then a projection is generated based on the growth rate of that area. If it is not disclosed, we then go to the County Business Patterns (CBP) provided by the Census Bureau. CBP provides establishment and firm sizes in addition to establishment counts, and their firm size data informs IMPLAN CEW data. In the event that this CBP data is not available, ratios from higher geographic and/or NAICS aggregates are applied to establishment counts. Once these counts are established, we ensure that totals for the individual parts under the classification sum up to the original dataset. This means that all firms found at the 6-digit NAICS level need to sum to the established firm count at the 5-digit level. From the 5-digit level, firm count should sum to the 4-digit level and so on up to the 2-digit classification. If values are disclosed, however, the estimates are not necessary and the CEW number is not adjusted.
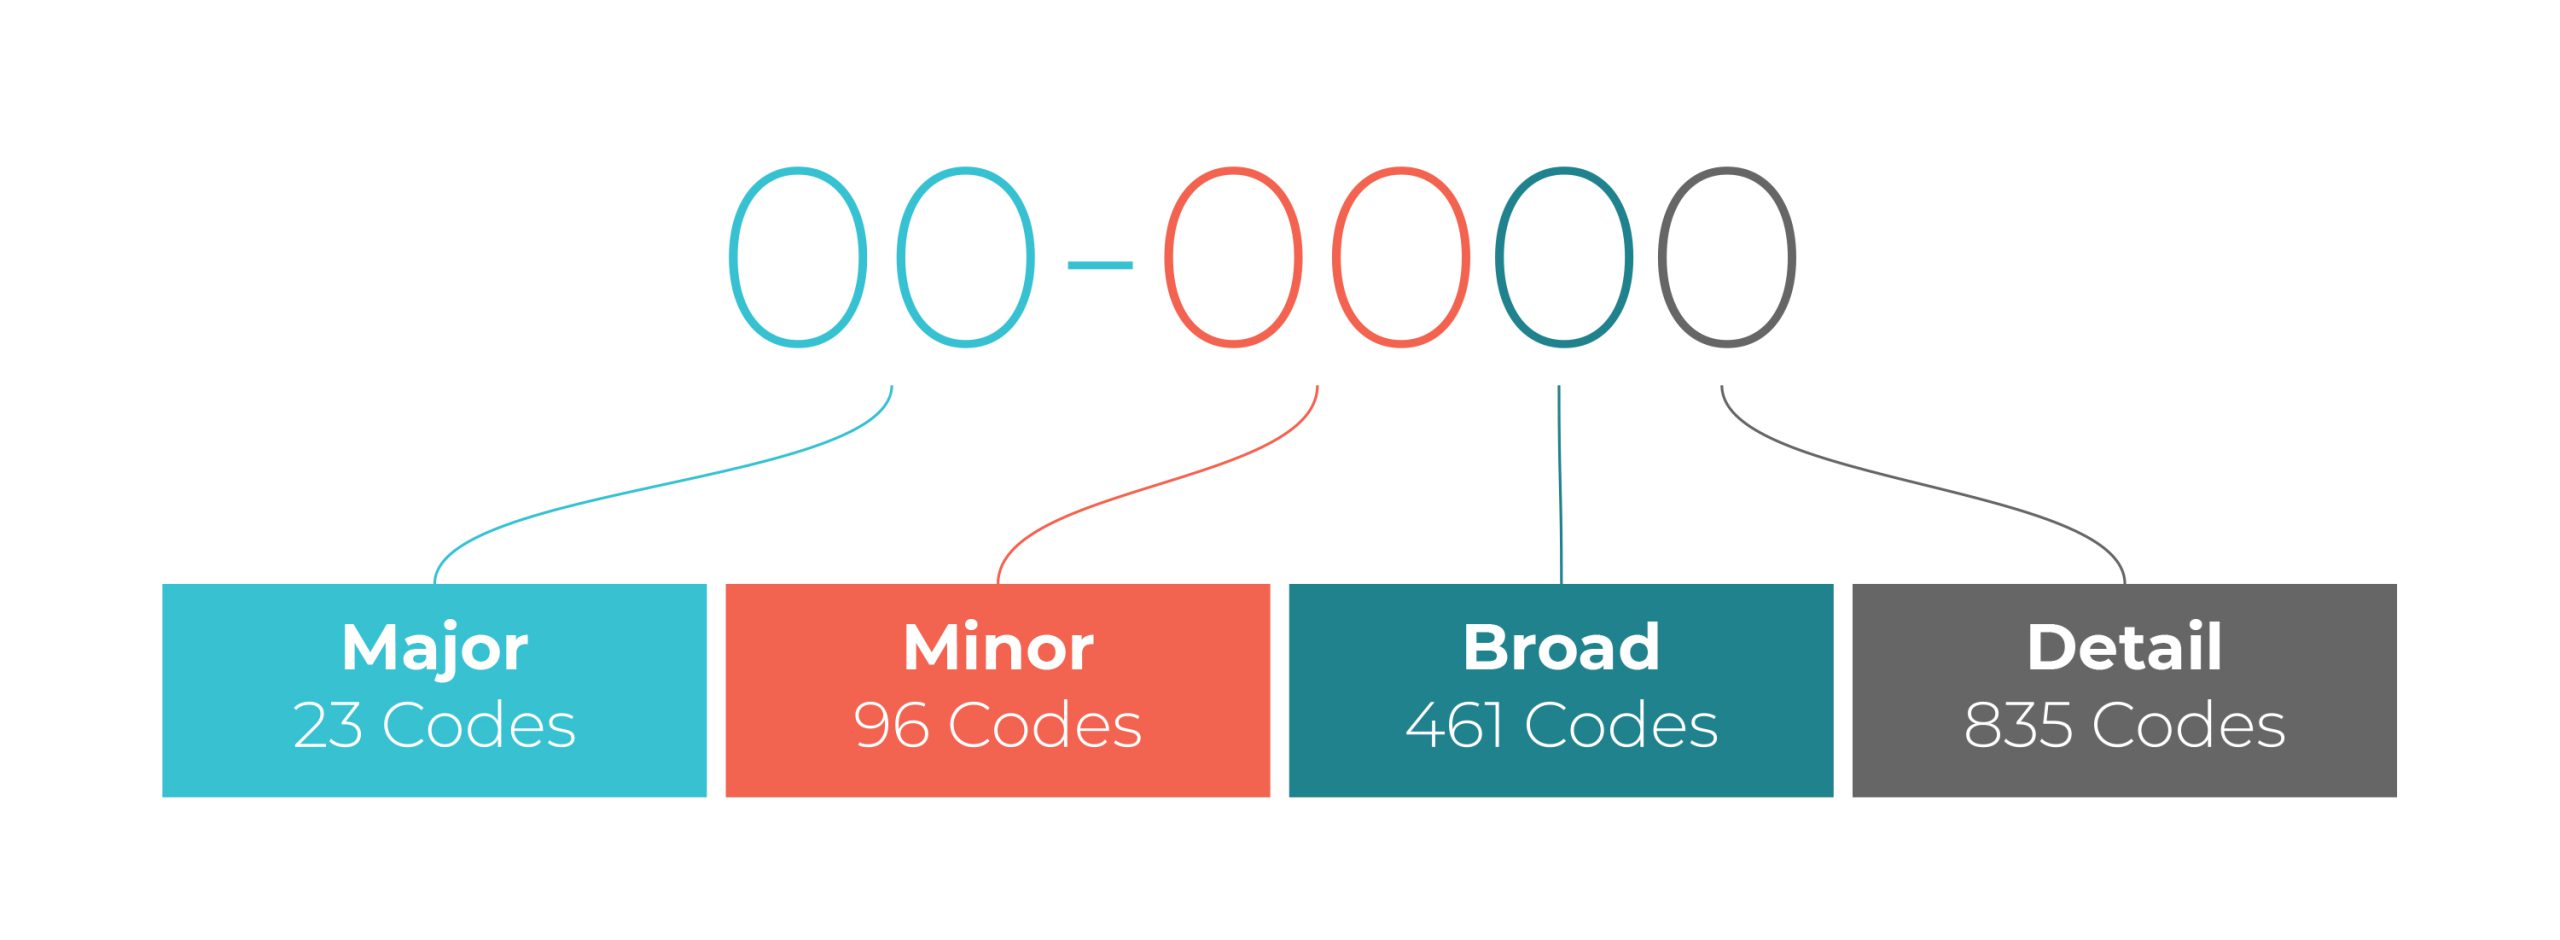
Interpreting NAICS Codes
What Can You Do With It?
With the sector detail provided and historical data available, the CEW data is useful for completing trend analyses and deep dives into U.S. wage and salary information. Drilling down into specified sector data allows for users to explicitly define the industry they wish to analyze at a granular level. You can see this in action in the 2018 Duluth Industrial Economy Report.
The Duluth Seaway Port Authority (DSPA) worked with the Initiative for a Competitive Inner City (ICIC) to complete an assessment of the industrial economy in Duluth, MN. The DSPA was interested in determining their economic impact in order to inform future economic development plans. The group analyzed the growth within the aggregated industrial sector, growth in the overall economy, and growth in the rest of the economy with the corresponding decline in the industrial sector. In this process, they used CEW data to classify clusters within the industrial sector in order to identify clusters of businesses which represented potential significant economic contributors for both Duluth and their MSA. Some specified “competitive clusters” they determined did provide economic advantages were water transportation, end user chemical product manufacturing, leather and related product manufacturing, aviation, and paper and packaging manufacturing.
Businesses Contained in Duluth Competitive Clusters
| INDUSTRIAL CLUSTER | BUSINESS SECTORS INCLUDED | EXAMPLES OF DULUTH BUSINESSES |
| Water Transportation |
Boat Building, Deep Sea Freight Transportation, Coastal and Great Lakes Freight Transportation, Port and Harbor Operations, Marine Cargo Handling, Other Support Activities for Water Transportation |
Julian Boatworks, Great Lakes Fleet, Picklands Mather – Lake Services, Hallett Dock Company, Lake Superior Warehousing, National Cargo Bureau |
| End User Chemical Products | Paint and Coating Manufacturing, Photographic Film, Paper, Plate, and Chemical Manufacturing | Arrowhead Paint Products, Ikonics Corporation |
| Leather and Related Products | Textile Bag and Canvas Mills, All Other Leather Good and Allied Product Manufacturing | Empire Canvas Work, Duluth Pack |
| Aviation | Search, Detection, Navigation, Guidance, Aeronautical, and Nautical System and Instrument Manufacturing, Aircraft Manufacturing, Aircraft Engine and Engine Parts Manufacturing, Other Aircraft Parts and Auxiliary Equipment Manufacturing | Sextant Sailing Society, Ltd., Cirrus Aircraft, AAR, Northstar Machine & Tool Company, Inc. |
| Paper and Packaging | Paper (except Newsprint) Mills, Corrugated and Solid Fiber Box Manufacturing | Verso Corporation, Superior Packaging Company |
This analysis was coupled with an economic impact study of the overall industrial sector. The researchers determined the industrial sector was associated with a greater job multiplier (1.78) than the rest of the economy (1.49). Using CEW data allowed for the ICIC to identify economically beneficial sectors contained within the industrial umbrella and pinpoint businesses within these sectors. With high-return industrial assets identified, the DSPA was equipped with the information necessary to develop priorities for catalyzing economic growth.
What’s Next
CEW data is the first sign that more new data releases are right around the corner! To learn more about the CEW data and see it in action check out our webinar. You can also download a sample dataset here.