
A Brief History of Input-Output

Late in the summer of 1949, Wassily Leontief fed the 25-ton computer the last of the stiff paper punched with precisely-placed holes. The machine at Harvard University now had hundreds of thousands of data points about the United States economy.
Eventually, the calculations by this early version of a computer would help Leontief form a groundbreaking picture of the mammoth United States economy. The Harvard professor would emerge as the father of input-output analysis, and his work would catapult him to worldwide acclaim when he received the Nobel Prize in economics in 1973.
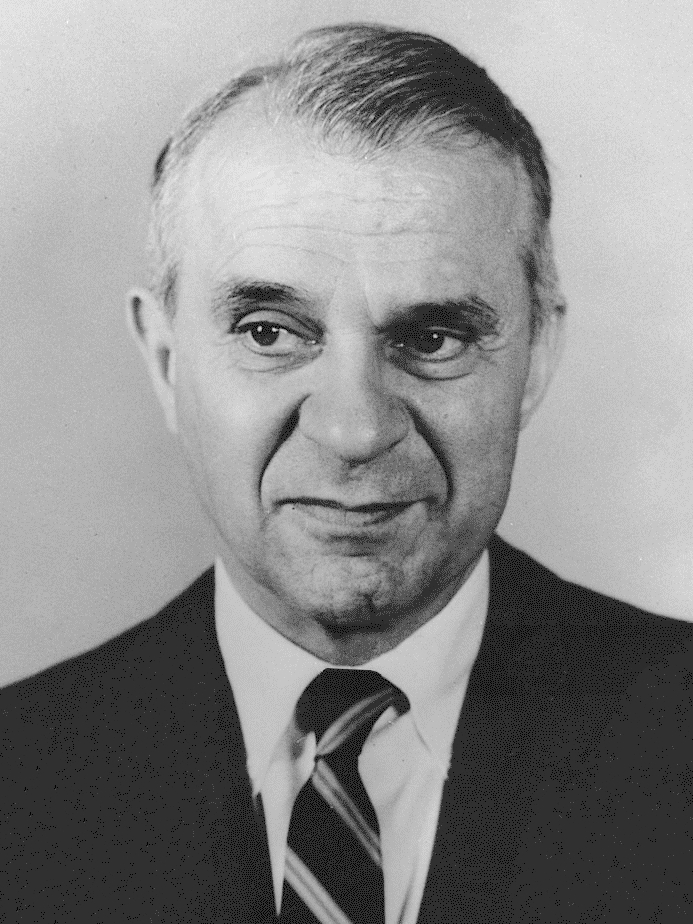
With that 25-ton computer, Leontief finally created what he dreamed about for years, and input-output analysis would go on to become a bedrock principle in economics.
WHAT IS INPUT-OUTPUT ANALYSIS?
TIC-TAC-TOE THAT CHANGED ECONOMIC STUDY
Essentially a giant tic-tac-toe grid, input-output macroeconomic analysis shows how different sectors of the economy are interconnected.
Industries are listed in both the heads of each row and each column in this massive grid. Each column is then filled with data on the amount needed in each part of production for the industries. Each number down the steel industry column, for example, demonstrates the amount the steel industry needs from the construction, chemical, railroad, shipping, or the automobile industries.
Rows are filled with numbers on that industry’s output: what it sells to the industries listed in the columns. The numbers in the row for the steel industry represents steel sales to the automobile, construction, chemical industries, and so on, in order for those industries to produce their product.
In the end, the grid can easily demonstrate how a change in one sector sends a ripple effect throughout the rest of the economy.
WHY DOES IT MATTER? GETTING UNDER THE HOOD OF THE ECONOMY
Leontief dreamed about creating such a table for years. Not long after he entered the University of Leningrad at 15 years old, Leontief talked about producing a tool enabling nations to plan and avoid economic hardship.
And he wasn’t alone. French economist Francois Quesnay of the 18th century produced a rudimentary table showing the flow of goods from one industry to another in the hope of proving agriculture was the source of all wealth (Quesnay failed, by the way, because he didn’t account for other industries which could create surplus commodities or byproducts).
Both scholars recognized the value in painting such an economic picture. But actually making the dream a reality belongs to Leontief. The Harvard professor traveled a long way to accomplish it.
Among Leontif’s earliest memories is Lenin addressing a crowd in front of the Winter Palace. A vocal critic of the communist principles settling into Russia in the early 20th century, Leontief eventually left Russia to study in Berlin.
He ended up at Harvard University after brief stints advising the Government of China on railroad networks and studying at the National Bureau of Economic Research in New York. Grants, an assistant, and that Mark II computer at Harvard University gave Leontief the tools to finally see his dream through.
Once Leontief developed input-output analysis, its implications were far-reaching. Countries used it to calculate important measures like gross domestic product. Leontief’s tables are commonly used by the World Bank, the United Nations, and the U.S. Department of Commerce.
Industries employ the analysis to see how an investment or cut-back would affect operations. For example, General Electric predicted how the Arab oil boycott in 1973 would affect demand for its products and services—from light bulbs to turbines—by loading data from 184 sectors of the economy.
On a smaller scale, local governments also widely use the analysis to make the case for public investment. The analysis often serves as the foundation for government-commissioned economic studies to show the project’s impacts, including the value of the supplies needed, the jobs created to build the project, and the money flowing into the economy when those workers hired for those new jobs spend their paychecks.
IMPLAN uses input-output analysis to capture “monetary market transactions between industries in a given time period,” and has even expanded on that to include transactions “between industries and institutions and between institutions themselves, thereby capturing all monetary market transactions in a given time period.”
It’s also led to new discoveries. The analysis helped Leontief stumble on figures that contradicted previous understandings of how nations interact with one another. In what became known as the Leontief paradox, Leontief showed that U.S. exports relied on labor to a greater degree than U.S. imports. This was the opposite of economists’ expectations given high U.S. wages and the high amount of capital per worker, according to Leontief’s biography in the Library of Economics and Liberty. Economists have since resolved the paradox, the Library continues, by showing that this situation can occur in a country producing more than two goods.
At times, the analysis’ implications were so far-reaching that they could invoke fear. The Eisenhower administration took away the grant money Leontief was using to expand the input-output model because they felt it harkened too much to communist principles.
In time, Leontief’s contribution was widely recognized. The input-output analysis model won the Nobel Prize in economics in 1973. At the award ceremony, Leontief answered a question about how he developed the analysis by repeating a sentiment he had raised many times before: “Oh, it’s really very simple—what I wanted to do was collect facts.”
Leontief often complained how his economic colleagues wrestled more with abstract theories rather than going out into field to test the theories’ applicability.
He was so dedicated to collecting figures in the field that before Harvard supplied him with the Mark II computer, Leontief and his assistant were manually crunching numbers gathered from the U.S. Bureau of Labor Statistics.
It was all part of his mission to get, as he said, “under the hood” of the economy.