IMPLAN isologo
Drag
Play
IMPLAN
  • Products
    • Product
      • IMPLAN Software
    • By Geography
      • United States
      • Global
      • Canada
    • Capabilities
      • API
      • Data Library
      • Forward Linkages Suite
      • Support Services
  • Why IMPLAN?
    • Why IMPLAN?
      • Economic Impact Analysis
      • Trusted Data Sources
      • Environmental Impacts
      • Job and Employment Impacts
      • Tax Impacts
    • Reporting
      • Step by Step Guides
      • Embeddable Maps
      • Reporting and Insights
  • Solutions
    • By Industry
      • Academic
      • Agriculture
      • Associations
      • Consulting
      • Corporations
      • Economic Development
      • Energy
      • Finance
      • Government
      • Healthcare
      • Manufacturing
      • Real Estate
      • Tourism
    • By Use Case
      • Advocacy
      • Climate Risk Modeling
      • Data Aggregation
      • Economic Footprint
      • Education & Research
      • Environmental (ESG)
      • Grants and Funding
      • Natural Disasters
      • Policy Change
      • Scope 1, 2, 3 Emissions
      • Site Selection
      • Supplier Diversity
      • Tariffs
      • Tax Strategy
      • University Libraries
  • Pricing
  • Resources
    • Resources
      • Blog
      • Case Studies
      • Webinars
      • White Papers
      • E-Books
      • Reports Using IMPLAN
      • IMPLAN Certified Economist Program
      • IMPLAN Press Resources
      • IMPLAN Training
  • About
    • About
      • Careers
      • Company
      • IMPLAN FAQ
      • History
      • Contact Us
  • Log In
  • Support
  • Book a Demo
MenuClose
  • Products
    • Product
      • IMPLAN Software
    • By Geography
      • United States
      • Global
      • Canada
    • Capabilities
      • API
      • Data Library
      • Forward Linkages Suite
      • Support Services
  • Why IMPLAN?
    • Why IMPLAN?
      • Economic Impact Analysis
      • Trusted Data Sources
      • Environmental Impacts
      • Job and Employment Impacts
      • Tax Impacts
    • Reporting
      • Step by Step Guides
      • Embeddable Maps
      • Reporting and Insights
  • Solutions
    • By Industry
      • Academic
      • Agriculture
      • Associations
      • Consulting
      • Corporations
      • Economic Development
      • Energy
      • Finance
      • Government
      • Healthcare
      • Manufacturing
      • Real Estate
      • Tourism
    • By Use Case
      • Advocacy
      • Climate Risk Modeling
      • Data Aggregation
      • Economic Footprint
      • Education & Research
      • Environmental (ESG)
      • Grants and Funding
      • Natural Disasters
      • Policy Change
      • Scope 1, 2, 3 Emissions
      • Site Selection
      • Supplier Diversity
      • Tariffs
      • Tax Strategy
      • University Libraries
  • Pricing
  • Resources
    • Resources
      • Blog
      • Case Studies
      • Webinars
      • White Papers
      • E-Books
      • Reports Using IMPLAN
      • IMPLAN Certified Economist Program
      • IMPLAN Press Resources
      • IMPLAN Training
  • About
    • About
      • Careers
      • Company
      • IMPLAN FAQ
      • History
      • Contact Us
  • Log In
  • Support
  • Book a Demo
Blog

IMPLAN’s User Interface Redesign: Everything You Need to Know About the Newest Release

IMPLAN Team
October 16, 2023
By IMPLAN Team
Home / Blog / IMPLAN’s User Interface Redesign: Everything You Need to Know About the Newest Release

If you’ve logged into IMPLAN Cloud in the last month, you may have noticed that the app has undergone a makeover! While we frequently make updates and improvements to IMPLAN Cloud, we’re particularly excited about this batch of changes to our user interface. Our Product Development team has been hard at work making it easier than ever to perform economic impact analysis, and we’re so excited to show you what’s new in the IMPLAN Cloud application.

The current version of IMPLAN, was released December 14, 2022, with product updates occurring every 8-10 weeks. Most IMPLAN updates include new features, processing improvements, data additions, and small changes to the application’s appearance. However, the most recent update focused on the appearance and functionality of the application. On August 30, we released a major redesign of the look and feel of the IMPLAN Cloud application. Let’s take a look!

Dashboard

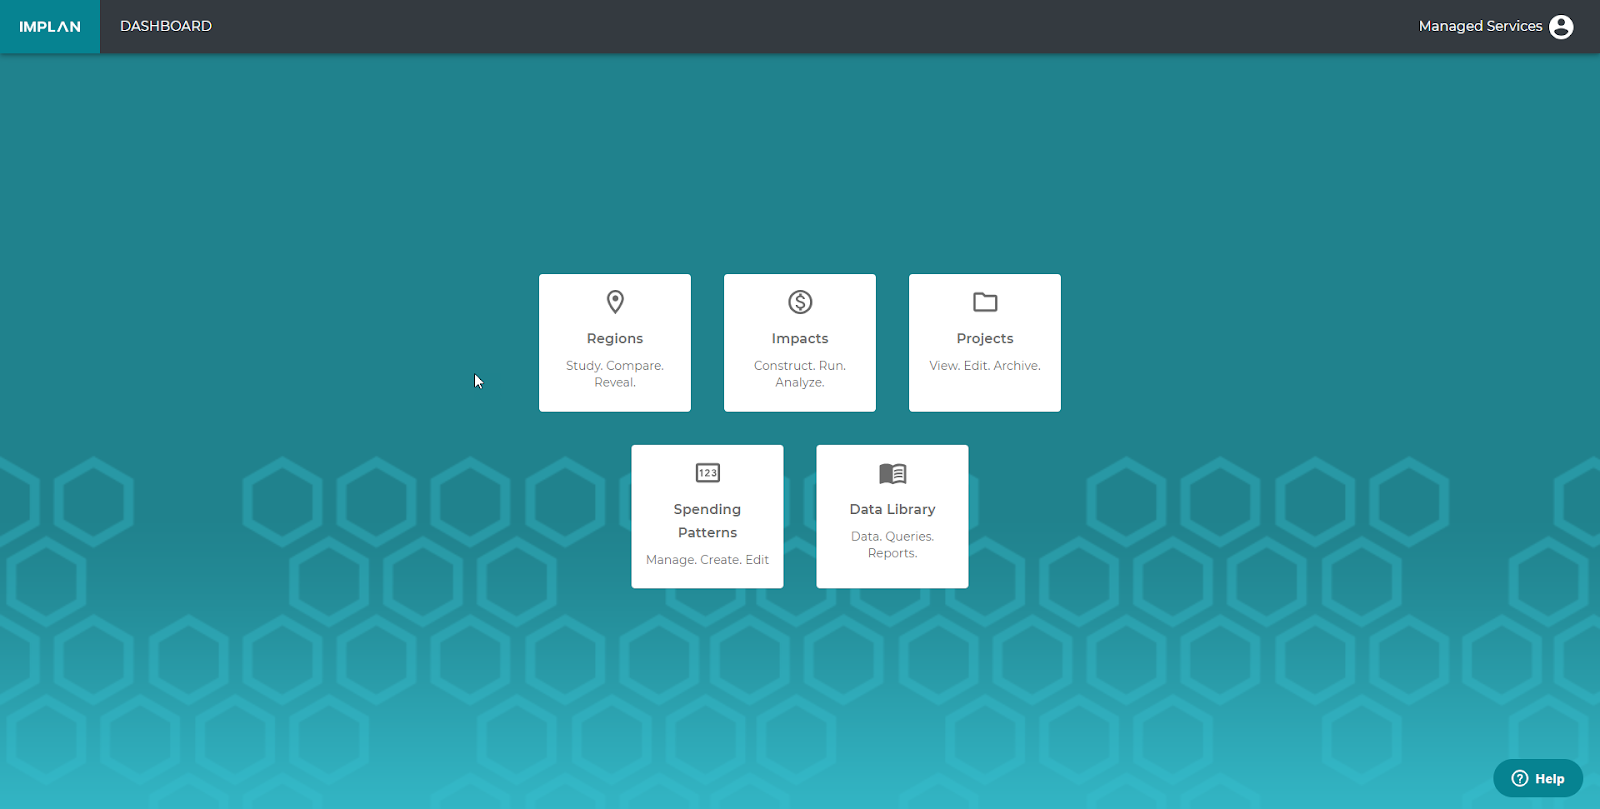
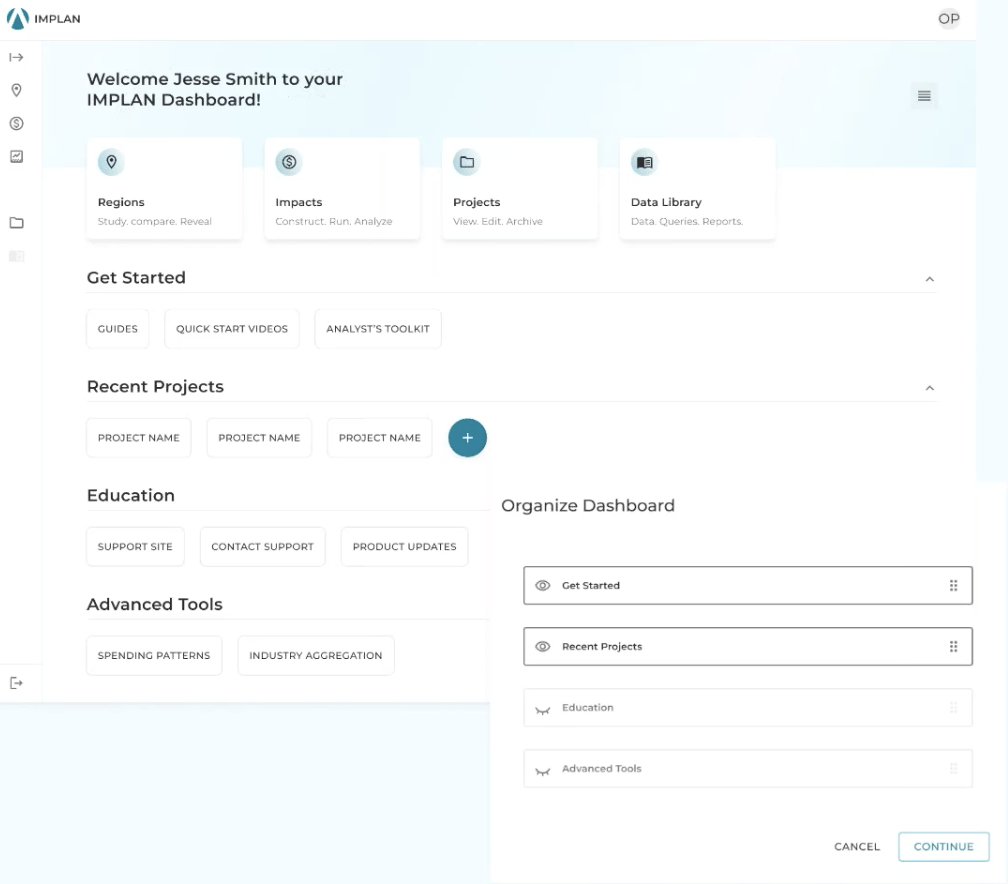
Like with any application, IMPLAN’s dashboard is the centralized location for its primary functionality and content. You can think of it as the “home” page. The dashboard’s job is to get you where you need to go in order to perform the task you want to perform, whether that’s exploring Data Library, running a brand new economic impact analysis, or returning to an existing one!

We’ve updated the dashboard based on user feedback, industry standards, and market research. We aimed to give users a more customizable experience that will get them to results faster.

We’ve also made sure to organize the new dashboard in such a way that our developers can add in the new features they’re cooking up!

Here’s what IMPLAN Cloud’s dashboard looked like before the redesign:
And here’s what it looks like now:
Navigation

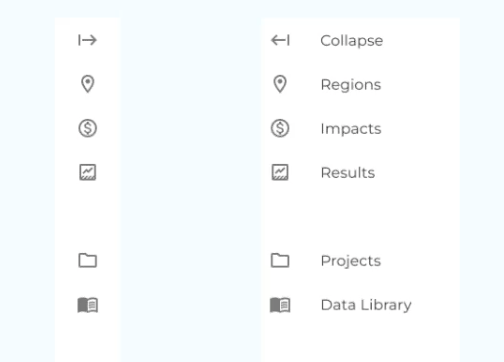
IMPLAN Cloud’s old navigation was limited to a horizontal bar at the top of the screen.

If you were not already inside a project, you had to go back to the dashboard in order to access the other areas. We’re happy to share, that is no longer the case!

With our new vertical navigation, shown below, you can complete your tasks far more easily. The vertical navigation is now available on the left side of your screen within the application. Don’t worry – horizontal navigation is still included too.
Icons

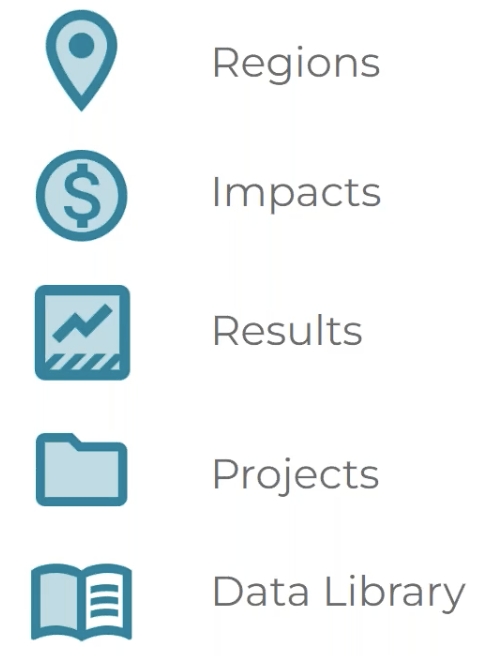
At IMPLAN, we have our own icons that we use within our application and support site to convey ideas to users. We have updated our icon library to adhere to our new design system and web standards. We considered what our users would find intuitive and garnered inspiration from Google’s interface.

We built our new icons using a 24×24 pixel grid. We also used keylines to keep the icons visually balanced regardless of the orientation of their component parts.

Here are some of our favorite new IMPLAN icons:
The expansion of our icon library will be an ongoing process. As new features and functions are added to the application, we will add new icons to support them.

Other Recent Product Updates

While the main attraction of the latest  release is the redesign, we’d be remiss in not mentioning some of the other exciting new features that came along with this release:

  • The scaling feature has been improved. Scaling features are enabled on the Impacts page for either an event or group. Previously they were limited to whole numbers, but now you can enter up to two decimal places.
  • The event template (a downloadable file from the support site that allows users to manually enter events in an Excel file, then import those Events on the impacts page) has been updated with matching column headings. The validations have been improved to avoid error warnings.
  • The detailed tax results download feature has been improved and now downloads your results broken out by Direct, Indirect, Induced; government level (federal, state, county, sub county special district, and sub county general); and by tax type (OPI, TOPI, personal tax, and social insurance tax categories).
  • When you add a new industry by customizing a Region, IMPLAN previously generated the Commodity supply for the Commodities produced by the Industry. However the analysis build engine did not recognize that Commodity supply. Now, when you add a new Industry to your Region through customization, you can also run it as a Commodity Event.

See the Redesign in Action

Want to see the IMPLAN redesign in action? We invite you to watch our recent webinar, which includes a walkthrough of these new features. If you’d prefer something a little more hands-on, or want to chat about how IMPLAN can help you make better decisions – now faster and easier than ever before – we hope you’ll schedule a demo with a member of our team!

Why IMPLAN?

Put simply, IMPLAN is built for everyone.

Together, our software and data give you a window into your region of study — like one gigantic transaction log for the local economy. Chances are that if your project or business has a financial component, then IMPLAN can reveal some sometimes surprising detail about how your project relates to the local, state, or national economy.

What used to take economists weeks can be done in minutes. By anyone! But you're not alone, IMPLAN's best benefits go beyond the work done in the tool:

  • Instills confidence in your analyses
  • Easy to learn and use
  • Outstanding customer support
  • Access to orientations, trainings, and project consultations
Get a Demo
Want to
try it out?
Get a Demo
Ready to
dive in?
Request Pricing
Still have
questions?
Talk To An Expert
  • IMPLAN

    Economic input output modeling application, data, and solutions.


    IMPLAN © Copyright 2026

  • Contact

    8935 Northpointe Executive Park Drive
    Suite 125
    Huntersville, NC 28078

    (800) 507-9426

    support@implan.com

    Contact Us

    Media Inquiries

  • Reference

    Privacy Policy
    Website Terms of Service
    Citation Guidelines
    Security, Privacy and Compliance

  • Navigation

    Product
    Solutions
    Use Cases
    Resources
    Pricing
    Support
    Sign in
    Careers