IMPLAN isologo
Drag
Play
IMPLAN
  • Products
    • Product
      • IMPLAN Software
    • By Geography
      • United States
      • Global
      • Canada
    • Add-Ons
      • AI
      • API
      • Data Library
      • Forward Linkages Suite
      • Support Services
  • Why IMPLAN?
    • Why IMPLAN?
      • Economic Impact Analysis
      • Trusted Data Sources
      • Environmental Impacts
      • Job and Employment Impacts
      • Tax Impacts
    • Reporting
      • Step by Step Guides
      • Embeddable Maps
      • Reporting and Insights
  • Solutions
    • By Industry
      • Academic
      • Agriculture
      • Associations
      • Consulting
      • Corporations
      • Economic Development
      • Energy
      • Finance
      • Government
      • Healthcare
      • Manufacturing
      • Real Estate
      • Tourism
    • By Use Case
      • Advocacy
      • Climate Risk Modeling
      • Data Aggregation
      • Data Centers
      • Economic Footprint
      • Education & Research
      • Environmental (ESG)
      • Grants and Funding
      • Natural Disasters
      • Policy Change
      • Scope 1, 2, 3 Emissions
      • Site Selection
      • Supplier Diversity
      • Tariffs
      • Tax Strategy
      • University Libraries
  • Pricing
  • Resources
    • Resources
      • Blog
      • Case Studies
      • Webinars
      • White Papers
      • E-Books
      • Reports Using IMPLAN
      • IMPLAN Certified Economist Program
      • IMPLAN Press Resources
      • IMPLAN Training
  • About
    • About
      • Careers
      • Company
      • IMPLAN FAQ
      • History
      • Contact Us
  • Log In
  • Support
  • Book a Demo
MenuClose
  • Products
    • Product
      • IMPLAN Software
    • By Geography
      • United States
      • Global
      • Canada
    • Add-Ons
      • AI
      • API
      • Data Library
      • Forward Linkages Suite
      • Support Services
  • Why IMPLAN?
    • Why IMPLAN?
      • Economic Impact Analysis
      • Trusted Data Sources
      • Environmental Impacts
      • Job and Employment Impacts
      • Tax Impacts
    • Reporting
      • Step by Step Guides
      • Embeddable Maps
      • Reporting and Insights
  • Solutions
    • By Industry
      • Academic
      • Agriculture
      • Associations
      • Consulting
      • Corporations
      • Economic Development
      • Energy
      • Finance
      • Government
      • Healthcare
      • Manufacturing
      • Real Estate
      • Tourism
    • By Use Case
      • Advocacy
      • Climate Risk Modeling
      • Data Aggregation
      • Data Centers
      • Economic Footprint
      • Education & Research
      • Environmental (ESG)
      • Grants and Funding
      • Natural Disasters
      • Policy Change
      • Scope 1, 2, 3 Emissions
      • Site Selection
      • Supplier Diversity
      • Tariffs
      • Tax Strategy
      • University Libraries
  • Pricing
  • Resources
    • Resources
      • Blog
      • Case Studies
      • Webinars
      • White Papers
      • E-Books
      • Reports Using IMPLAN
      • IMPLAN Certified Economist Program
      • IMPLAN Press Resources
      • IMPLAN Training
  • About
    • About
      • Careers
      • Company
      • IMPLAN FAQ
      • History
      • Contact Us
  • Log In
  • Support
  • Book a Demo
Blog

Rising Tides: The Economic Impact of the Miami International Boat Show

IMPLAN Team
February 27, 2020
By IMPLAN Team
Home / Blog / Rising Tides: The Economic Impact of the Miami International Boat Show

Miami is expecting an economic impact of $854 million from a major event this February, but the source of that economic boom may surprise you. For the last 79 years, the Miami International Boat Show has welcomed boating enthusiasts from around the world for an annual exhibition of watersport technology, products, and recreation. According to a recent study, the economic impact felt in South Florida nearly doubles the contribution expected from the Super Bowl 54.

Boat Show Highlights

An article from Bill Yeagin, the President and CEO of Correct Craft, in the South Florida Sun Sentinel highlights the boat show’s massive annual impact. Figures were calculated in a study completed by Thomas J. Murray & Associates along with the University of Florida. The Miami International Boat Show fills more than 100,00 hotel rooms for the event. These visitors then spend $53 million in South Florida during their stay. The event analysis performed using IMPLAN demonstrated a $854.2 million statewide economic impact. The show supports 5,700 jobs and $289 million in labor income in the Sunshine State. Exhibitors sell $350 million worth of marine products at the show each year which contributes to Florida’s reputation as the top state for boating in the U.S. 
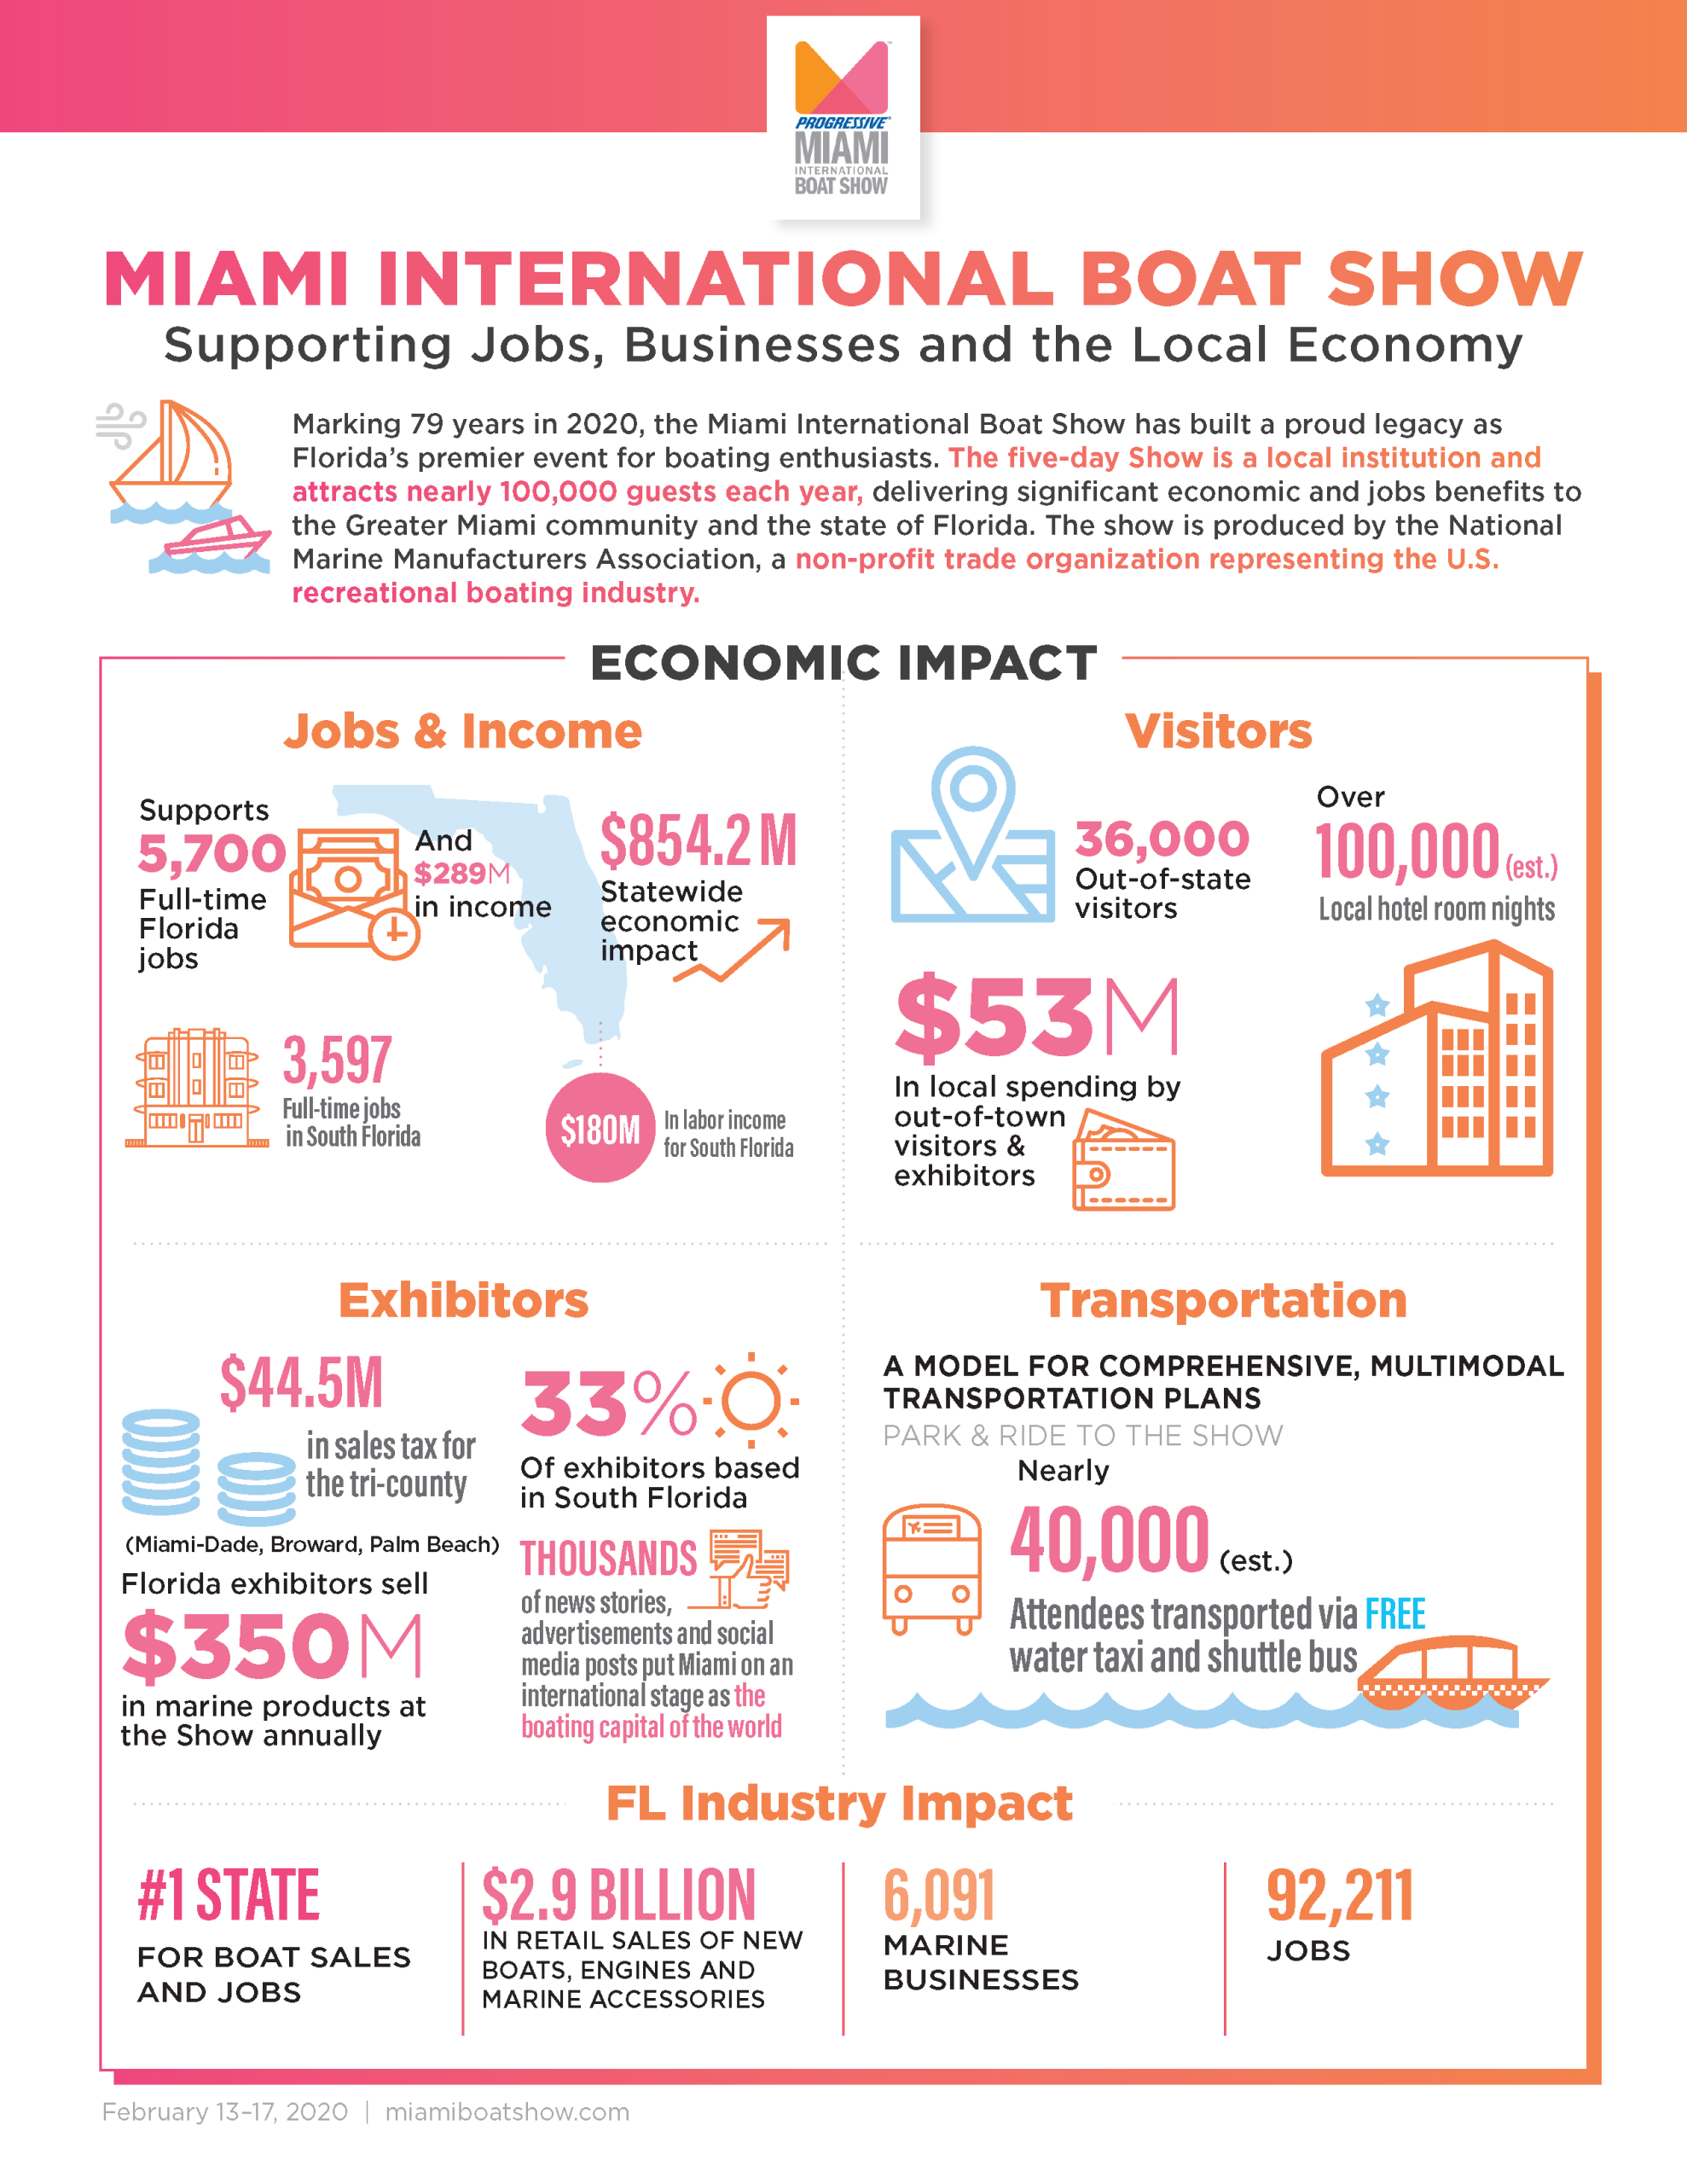
MIABoatShowgraphic

Boating’s nationwide Impact

According to U.S. Coast Guard statistics, Florida has the most registered boats in the country, so it comes as no surprise that the boating industry is an economic driver for the state. Nationwide, recreational boating activity contributes $170.3 billion to the U.S. economy. Florida’s economic contribution is $23.3 billion, making it far and away the largest boating industry in the U.S. In retail sales alone, the boating industry contributes $2.9 billion of direct impact each year.

Florida’s Boating Manufacturers

Florida is home to 26% of all boat manufacturers in the U.S. The Miami International Boat Show highlights the boat manufacturers’ notable economic presence within Florida, and a dive into IMPLAN data reveals just how important the boating industry is to the state’s economy. According to 2018 IMPLAN CEW data, 285 boat builders call the Sunshine State home and employ 9,556 people. Through their supply chain expenditures and employee household spending, these businesses support 21,844 total jobs (direct, indirect, and induced). A look at Congressional districts in the U.S. with the most boat manufacturing jobs reveals that 3 Florida districts are among the top 7 (FL-6, FL-9, and FL-10). These watercraft producers also support $134 million in state and local tax revenue annually.

Anchors Aweigh 

The Miami International Boat Show produces a $854 million economic impact and generates $53 million in visitor spending. Studies anticipated that the 100,000+ visitors for the Super Bowl would generate between a $400-500 million economic impact. While attention was focused on Miami for a week in February due to Super Bowl 54, the impact of the annual Miami International Boat Show nearly doubled that of “The Big Game.” The boat show impact coupled with the size of the maritime industry clearly demonstrates that boating is worth boatloads to the economy of Florida.

Why IMPLAN?

Put simply, IMPLAN is built for everyone.

Together, our software and data give you a window into your region of study — like one gigantic transaction log for the local economy. Chances are that if your project or business has a financial component, then IMPLAN can reveal some sometimes surprising detail about how your project relates to the local, state, or national economy.

What used to take economists weeks can be done in minutes. By anyone! But you're not alone, IMPLAN's best benefits go beyond the work done in the tool:

  • Instills confidence in your analyses
  • Easy to learn and use
  • Outstanding customer support
  • Access to orientations, trainings, and project consultations
Get a Demo
Want to
try it out?
Get a Demo
Ready to
dive in?
Request Pricing
Still have
questions?
Talk To An Expert
  • IMPLAN

    Economic input output modeling application, data, and solutions.

  • Contact

    8935 Northpointe Executive Park Drive
    Suite 125
    Huntersville, NC 28078

    (800) 507-9426

    support@implan.com

    Contact Us

    Media Inquiries

  • Reference

    Privacy Policy
    Website Terms of Service
    Citation Guidelines
    Security, Privacy and Compliance

  • Navigation

    Product
    Solutions
    Use Cases
    Resources
    Pricing
    Support
    Sign in
    Careers

    • YouTube
    • LinkedIn
  • IMPLAN © Copyright 2026