You Pay More at the Pump. But That’s Just the Beginning

Every summer, drivers brace for higher prices at the pump. This year, the sting is sharper than usual. But the number on the gas station sign only tells part of the story.
When fuel gets more expensive, the cost doesn’t stop with the people filling their tanks. It moves through freight, construction, real estate, manufacturing, and nearly every business that relies on transportation to get work done.
Using IMPLAN’s Forward Linkage Price Change model, we followed that ripple. Here’s what we found.
It Starts With a Tank of Gas…
Average U.S. gasoline prices reached $4.11 per gallon in July 2026, up from $3.15 a year ago. That’s a 30.5% increase, or roughly 96 cents more for every gallon purchased. Even after adjusting for inflation, real prices climbed 26.7%.
According to the U.S. Energy Information Administration (EIA), gasoline prices have remained elevated throughout the summer, putting added pressure on both households and businesses.
That’s the increase drivers notice every day.
But it’s only the first domino.
Where Does the Money Go Next?
Most economic impact models trace spending backward through the industries that produced a product or service. IMPLAN’s Forward Linkage Price Change model works the opposite way.
Instead of asking where something came from, it asks where higher costs go next.
Starting with a $196.5 billion price increase in Refined Petroleum Products, we held purchasing quantities constant to isolate the effect of higher prices alone. The model then followed those additional costs as they spread through every downstream industry that purchases fuel.
If you’re new to the methodology, learn more about how Forward Linkage Price Change Analysis works and how it differs from traditional economic impact analysis.
The result?
$133.7 billion in additional costs rippling across the U.S. economy.
For every $1.00 absorbed by the industries buying fuel directly, another $0.84 spreads farther through supply chains as businesses purchase goods and services from one another.
The Biggest Surprise Isn’t Transportation
Some industries are expected to feel the pressure first.
Transportation companies burn fuel every day, making them the obvious first stop for higher costs.
What may be more surprising is where the ripple goes after that.
Nearly half of all downstream costs land in industries many people wouldn’t immediately associate with gasoline prices.
The burden breaks down like this:
Direct costs: $72.8 billion (54.5%), concentrated in transportation, freight, and government operations.
Indirect costs: $60.9 billion (45.5%), spreading into construction, real estate, refining, municipal services, and countless suppliers that depend on affordable transportation to operate.
The Ripple Doesn’t Stop After Day One
Higher fuel costs don’t move through the economy all at once. They travel in waves.
The businesses buying gasoline first absorb the initial increase. Their suppliers then face higher operating costs. Those suppliers pass costs to the businesses they serve, and the process repeats throughout the economy.
Here’s how the ripple unfolds:
Round 1
First-tier buyers absorb $30.9 billion (59.4%)
Round 2
Secondary suppliers account for another $14.6 billion (28.1%)
Round 3
Third-tier suppliers take on the remaining $6.5 billion (12.6%)
Each wave becomes smaller than the one before it, but together they reveal how a single increase at the fuel pump quietly spreads through nearly every corner of the economy.
Who’s Paying for It?
Businesses can only absorb higher costs for so long. As fuel prices remain elevated, companies are forced to make difficult decisions. Some pass costs to customers through higher prices. Others accept smaller profit margins. Some delay investments or reduce spending elsewhere. Several industries already face significant pressure.
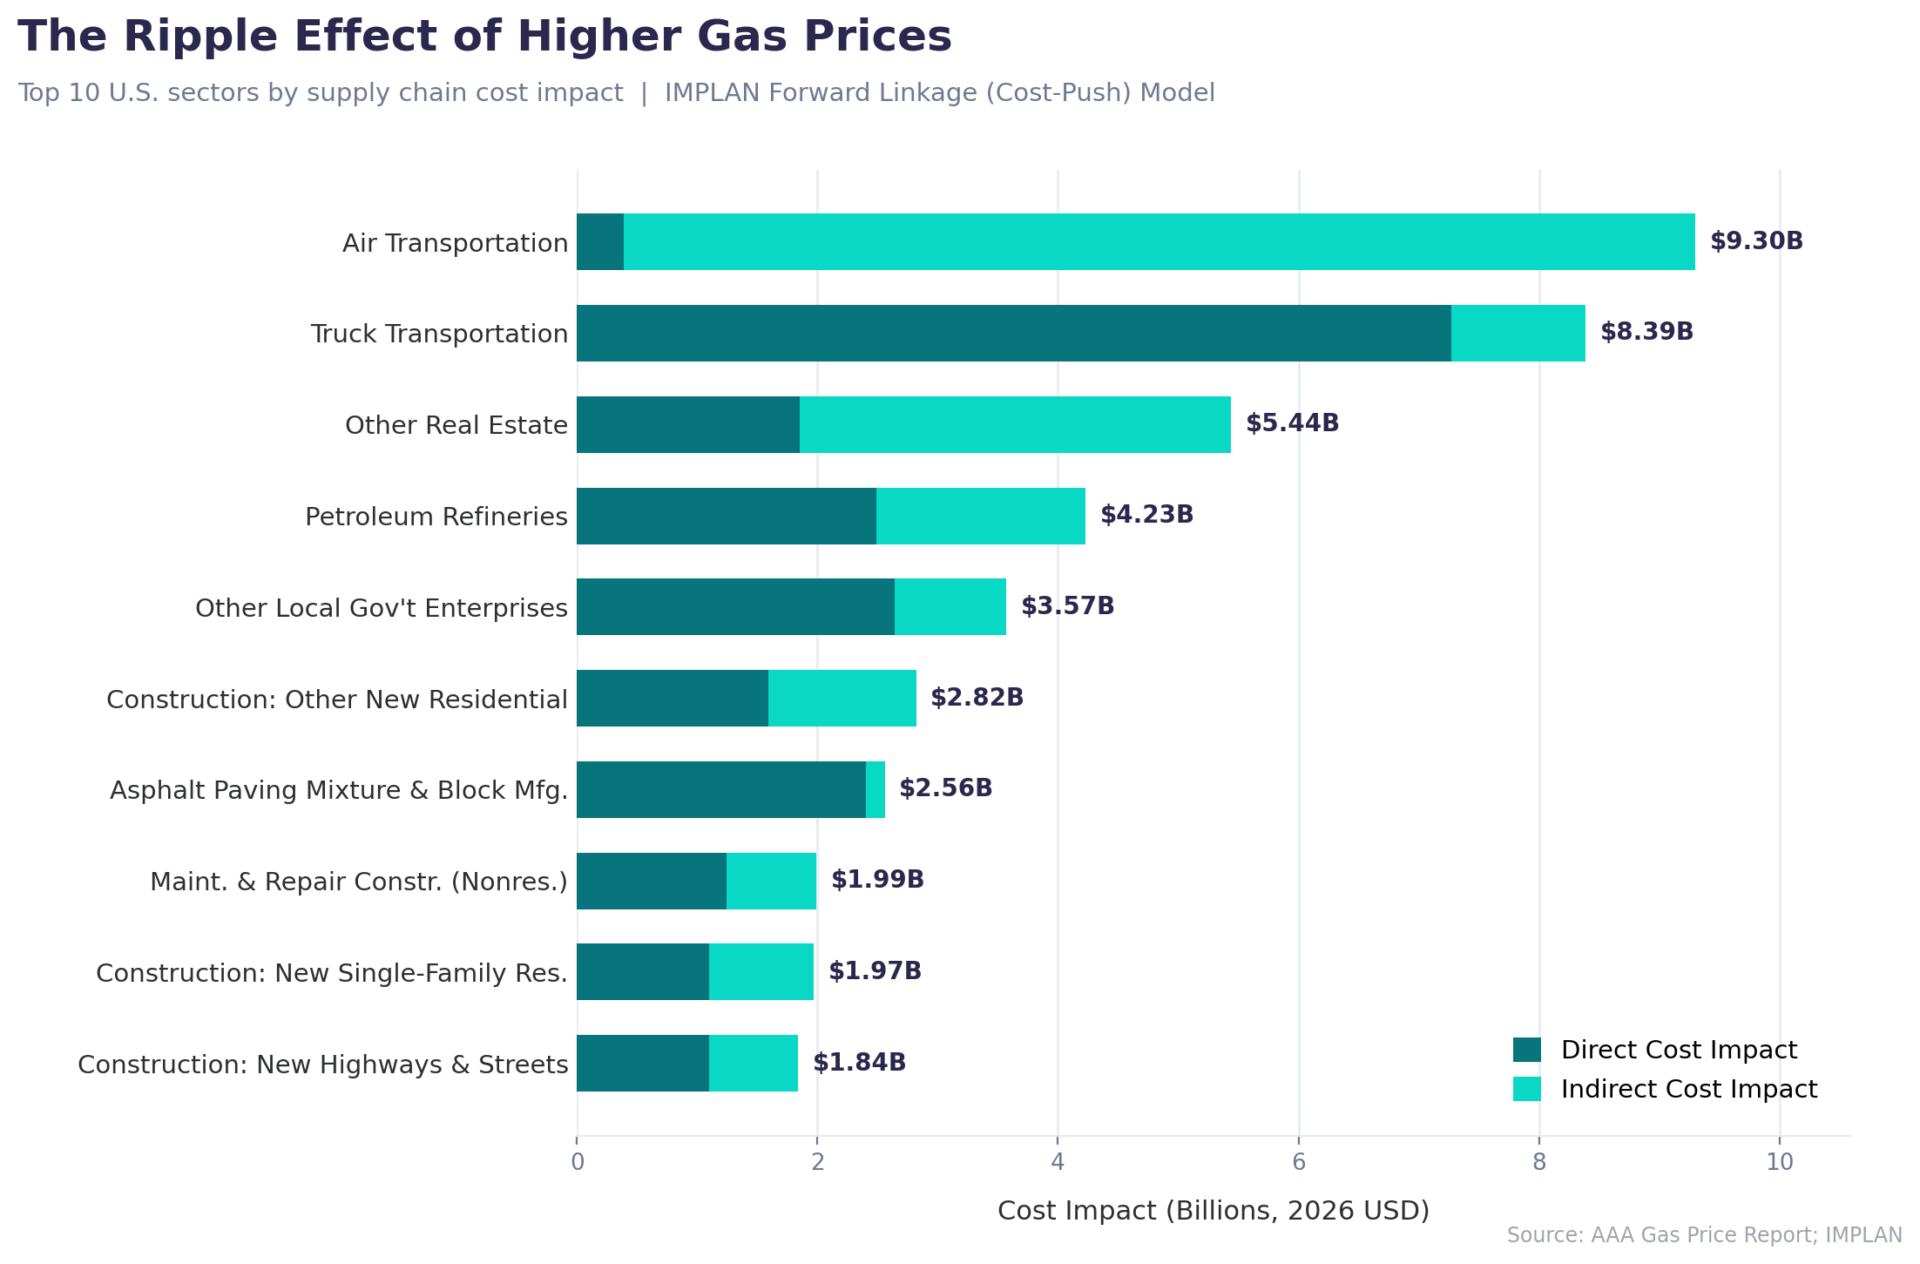
- Freight trucking: $8.4 billion in added costs
- Air transportation: $9.3 billion
- Construction: More than $20.9 billion combined
- Local government enterprises: $3.6 billion, affecting transit operations and infrastructure maintenance
These pressures often arrive long before consumers notice higher prices on store shelves.
One Price Increase, Thousands of Consequences
Most people experience rising gas prices one tank at a time. Businesses experience them everywhere.
With IMPLAN’s Economic Impact Software, analysts can measure how a single price increase cascades through industries, regions, and supply chains, providing a more complete picture of downstream economic effects.
Understanding where those costs travel and who ultimately absorbs them offers one of the clearest pictures of how inflation spreads through the economy.
Want to see how a price shock ripples through your own industry or region? IMPLAN’s Economic Impact Software maps the full chain of direct and indirect effects, helping you quantify impacts, communicate results, and make better-informed decisions.
Schedule a demo to see how IMPLAN can help you model the ripple effects of price changes with confidence.