
Taking IMPLAN’s Occupation Data and Expanded Demographic Data for a Spin

Did you know that information on regional education levels can be found in IMPLAN Cloud and Data Library? Both our occupation data (available now!) and expanded demographic data (coming soon!) offer insights into educational attainment in all geographies available in IMPLAN within the United States.
IMPLAN’s occupation data covers data points such as wages, hours worked, and core competencies (knowledge, skills, abilities, education, work experience, and on-the-job training levels) for each occupation in each industry. This data pairs with employment impact results to provide occupation detail (with associated wage, education, and skills) for any impact that is run. The data is also applied to the IMPLAN study area data, which grant insights into a Region’s existing skill force, the skill requirements of various industries, and more. When it comes to education, this means that an industry-based estimate of education levels in each geography can be ascertained.
The next data release to be added to IMPLAN’s portfolio of annual data, expanded demographic data, will also include information on educational attainment. This comes in two age categories: those 18 and up, and those 25 and up. Rather than being industry-based, this data offering comes directly from the American Community Survey. This means that occupation data based estimates will factor in those who commute in from another geography for their employment, whereas the expanded demographic data will be based solely on residents of a region.
There is a lot to be learned from occupation data and expanded demographic data, but knowing where to begin and how to make the most of any data set is always a challenge. That’s why today’s blog will walk you through some examples of these two data sets in action. We’ll take the data for a spin to determine the least and most educated counties in the United States.
Finding the Top Ten Most Educated Counties in the US – Expanded Demographic Data
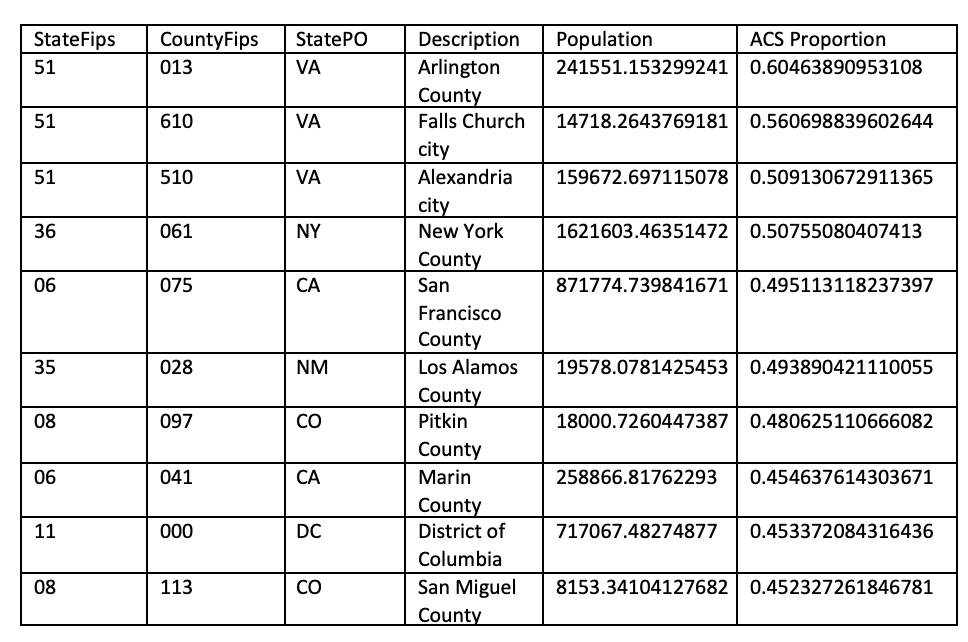
These findings come from the upcoming demographic expansion data, which relies on American Community Survey (ACS) table S1501. They represent the top 10 counties in the United States in terms of percentage of individuals that hold a higher education degree. The rightmost column should be interpreted as a percentage (i.e., 0.25 = 25%).
Bachelor’s Degrees and Up (Combined Bachelor’s + Graduate Degrees) by Percentage of Population:
Occupation-Based Education Findings for Those Same Ten Counties
Investigating the same ten counties via IMPLAN’s Occupational Education Estimates yields results that we can use to compare across these two data sources/products that we offer. As opposed to the data above, which comes directly from the ACS, IMPLAN’s Occupational suite of data uses an occupation-based approach for creating educational attainment estimates.
Essentially, the estimate of educational attainment is based on the industries that are present in the region. It works like so: Each industry has a set ratio that splits total employment into all types of occupations. From there, each occupation has a set ratio that splits educational attainment out by the different types of education categories. For example, our data can tell you something like 10% of CEO’s have a Doctoral Degree, 20% have a Bachelor’s degree, etc.
Because we know the amount of employment in each county by industry, we can determine the number of people working every type of job. That means that we can generate an estimate of all types of degree holders. Dividing our estimates by the total number of people in a county yields a percentage of degree holders by category.
Let’s compare those percentages now for each county:

Interestingly, the occupation data seems to have a lower estimate for the proportion of higher education degree holders in most of these geographies! Part of this is definitely because the ACS data accounts for ALL people living in a region, where the occupation data only provides estimates for those who are employed in the region. There are certainly going to be cases where people hold degrees but are not a part of the workforce, or are part of the workforce in a different county so we would expect the occupation estimates to be a bit lower.
Los Alamos County is different, though. Estimates from the occupational data are higher than the ACS suggests. This could mean that some of the more highly educated workers in Los Alamos County commute in from other counties (or work remotely). It would certainly be interesting for folks who are interested in that geography to explore. Another question that this might pose is whether some areas are “over-educated” –i.e., are there more degree holders than there are jobs that really require these degrees?
The Top Ten Least Educated Counties in the US
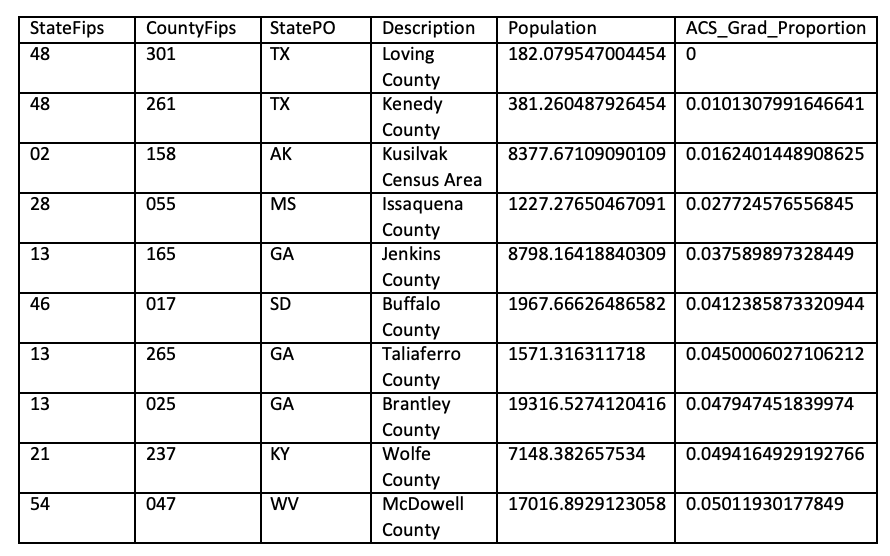
Now, let’s explore going the other direction. Here are the top 10 counties with the smallest proportion of higher education degrees (Bachelor’s and up) held according to the expanded demographic data:
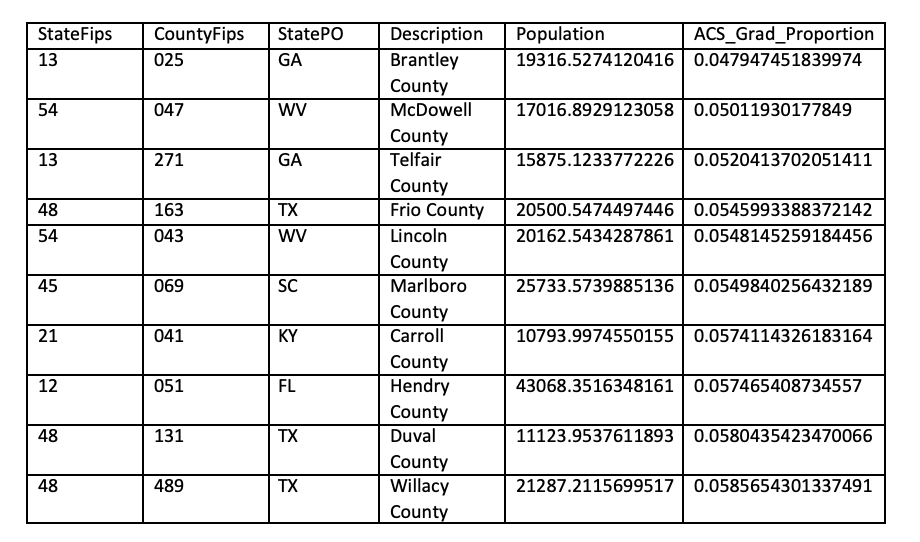
Here are the top 10 counties with the smallest proportion of higher education degrees (Bachelor’s and up) held with an additional constraint of requiring the county population to be > 10,000:
Similarly, we can determine occupation data-based estimates for held degrees. In this case, we would once again expect the occupation estimates to be a bit lower, again because there are individuals that hold degrees that are not in the workforce.
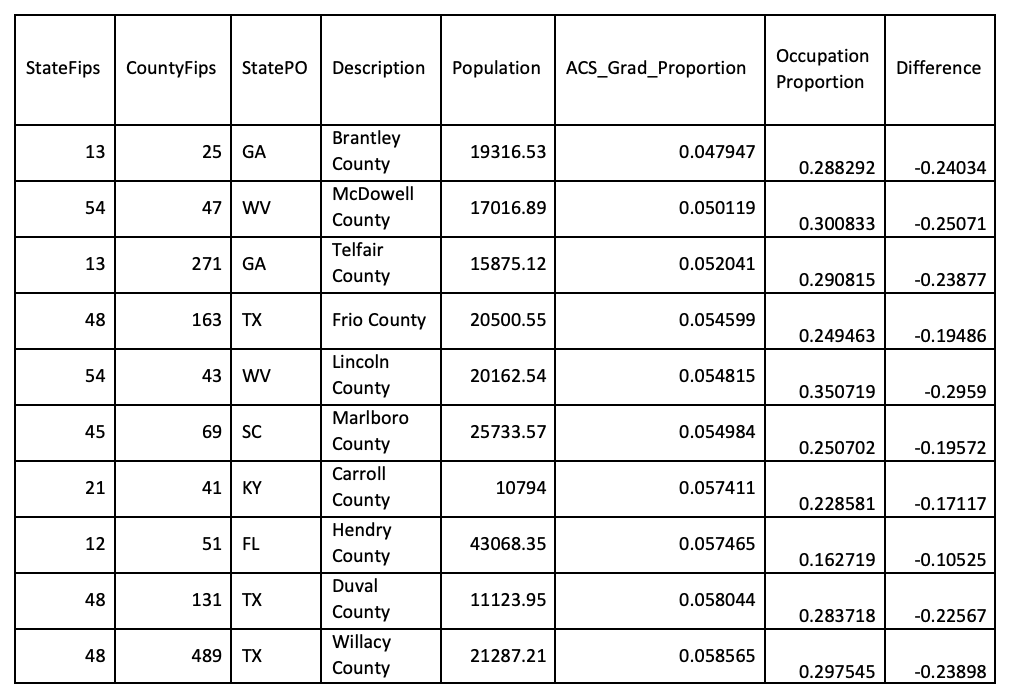
Interestingly, the occupation data seems to indicate higher estimates of education in all cases! Does this mean that these geographies are hiring under-qualified people – or could there be another explanation? Diving into the data can open pathways for new inquiries such as this and provide researchers with insights that lead them to ask the right questions and make new discoveries.
Ready to try it for yourself?
Occupation data is already available for IMPLAN users. You can find it in IMPLAN Cloud and Data Library. If you’re interested in learning more, don’t miss our Occupation Data Use Cases and Occupation Data Details support articles. Expanded demographic data will be added in app soon.
Not using IMPLAN yet? Schedule a demo to learn how you can use IMPLAN’s extensive economic database and cutting edge modeling application to drive better outcomes for your organization and the world.