Editing Institutional Spending Pattern Events
INTRODUCTION:
The Institutional Spending Pattern Event Type represents a general spending distribution for measuring broad Institutional activity in your region. These include general spending for:
- Federal Government
- NonDefense
- Defense
- Investment
- State/Local Government
- NonEducation
- Education
- Investment
- Capital
- Inventory Additions/Deletions
Note that the Specifications for Capital and Inventory Additions/Deletions relate to all Industries, not only government and should rarely be used.
INSTITUTIONAL SPENDING PATTERN:
These general spending patterns are unique in that they describe both Intermediate Expenditures and Value Added within the same Spending Pattern. This results in these Spending Patterns producing ‘mixed results’; where the reported Direct Effects describe both what we would generally consider Direct Effects (income, Employment and Value Added) and the first-round Indirect Effects that arise from the government spending its budget. This mixing of the results requires some additional work on the part of the analyst to parse the results, or requires the analyst to divide the Spending Pattern into the traditional Spending Pattern prototype that includes only Intermediate Expenditures, and then create a separate Activity to account for the labor/payroll component using Analysis-by-Parts (ABP).
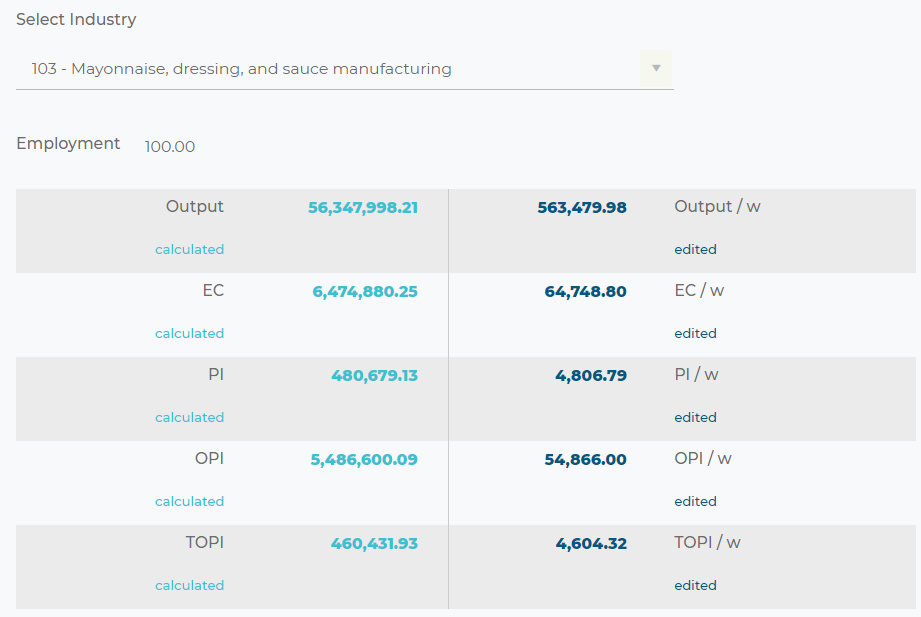
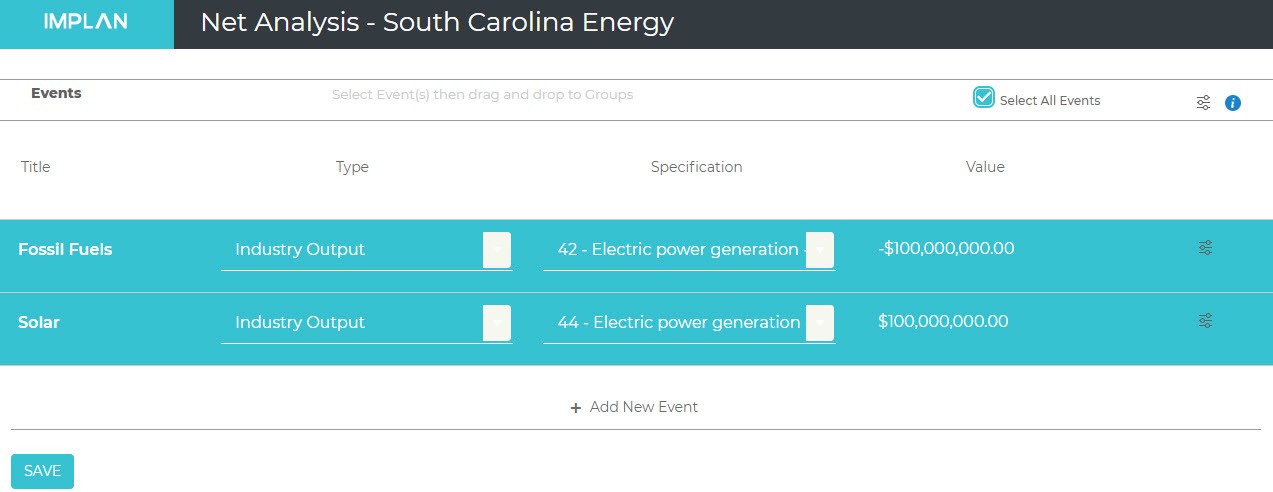
As an example, let’s say we want to use the Institutional Spending Pattern to model a public university. This would fall under State/Local Government Education.

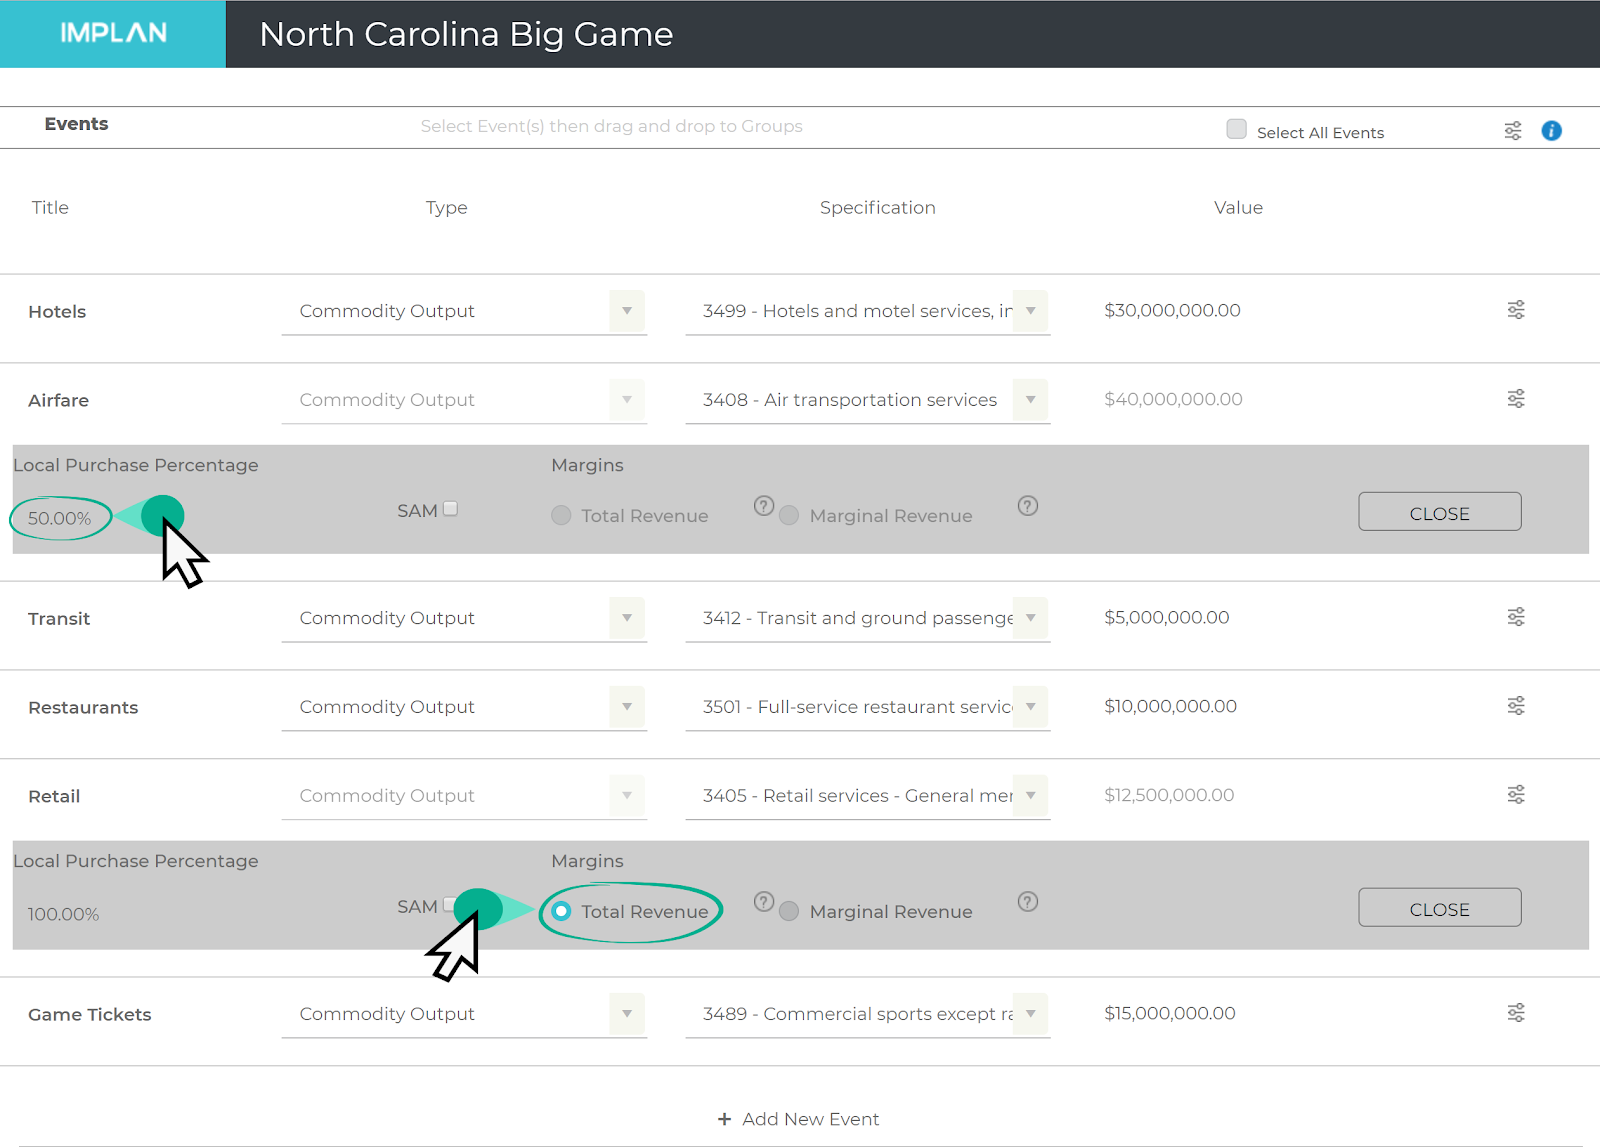
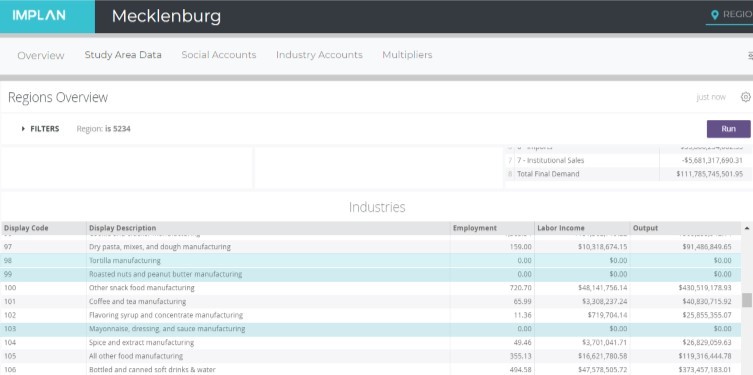
The Advanced Menu shows all of the Commodities and the LPP is set to SAM. This will model the university’s purchases of local commodities based on the rate in which each commodity is purchased locally in the Data Year.
Note also that the Sum of Event Values is 100%. This means that every dollar Value entered will be spent across the Spending Pattern.
At the bottom of the Events list, note the two Sectors designed with an * and the wording ‘Employment and payroll’. These Sectors are special Sectors that have no associated spending pattern and are used to calculate the Employment value and Value Added associated to government activity.

At this point in the analysis, we have two options for proceeding.
Option 1
We can use the full value of our university annual operations in the Value field and run the impact. No further edits are made as all of the spending of the institution is captured in the spending pattern.
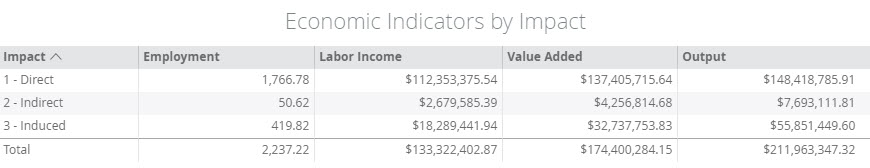
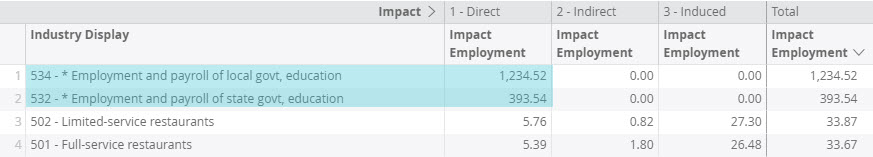
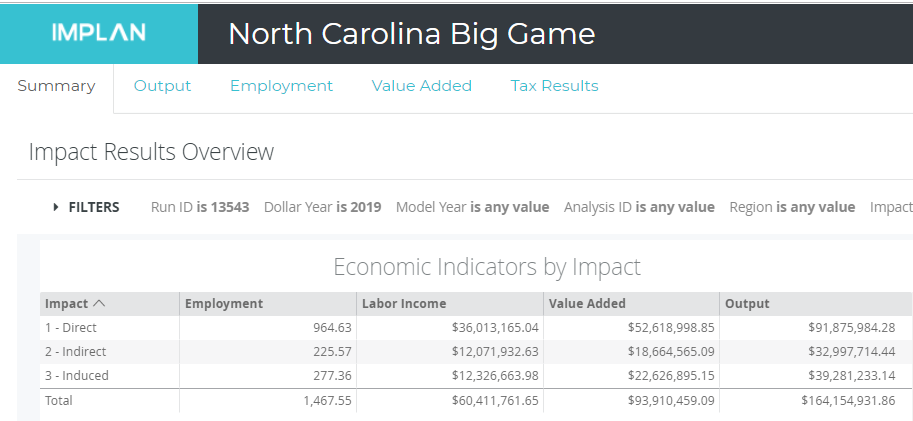
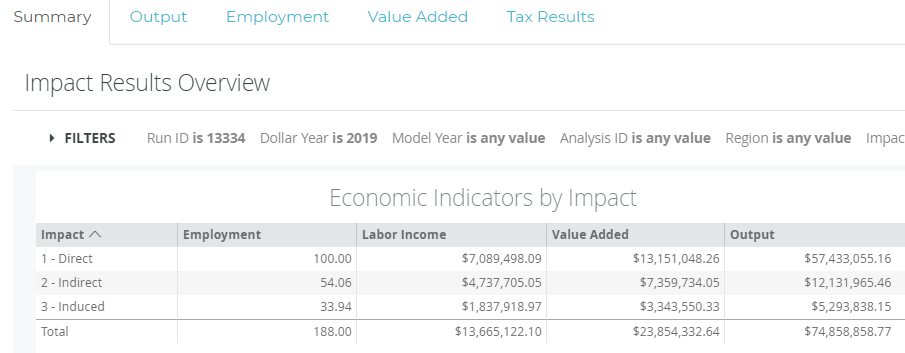
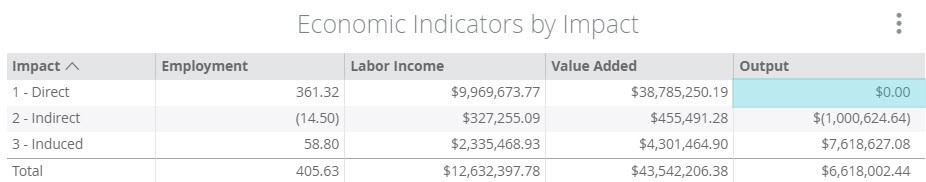
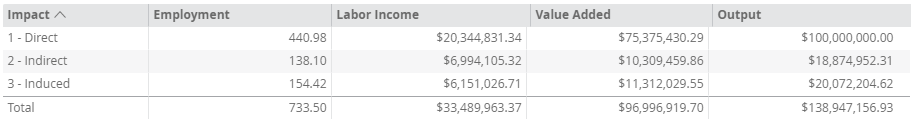
It is important to remember that the reported Direct Effects are a mixture of the effects of the university itself and the first-round of Intermediate Expenditures in the region. This also explains why the reported Indirect Effects appear to be so low, and why the Employment, Labor Income, and Output reported for the Direct Effects do not match the numbers we put in on the impacts screen.
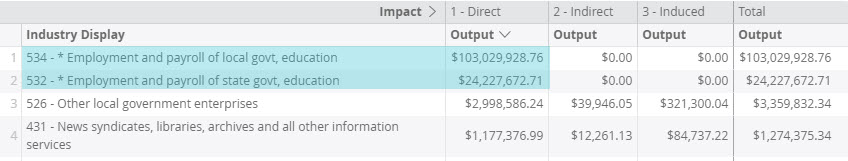
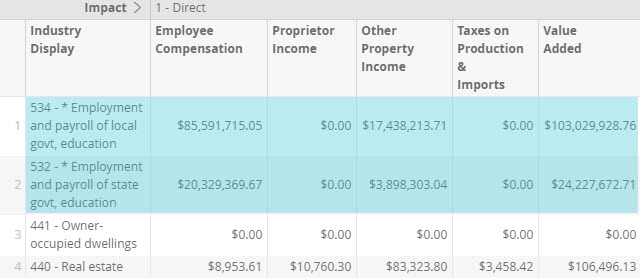
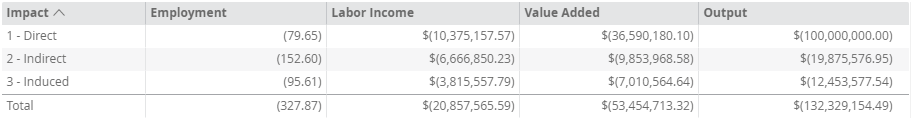
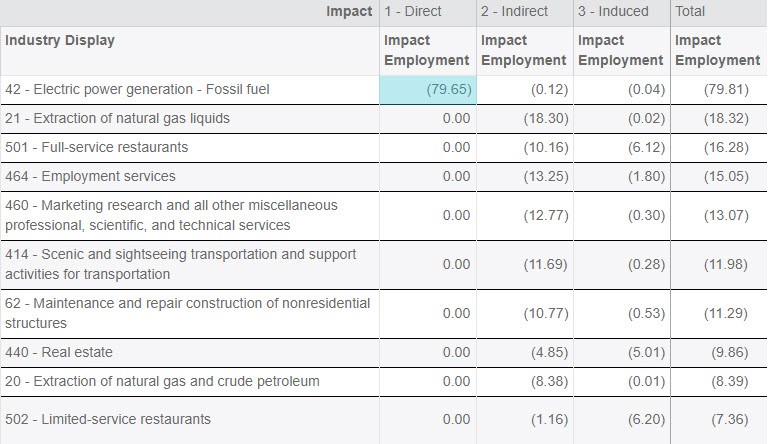
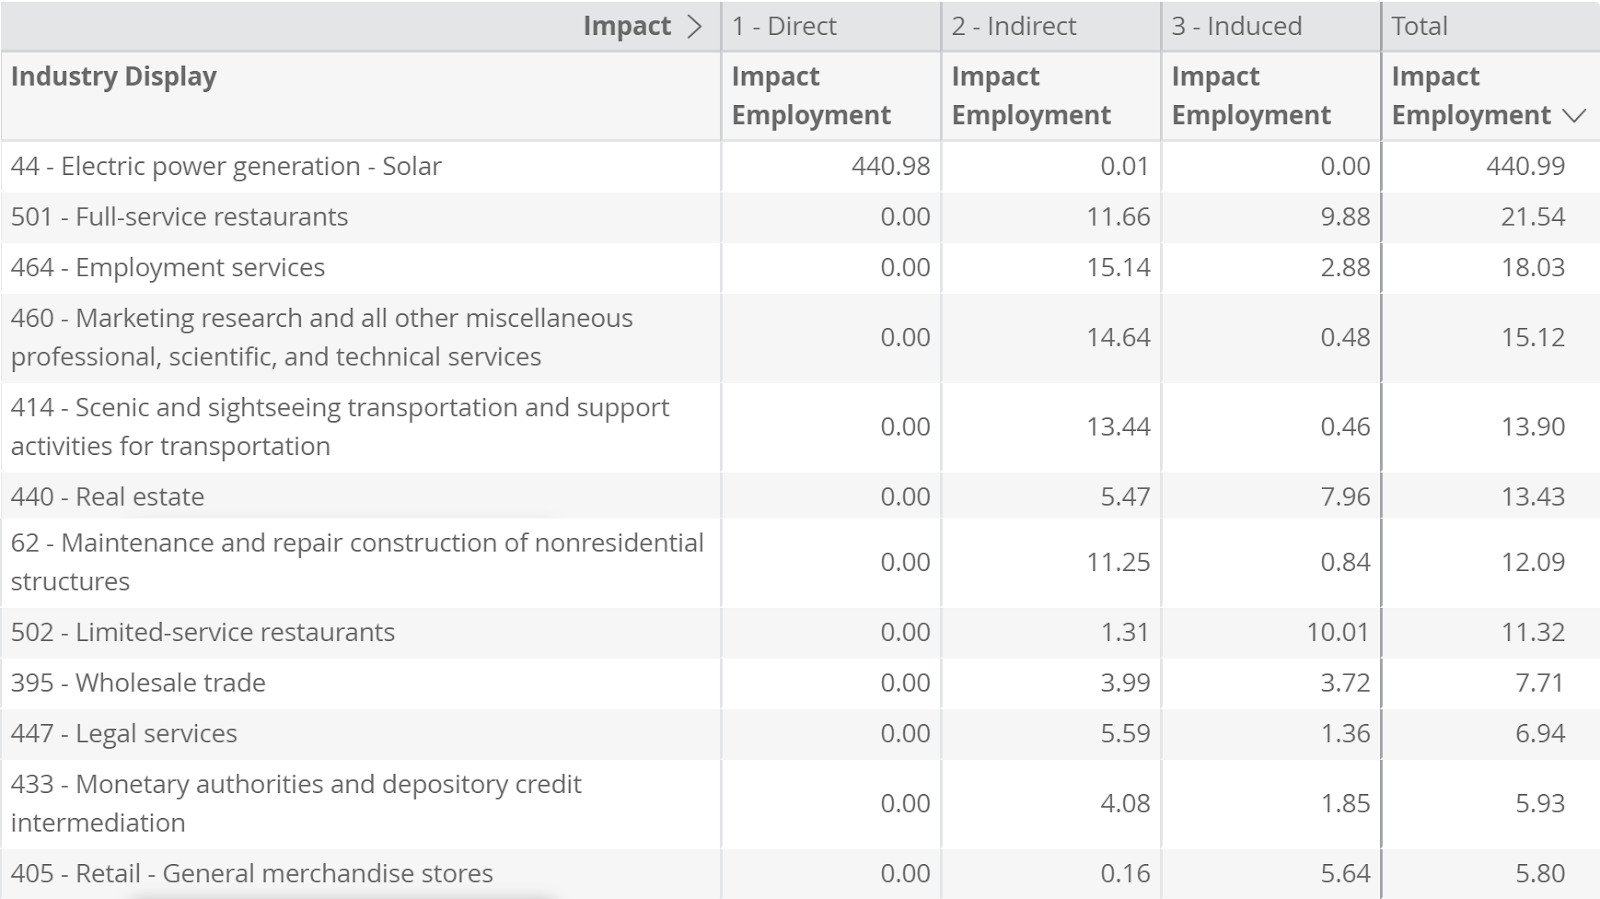
Now we pull out the Direct Effect of Sectors 532 and 534 (Employment and payroll) from our Output, Employment, Value Added tabs.
Output
Employment
Value Added
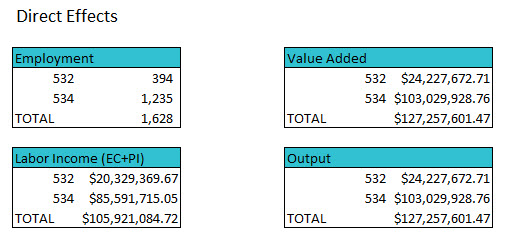
We can copy the Direct Effects for Sectors 532 and 534 into Excel and total them. The template here will help you to follow along with the calculations. This gives us our true Direct Employment, Labor Income, and Value Added.
Next, update the results by subtracting the calculated Direct Effect from the original Direct Effect.
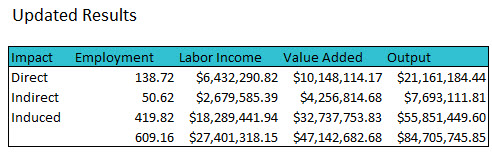
Finally, add the Direct Effect + Indirect Effect from the updated results together to create your Indirect Effect. Then Add back your calculated Direct Effect and sum the table.
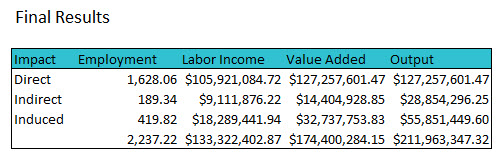
Note that when we do this, Value Added = Output. This occurs because these special ‘payroll only’ Sectors do not include any Intermediate Expenditures. We can now adjust the reported Direct Effects by removing these figures from the results and then reformatting the results by summing the Direct and Indirect lines together and moving this total to the Indirect line. Next, we insert our Direct Value in the Direct line.
After all that work, note that the total from our original impact match the totals from our final results. The difference lies in what is included in the Direct and Indirect Effects.
Option 2
The second option involves zeroing out the two payroll Sectors from the spending pattern before running the analysis. In the Advanced menu on the Impacts screen, click the trash to delete both 3532 and 3534 (Employment and payroll).
After the payroll Sectors have been removed the spending pattern Sum of Event Values is only 15.16%. This indicates that by default the Intermediate Expenditures associated to State & Local Government Education activity make up only 15.16% of their total production value.
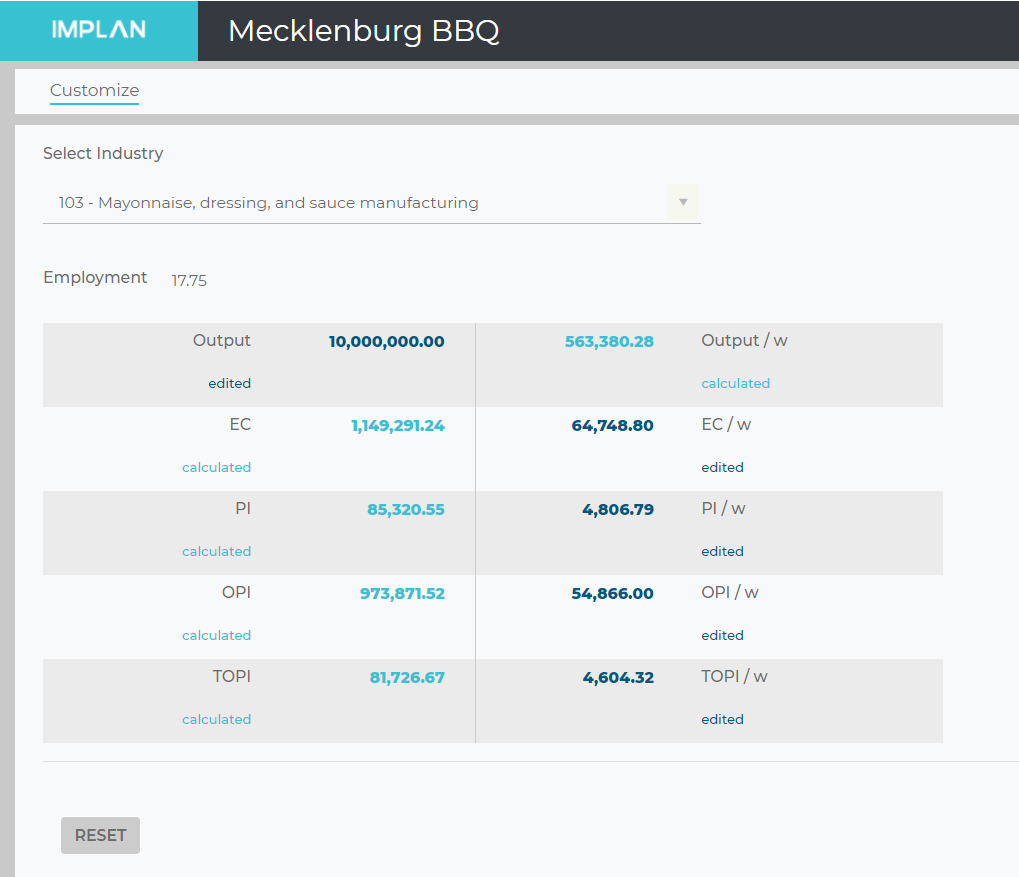
One advantage of removing the payroll Sectors is that we can easily, and predictably, change the assumption of the amount of spending that goes towards the purchase of goods and services for university operations to our known value. If we only have total operational value, and don’t have a budget and payroll value, we can certainly use this percentage to approximate the split between Intermediate Expenditures and Value Added and use known figures as our Value. However, if we know the goods and services budget, we can normalize the Spending Pattern so that we can use the budgetary figure as our Value.
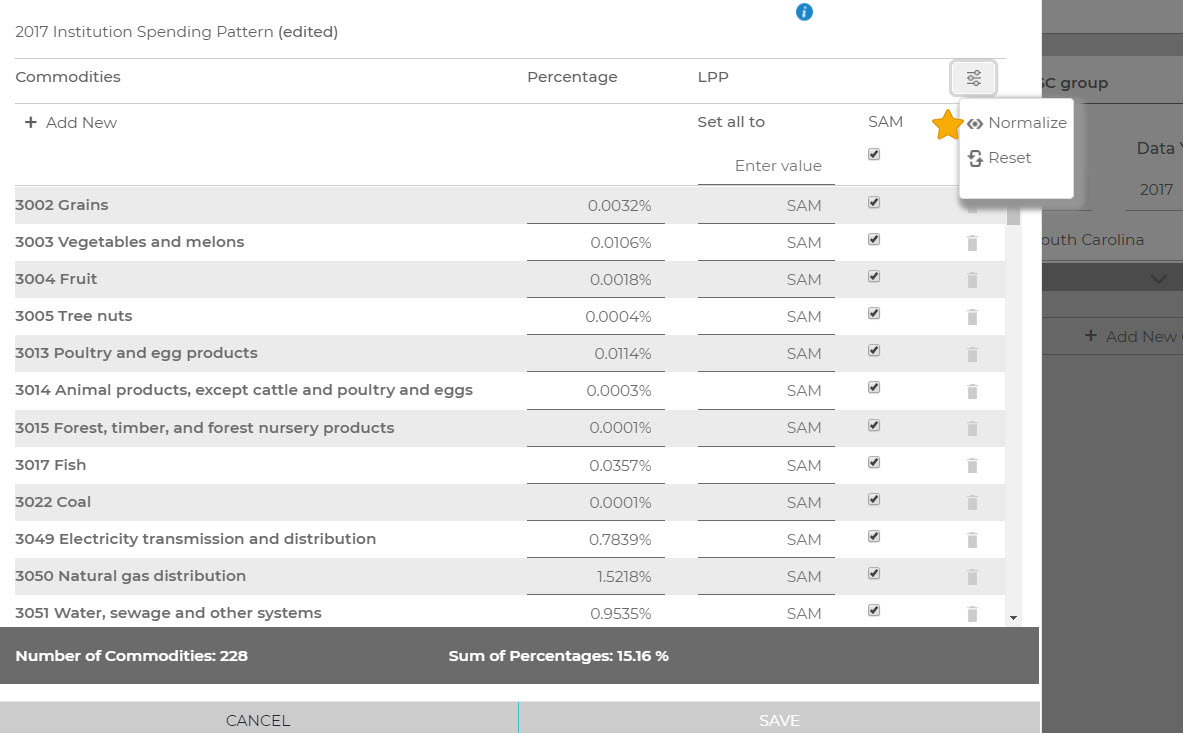
Note that after we click Normalize, the Sum of Event Values is 100% again, thus indicating that every dollar in the Event Value will be spent on the spending pattern. We can now set the Value to the cost of goods and services for the university.

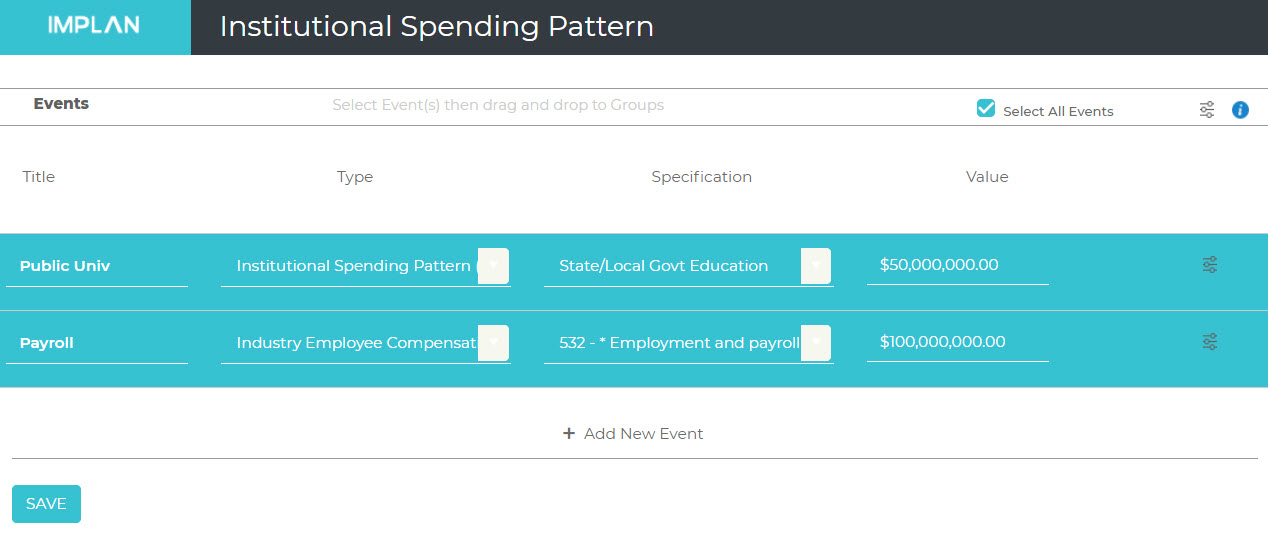
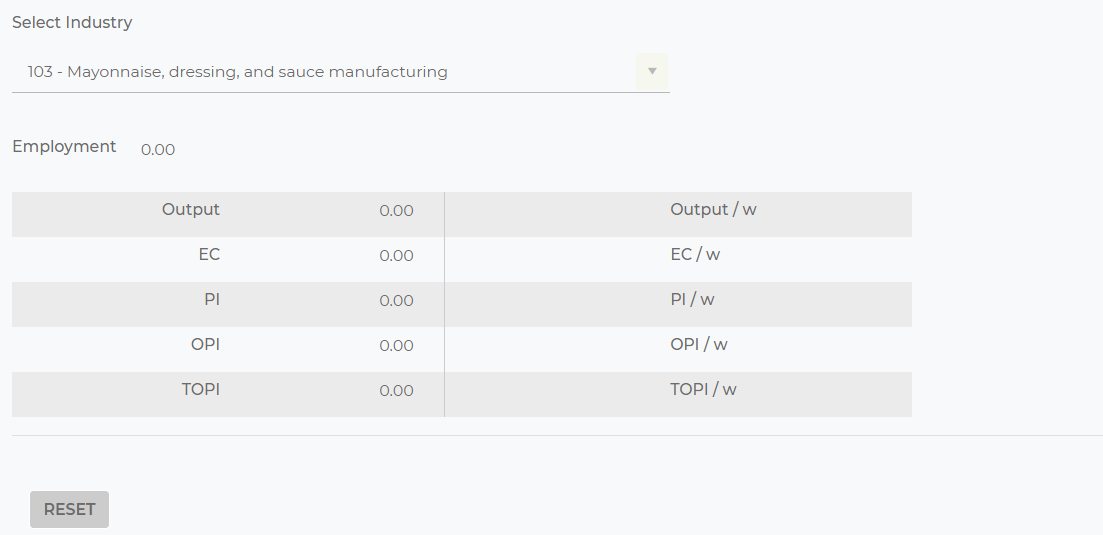
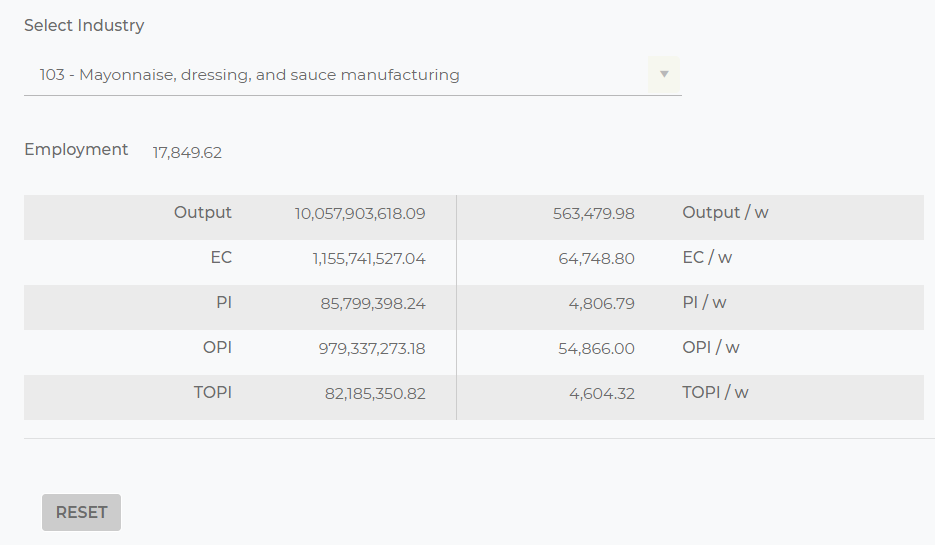
Now that the goods and services have been accounted for, we need to see the impacts of their payroll effects. We can do this by creating another Event for the payroll using Industry Employee Compensation and Sector 532 – Employment and payroll of state government education. If we know the employment, we can add it to this Event under the Advanced menu.
We use the Industry Employee Compensation Event type (instead of a Labor Income Event) because it captures or estimates the additional Value Added element of the capital consumption. A Labor Income Change could also be used with the payroll value and an Employee Compensation Event, but you would need to solve for Value Added separately, which can be cumbersome.
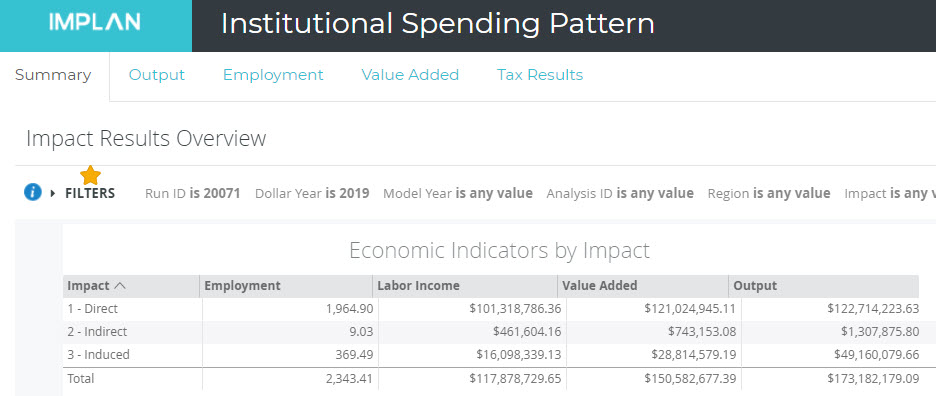
Two Scenarios are used because this avoids having the ‘mixed’ set of results we saw in Option 1 above. From these two Scenarios we now get two sets of results. The first is the spending pattern results which describe the effects of our budgetary expenditures on the local economy. Again these results do not include our Direct Employment, Labor Income, Value Added or Output, but do reflect the Employment, Labor Income, Value Added and Output associated to the first-round of Intermediate Expenditures of the university in the local economy in the listed Direct Effects. The second is the impact of the payroll and employment which show the impact of staff spending their income in the local economy. Our Results screen will default to showing both combined. If you want to look at the Results of only one of the impacts, click on Filters and choose the Event Name you wish to see. Filtering by the Institutional Spending Pattern will show the Direct Effects that should all be added to the existing Indirect Effect to produce the true Indirect Effect. From there you can simply add the results of the Industry Employee Compensation Event to the edited Institutional Spending Pattern results. All that is left is to populate the Direct Output with the combination of the 2 Event Values run in each Event.
If you know all of the Direct Effects of your institution, we recommend using Option 2. By removing the payroll Sectors and normalizing the Spending Pattern you have complete control over the ratios and how your values are applied.
Note that the two Scenarios will not produce the same results if you use a different ratio of Intermediate Expenditures to Output in Option 2.
ADDITIONAL CONSIDERATIONS:
To include only state or local employees, you can use either method. If you want to use the Option 1 which leaves the payroll Sectors in the Spending Pattern, you can sum the two coefficients for payroll Sectors together and use the new coefficient with the relevant Sector. Alternatively, you can use the Option 2 as described; removing the payroll Sectors from the spending pattern and then creating your new Event with the Sector that is appropriate for your known Employee Compensation.
Value Added is greater than Employee Compensation, which might not make sense for a public institution. While the majority of Value Added is Employee Compensation, there is a small additional value that these Sectors account for that describes the Institution’s capital consumption allowance.
EXAMPLES:
Editing Industry Spending Pattern Events
ABP: Analysis-by-Parts Using an Industry Spending Pattern Event with Labor Income Event(s)
College: Modeling Public College & University Impacts
Hospitals: Modeling Private Hospital Impacts with Analysis-by-Parts


 Student Spending
 Tourist Spending
 Business Spending
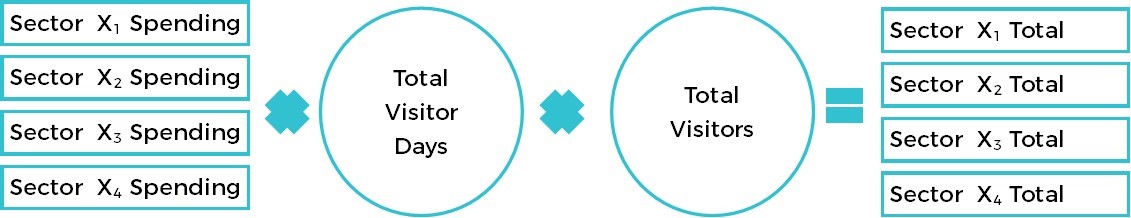


 Featured image: The RESULTS Screen
 Fig. 1
 Fig. 2
 Fig. 2.a
 Fig. 3
 Fig. 3.a
 Fig. 4
 Fig. 5
 Fig. 5.a
 Fig. 5.b