What can an LQ do for you?

INTRODUCTION

Location Quotients (LQ) compare the relative concentration in a specific area to the concentration in the U.S. They are mainly used for descriptive and comparative purposes for analyzing Industrial or Employment concentration. The technique compares one economy to a larger, reference economy. LQs identify specializations or weaknesses in the reference economy.


DETAILS

There are three things to identify first: a specific Industry or Occupation to examine, the regional economy, and the reference (or comparison), larger economy. This larger economy is often the U.S., but it can also be a group of states, state, or really anything larger than the economy of study.

The value for LQs will hover around 1. An LQ equal to 1 signifies that the local share is equal to the national share; basically the region of study is identical to the reference economy. An LQ of less than 1 means that the local share is less than the national share. This means that the Industry or Occupation’s share of local employment is smaller than its share of the nation; which can highlight a weakness in the local economy. An LQ of greater than 1 (or sometimes 1.2 as a more conservative number) means the local share is greater than the national share and is typically an exporter or perhaps has a specialization in that Industry or Occupation. These Industries employ a greater share of the local workforce than the reference economy or produces more goods and services than can be consumed locally (and are then exported). An LQ over 1.2 shows a regional specialization. So in summary, if the LQ > 1 it is an export, if it is less than 1 it’s an import (Bogart, 1998).


CAUTIONS

Note that using LQs is not advisable for small regions. This is because the smaller the region, the less likely it is to be economically diverse. Also, places that have a small overall employment but a few very specialized businesses will return very high LQs. Therefore, check these high LQs against the total employment in your region (Grodach & Ehrenfeucht, 2016). 

When Industries or Regions are aggregated, there will be loss of detail that may show less of a concentration (Bogart, 1998). Therefore, we recommend using the unaggregated IMPLAN Industries.

Finally, just because your Region has a small LQ does not necessarily indicate that there is a case for import substitution by building up this Industry. For example, the LQ for tree nut farming in North Carolina is 0.01. This is mostly due to the climate required to grow things like almonds, pecans, and walnuts, which isn’t in North Carolina.


FINDING THEM IN IMPLAN

The LQs reported in IMPLAN will always use the U.S. as the reference economy. Data on LQs can be found in Region Details.

Behind the i

     > Occupational Data

          > Area Occupation Summary

In the Location Quotient column, you will see a value that compares your region, in this example North Carolina, to the U.S. This shows the wage and salary employment based location quotient for the occupation. Clicking on the column title, you can sort the columns to show the largest and smallest LQs. In North Carolina in 2018, the largest LQ was in the Occupation 51-6063 Textile Knitting and Weaving Machine Setters, Operators, and Tenders at 6.91. In fact, the top eight Occupations are all in the Broad (4-Digit) category (51-60XX).

LQ_-_NC_Area_Occupation_Summary.jpg

You will also find LQs in Core Competencies.

Behind the i

     > Occupational Data

          > Core Competencies

               > Area Summary

In the three tables for Ability, Knowledge, and Skills, you will find the competency based LQ as compared to the U.S. as a whole.

LQ_-_NC_Area_Summary_KSA.jpg

 
In the three tables for Education Required, Work Experience Required, and On-the-Job Training, you will find the Wage and Salary Employee count based location quotient as compared to the U.S. as a whole.

LQ_-_NC_Area_Summary_EWO.jpg


CALCULATING THEM ON YOUR OWN

If you are looking for LQs for Employment, Labor Income, or Output, they are very easy to calculate using IMPLAN data. Select your Region and head Behind the i. On the Regions Overview screen the table at the bottom will list IMPLAN Industries with their associated Employment, Labor Income, and Output. You can download the table by clicking on the ellipses as shown. This will open up an Excel spreadsheet with the values.

LQ_-NC_Industries.jpg

You can use the LQ Template to calculate the Employment LQ for your Region against the U.S. Copy the Employment for all IMPLAN Industries from your downloaded file and paste them into Column E – Your Region’s Employment. The spreadsheet will automatically calculate the LQ in column G.

If you want to examine either Labor Income or Output, simply replace the national figures in Column C with the values for Labor Income or Output for the U.S. Then paste the Labor Income or Output value for your Region in Column E. 

You can also compare your Region to something other than the nation. For example, we could look at the Charlotte–Concord–Gastonia Metropolitan Statistical Area compared to the state of North Carolina. In this case, simply replace Column C with the North Carolina values and Column E with the MSA values.

LQ Template 


THE MATH

The formula is LQ =
     Local Concentration / National (or reference Region) Concentration

More specifically the formula for the Employment LQ is:

     LQ ir = (xir/xr) / (xin/xn)

     where

          xir = employment of sector i in region r

          xr  = total employment in region r

          xin = employment of sector i in the reference region

          xn  = employment in the reference region


GOVERNMENT RESOURCES

BEA: What are location quotients (LQs)?

QCEW Location Quotient Details


REFERENCES

Bogart, W.T. (1998). The Economics of Cities and Suburbs. Upper Saddle River, NJ: Prentice Hall.

Grodach, C. & Ehrenfeucht, R. (2016). Urban Revitalization: Remaking Cities in a Changing World. New York: Routledge.


RELATED ARTICLES

Occupation Data

Categorizing Effects: Adding Back the Direct & Including Institutional Spending

INTRODUCTION

There are three possible types of Effects included in the Results of each analysis performed in IMPLAN: Direct, Indirect, and Induced. Direct Effects are the initial Final Demand Effect. Indirect Effects are generated due to demands from the regional supply chain to produce the final goods & services in the analysis, while Induced Effects are generated due to demands from households whose income is earned directly or indirectly due to their job activity in production being analyzed.


EFFECTS BY EVENT TYPE

Events that are designed to analyze Final Demand including Industry Events (Output, Employment, Employee Compensation and Proprietor Income), Industry Contribution Events, Commodity Output Events, and Institutional Spending Pattern Events. These will each have a Direct, Indirect, and Induced Effect. As shown in the table below this is not the case with all Event Types.


Direct, Indirect, & Induced

Indirect & Induced Only

Induced Only

Industry Events

Industry Spending Pattern Events

Labor Income Events

Industry Contribution Events


Household Income Events

Commodity Output Events


Institutional Spending Pattern Events


Industry Spending Pattern Events are designed to analyze effects due to the regional supply chain of the specified Industry. Industry Spending Patterns are made up of the Intermediate Inputs for the Industry and produce only Indirect and Induced Effects. Labor Income and Household Income Events are only designed to capture effects due to income earned in the analysis, producing Induced Effects only. Because Industry Spending Patterns Events and the two Income Events do not specify the exogenous change in Final Demand, these Event Types will not have a Direct Effect.

These categorization of Effects by Event Type are by design in IMPLAN and cannot be adjusted internally in the IMPLAN application. That being said, there are cases where it is appropriate to add in the “missing” Direct Effect or recategorizing Effects in the Results produced in IMPLAN.


DOWNLOAD RESULTS IN EXCEL

If manipulation of your Results is appropriate, start by downloading the results in the Results screen for whichever table you’d like to report. According to the following scenarios, adjust your Results accordingly. Remember to make the corresponding changes made in the Summary Results to any other Results tables you’ll be reporting.

Categorizing_Effects_-_Download.jpg

Categorizing_Effects_-_Download_2.jpg


RECATEGORIZING EFFECTS

ANALYSIS-BY-PARTS: INDUSTRY SPENDING PATTERN

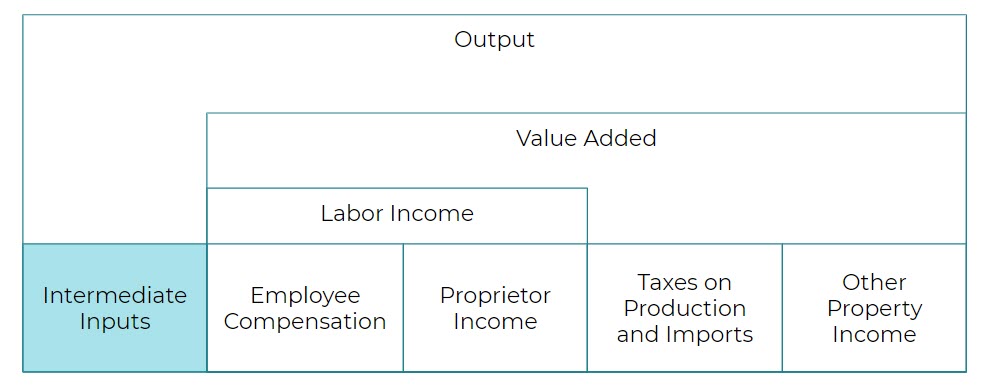
Analyzing an Industry using Analysis-by-Parts is a workaround for the customization limitations in a single Industry Event. For this reason, the Results are not as straightforward as the Results produced in an Industry Event. When using an Industry Spending Pattern in your ABP, there will be only Indirect and Induced Effects. According to the IMPLAN Results, there is no Direct Effect, but adding in the known Direct Effect can be important for communicating the Total Effects of your analysis. If you’ve completed an ABP, you already have information on the Direct Labor Income, which should be included in the calculation of Direct Value Added and Direct Output. For an ABP you also must know either Direct Output or Direct Intermediate Inputs. Remember how Output breaks down:

Output___II_VA.jpg

VA___EC_PI_TOPI_OPI.jpg


If not all the Direct factors are known, estimates of these factors can be made from the underlying Study Area Data using the information found in:

Behind the i 

     > Customize Region

          > Filter for Industry

You will find Output value ratios for the Industry you want to use. If the Industry does not exist in the Region, the Proxy region information must be used. Employment can be estimated using the Output per Worker ratios that are provided in:

Behind the i 

     > Study Area Data  

          > Industry Averages

The Direct Effect you produce should replace the effects of all zeros in the downloaded Excel format Results. The existing Indirect and Induced Effects are correct as is. The added Direct Effects can be summed with the existing Indirect and Induced Effects by column to produce the accurate Total Effects.  


ANALYSIS-BY-PARTS: BILL OF GOODS APPROACH

When applying the Analysis-by-Parts technique using the Bill of Goods (BOG) Approach you are using a series of Commodity and/or Industry Effects instead of an Industry Spending Pattern. In the Results, your Direct Effects are from the Commodity/Industry Events, which actually reflect the Intermediate Input purchases made by the true Direct business. The Results should be modified such that these Direct Effects are reclassified as Indirect Effects. Once this step is completed, you should have only Indirect and Induced Effects, similar to the results when using an Industry Spending Pattern in an ABP as shown above.  You can then add in the true Direct Effect as described in the previous section. Don’t forget to sum a new Total Effect. 

Remember, if you’ve completed an ABP, you already have information on the Direct Labor Income, which should be included in the calculation of Direct Value Added and Direct Output. In this ABP approach, you also have information on the Direct Intermediate Inputs, which were analyzed as Commodity Events. If you’ve analyzed Commodity Output values that equal the total spending on each Commodity (locally and non-locally) by the Direct business, then the sum of Commodity Output values in all Commodity Output Events is equal to Direct Intermediate Inputs and can be summed with Direct Value Added to produce Direct Output.  

If you are using this analysis approach because the Industry you are analyzing is not an Industry in the IMPLAN Industry Scheme and you are missing information about the Direct Effect, we recommend basing the Direct Effect calculations on the Industry that is most similar to the Industry you are analyzing with the BOG Approach. 

INTERNALIZING OTHER INSTITUTIONAL EFFECTS

When analyzing Events in a single Region in IMPLAN, the application will generate effects due to spending by only one Institution: Households (in a Multi-Regional analysis trade “spending” is also internalized). Revenue for other Institutions can also be affected. For example, the Tax tab of your Results displays all the fiscal revenue supported by your analysis, but there will be no Direct, Indirect, or Induced Effects due the estimated tax collection being spent by the different levels of government. 

Additional Events can be analyzed to produce these effects if enough information is known on how the Institution’s spending will be affected. In any analysis that includes Institution spending of revenue derived from an already present Direct Effect, you should treat all effects of that spending as Induced. Direct, Indirect, and Induced Effects should be summed and recategorized as Induced Effects when using an Institutional Spending Pattern or any other Event Type to manually internalize the effects of secondary demands from Insitutitions (other than Households) expected to be supported by the other Events being analyzed. 

These Induced Institutional Effects can be combined with the original Effects produced by the Event. In which case a new Total Effect would need to be calculated. 


RELATED ARTICLES

ABP: Using an Industry Spending Pattern

ABP: Bill of Goods Using Commodity or Industry Events

Behind the i

Understanding Intermediate Inputs (II)

INTRODUCTION:

Let’s get this out of the way right off the bat. Intermediate Inputs were previously called Intermediate Expenditures in IMPLAN. Much like Prince (once known as only a Love Symbol) or Sean (middle name now “Love” not “Diddy”) Combs, sometimes we have to change names. And you will love this one!

We changed the title to be consistent with the definition and terminology of the Bureau of Economic Analysis (BEA). The BEA defines Intermediate Inputs as “Goods and services that are used in the production process of other goods and services and are not sold in final-demand markets.”

Intermediate Inputs are purchases of non-durable goods and services such as energy, materials, and purchased services that are used for the production of other goods and services, rather than for final consumption. They do not include any capital-account purchases or labor.


LPF_Box_-_II.jpg


DETAILS:

The first round of Indirect Effects are triggered by the Intermediate Inputs purchased by the Direct business or businesses when analyzing Industry Events, Commodity Events, Industry Contribution Events, and Institutional Spending Pattern Events. The amount of Intermediate Inputs is solely determined by the Event’s Direct Output and the relationship between Output and Intermediate Inputs according to the Direct Industry’s Total Gross Absorption. Further rounds of Indirect Effects reflect the ripple effect through the local Supply Chain. The local businesses affected in the first round of Indirect Effects also purchase Intermediate Inputs from local businesses, and so on.

Labor Income and Household Income Events  do not generate any Indirect Effects but there are Intermediate Inputs still being analyzed in them. In these Events the income spent at local businesses is being estimated and analyzed. The Intermediate Inputs of the Inducedly affected business triggers further rounds of Induced Effects.

When using an Industry Spending Pattern Event the first round of Indirect Effects are triggered by the Intermediate Inputs being analyzed.  The amount of Intermediate Inputs is solely determined either by the Event Value alone (by default Industry Spending Pattern Event Values are total Intermediate Inputs) or by the relationship between Output and Intermediate Inputs according to the specified Industry’s Total Gross Absorption when “Total Output” is selected in the Advanced Menu of the Event instead of Intermediate Inputs. 

Industry Spending Pattern Events are appropriate when modifications to the Intermediate Inputs of an Industry’s Leontief Production Function are necessary. When detailed information is known about Intermediate Input spending, these Events can be used and adjusted to reflect the specific purchases or ratios of purchases. Industry Spending Patterns include all Intermediate Inputs for a given Industry. 

Institutional Spending Patterns are unique in that they describe both Intermediate Inputs and Value Added within the same Spending Pattern. The Results in Institutional Spending Patterns differ: the reported Direct Effects describe both what we would generally consider Direct Effects (income, Employment and Value Added) and the first-round Indirect Effects that arise from the government spending its budget. 


WHERE TO FIND IT IN IMPLAN:

ON THE REGIONS SCREEN

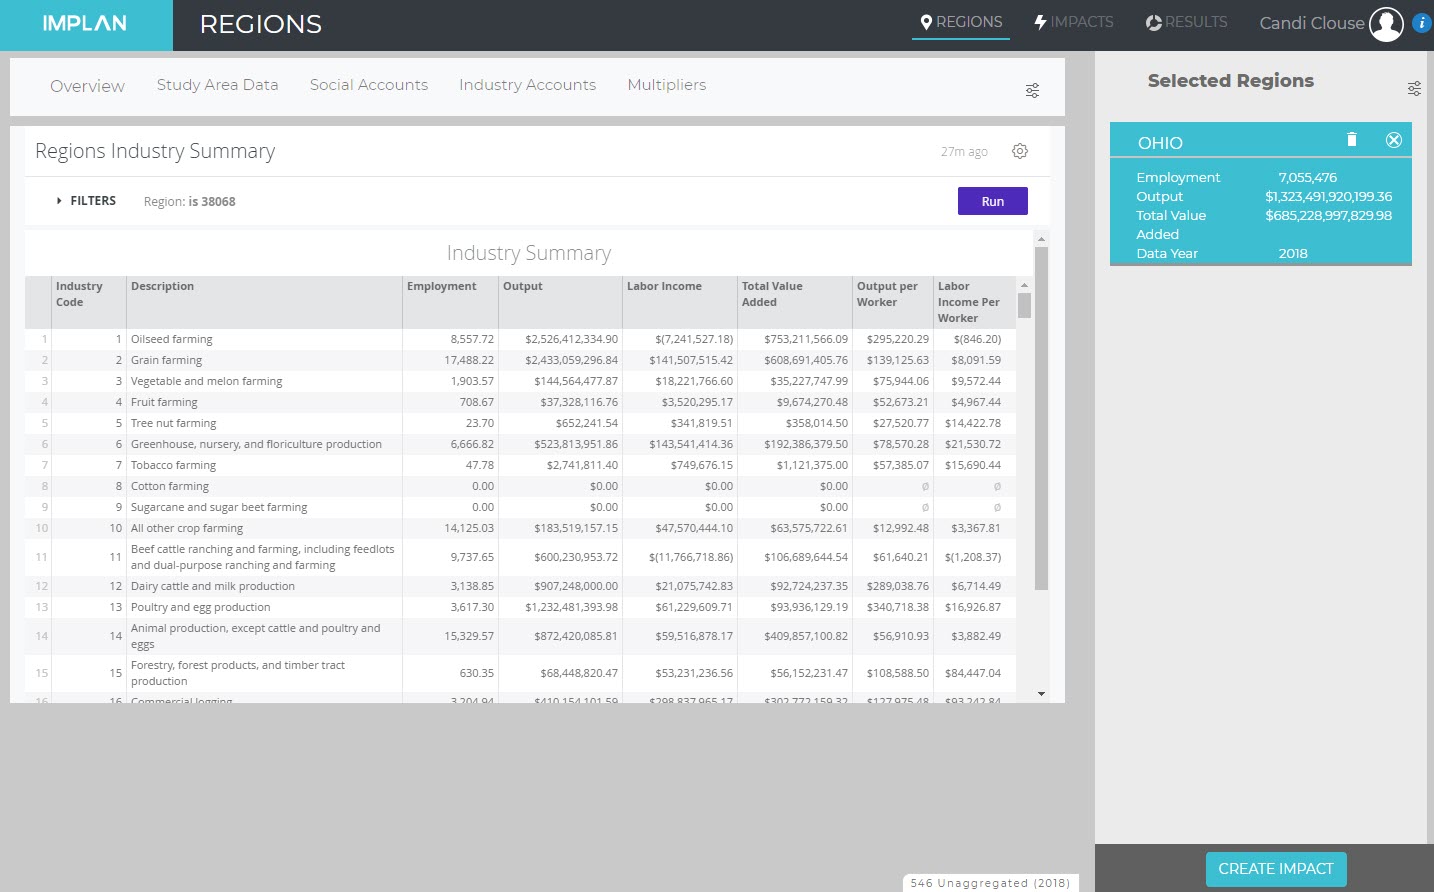
Intermediate Inputs represent the difference between Output and Value Added. To calculate Intermediate Inputs, head to the table Behind the i called Regions Industry Summary by navigating to

     > Study Area Data

          > Industry Summary

 II_-_Regions_Screen.jpg


If we look at Industry 1 – Oilseed farming in Ohio for example, we can calculate Intermediate Inputs 

     = Output – Total Value Added 

     = $2,526,412,335 – $753,211,566.09

     = $1,773,200,769


ON THE IMPACTS SCREEN

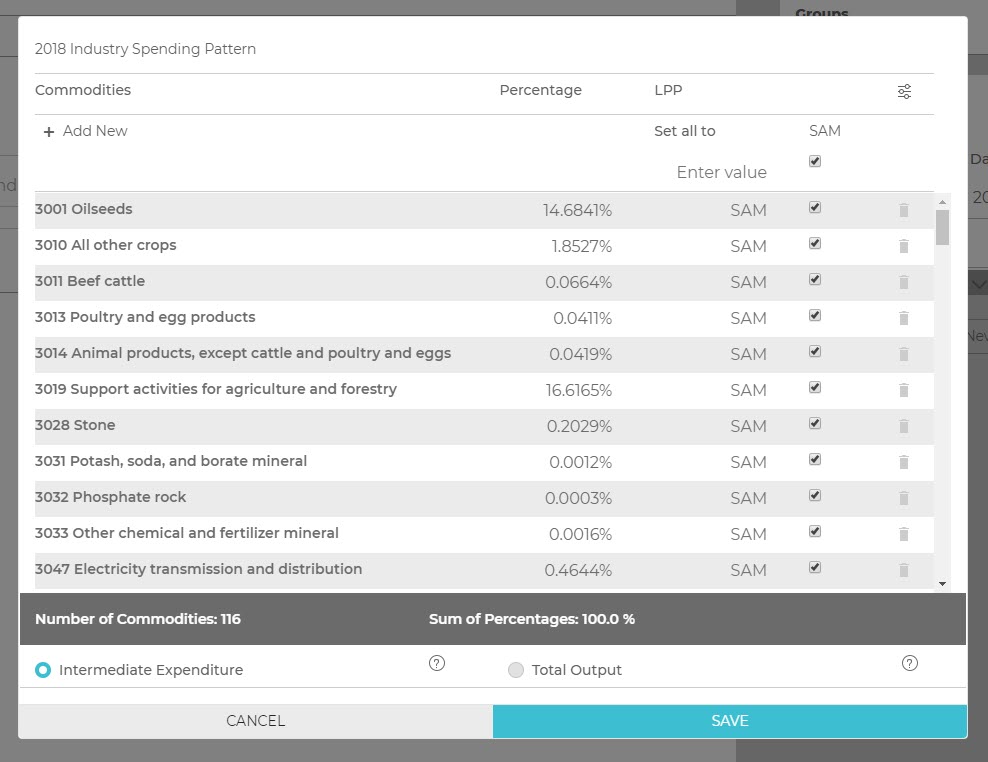
On the Impacts screen, you can see the Spending Pattern for Industries by choosing the Industry Spending Pattern Event Type or for Institutions by choosing the Institutional Spending Pattern Event Type. By clicking on the menu icon and choosing Advanced, you can see the list of Commodities purchased as inputs by that Industry or Institution.

 II_-_Impacts_Screen.jpg


ON THE RESULTS SCREEN

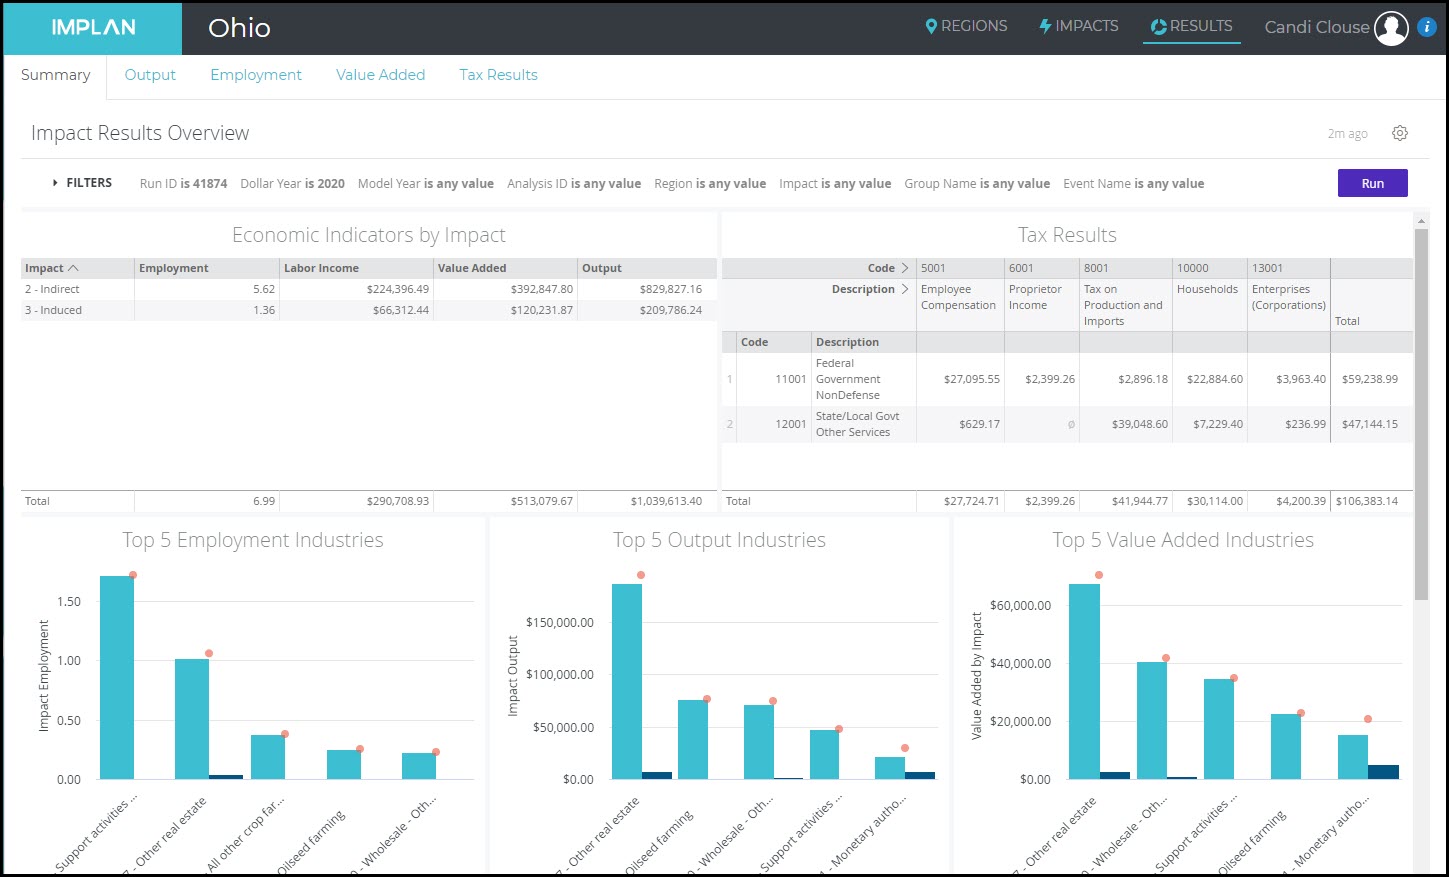
The Summary Results has a table entitled Economic Indicators by Impact. To calculate the Intermediate Inputs, simply take Output less Value Added. Therefore in this example, Intermediate Inputs

     = Output – VA

     = $829,827 – $392,848

     = $436,979


II_-_Results_Screen.jpg 


HOW IS IT CALCULATED?

IMPLAN defines Intermediate Inputs as: 

Output___II_RED_EC_PI_TOPI_OPI.jpg


Or more simply,

Output___II_RED_VA.jpg

So to calculate Intermediate Inputs, we just take Output less the other four components of the Leontief Production Function (which sum to Valued Added).

The Output Equation – Finding Values

INTRODUCTION:

All IMPLAN Industries have a unique Output Equation for each Region and Data Year. You may want to look Behind the i to see a specific Output equation. You can also use this data to find or calculate any part of the Output Equation: Output, Intermediate Expenditures, Value Added, Labor Income, Employee Compensation, Proprietor Income, Taxes on Production and Imports less Subsidies (TOPI), and  Other Property Income (OPI).


USING THE OUTPUT EQUATION:

Using the data in IMPLAN to figure out the missing pieces of the Output equation can be valuable if you are trying to find out what an Industry may spend on Intermediate Expenditures or the percent that is going to TOPI, for example. First, head Behind the i to Customize Region.


Output_Equation_-_Customize_Region.jpg

FINDING INTERMEDIATE EXPENDITURES

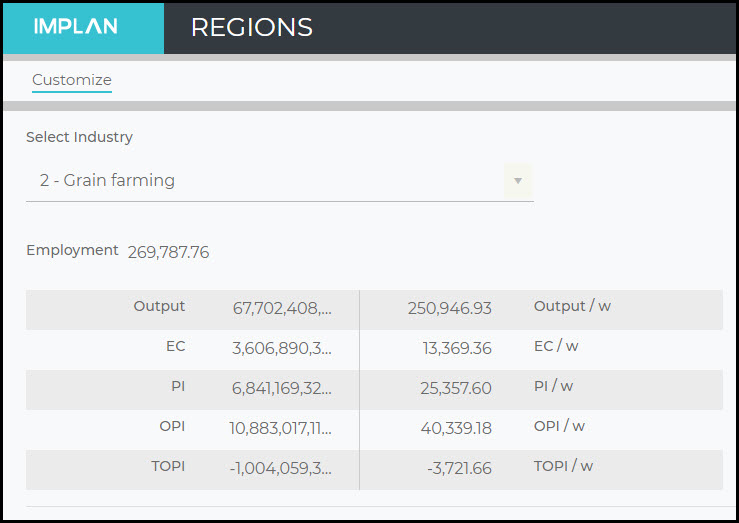
Let’s take a look at Industry 2 – Grain Farming at the U.S. level in 2018.

Output_Equation_-_2_Grain_Farming.jpg

IMPLAN reports Output, Employee Compensation (EC), Proprietor Income (PI), Other Property Income (OPI), and Taxes on Production and Imports less Subsidies (TOPI) along the left side of the box. The column on the right reports these values per worker (/w).

We know the formula for Output:

Output___IE_EC_PI_TOPI_OPI.jpg

And IMPLAN has shown us all but one of these values: Intermediate Expenditures. So we can figure that out by solving for the one missing piece.

$67,702,408,597  = IE + $3,606,890,353 + $6,841,169,324 + -$1,004,059,364 + $10,883,017,114

$67,702,408,597  = IE + $20,327,017,426

IE = $47,375,391,171


FINDING VALUE ADDED

Value Added is simply the summation of EC + PI + TOPI + OPI.  Again using Industry 2 – Grain Farming, we can find Value Added.

VA___EC_PI_TOPI_OPI.jpg

VA = $3,606,890,353 + $6,841,169,324 + -$1,004,059,364 + $10,883,017,114

VA  = $20,327,017,426


FINDING LABOR INCOME

Labor Income is simply the summation of EC + PI.  Again using Industry 2 – Grain Farming, we can find this value.


LI___EC_PI.jpg


LI = $3,606,890,353 + $6,841,169,324 

LI  = $10,448,059,677


RELATED ARTICLES: 

The Output Equation

The Output Equation – Differences by Industry

Output, Value Added, & Double-Counting

The Output Equation – Differences by Industry

For every possible IMPLAN Region, all IMPLAN Industries have a unique Output Equation. IMPLAN collects data to determine the Output Equation for each Sector for each Region and Year available in IMPLAN in terms of dollars. The Output Equation, in dollars, is converted to percentages of Output such that the equation sums to 100%. The Output Equation in percentages determines how each Sector allocates Output when modeled via an Industry Event. How do these differences look in the Output equation?

DETAILS:
The formula for the Output equation is:

Output = Intermediate Expenditures + Employee Compensation + Proprietor Income +
Tax on Production and Imports + Other Property Income

We show this visually like this:

Output_Equation_Blue_Box.jpg

To take a look at how the Output equation is different, five different Industries at the US level for 2018 are shown.

INDUSTRY 4 – FRUIT FARMING
Output_Equation_Blue_Box_-_4_-_Fruit_farming.jpg

INDUSTRY 25 – SILVER ORE MINING
Output_Equation_Blue_Box_-_25_-_Silver_ore_mining.jpg

INDUSTRY 76 – CONFECTIONERY MANUFACTURING FROM PURCHASED CHOCOLATE
Output_Equation_Blue_Box_-_76_-_Confectionary_mfg.jpg

INDUSTRY 455 – LEGAL SERVICES
Output_Equation_Blue_Box_-_455_-_Legal_svcs.jpg

INDUSTRY 499 – INDEPENDENT ARTISTS, WRITERS, AND PERFORMERS
Output_Equation_Blue_Box_-_499_-_Independent_artists_writers_performers.jpg

Scanning these we can see differences across the Industries.

Industry

Intermediate Expenditures

Employee Compensation

Proprietor Income

TOPI

OPI

4 – Fruit farming

42%

16%

17%

0.01%

25%

25 – Silver ore mining

50%

23%

1%

5%

21%

76 – Confectionery manufacturing from purchased chocolate

77%

14%

1%

1%

7%

455 – Legal services

29%

36%

7%

5%

23%

499 – Independent artists, writers, and performers

15%

19%

52%

6%

9%

Fruit farming, mining, and manufacturing all have high percentages in Intermediate Expenditures. These Industries all need to purchase more inputs for production than other Industries like those that provide services. Of the five Industries selected, Legal services has the highest percentage of Output going toward Employee Compensation and anyone that has paid legal fees understands why this is the case. Independent artists, writers, and performers have the highest percentage going towards Proprietor Income. Of these five Industries, artists are the most likely to be self-employed.

Fruit farming also has a very tiny percentage in TOPI (likely due to subsidies). Fruit farming and Legal services both have higher relative percentages of their Output going to OPI.

So, as you can see, each Industry in IMPLAN has a unique Output equation. Each Region will also have a different Output equation for each Industry, so you can not only compare Industries in the same Region, but you can also compare how the Output equation differs for a single Industry in multiple regions.

Estimating and Distributing Value Added

All IMPLAN Value Added data are ultimately controlled to National Income and Product Accounts (NIPA) data published by the Bureau of Economic Analysis (BEA).


Employee Compensation and Proprietor Income

Please see this webpage for detailed information on the estimation of Employee Compensation and Proprietor Income: Estimating Non-Disclosures when Creating Employment and Labor Income Data.


Other Property Income (OPI) and Taxes on Production and Imports Net of Subsidy (TOPI)

Initial estimates of national TOPI by IMPLAN sector are generated by applying TOPI/Output ratios from the latest BEA Benchmark I-O table to current Output estimates. Initial estimates of national OPI by IMPLAN sector are generated by subtracting Intermediate Expenditures, Employee Compensation (EC), Proprietor Income, and TOPI from Output. These first estimates of national TOPI and OPI by IMPLAN sector are then controlled to the BEA’s GDP-by-industry data, after projecting to the current data year.

To distribute the national data to the states, we turn to the BEA’s GDP by State data. State-level OPI-to-EC and TOPI-to-Employment ratios are used with each county’s EC and Employment estimates for each IMPLAN sector to calculate county-level first estimates of OPT and TOPI by IMPLAN sector. County-level OPI and TOPI estimates by IMPLAN sector are then forced to sum to the state level OPI and TOPI estimates.

Overview of Value Added Data

Four Components of Value Added

  1. Employee Compensation
  2. Proprietor Income
  3. Other Property Income
  4. Taxes on Production and Imports net of subsidy

Calculation of Value Added

Labor Income (Employee Compensation and Proprietor Income)

BLS’ CEW is our primary source of employment and income data; however, CEW data excludes some Sectors1 and does not include proprietors, proprietor income, employer-paid taxes (social insurance, unemployment), or benefits such as health and private retirement. CEW data will have some non-disclosures (i.e., sectors for which wage and employment data are not revealed). To get employment estimates for these, we use the Census Bureau’s County Business Pattern (CBP) employment data. Since CBP does not provide data on wages, we use state-level wage per worker ratios together with the county-level CBP employment data to get county-level wage estimates.

Finally, we turn to the BEA’s REA data series to get estimates for Employee Compensation (i.e., fully loaded payroll), Proprietor Income and Employment, and the sectors missing from CEW. Due to the REA data being lagged one year and in a more aggregate sectoring scheme, the CEW data are used to project the REA data to the current data year and to distribute them to the 536 IMPLAN Sectors.

Other Value Added (Other Property Income and Taxes on Production and Imports Net of Subsidies)

The BEA also releases Taxes On Production and Imports net of subsidy (a change in definition from Indirect Business Taxes in past IMPLAN datasets) and Gross Operating Surplus (GOS) data at the 3-digit NAICS level. Gross Operating Surplus includes Proprietor Income and Other Property Income; thus, Other Property Income, for 3-digit NAICS is derived by subtracting our estimates of Proprietor Income from GOS. These 3-digit control values are distributed to the detailed industries based on the Benchmark I-O characteristics for Other Property Income.  However, the BEA data are lagged a year and must be projected first, using growth rates from other data sources. 


1. The CEW data provides employment and wage information for workers covered by State Unemployment Insurance (UI) laws and Federal workers covered by the Unemployment Compensation for Federal Employees (UCFE) program. Major exclusions from UI coverage include most agricultural workers on small farms, all members of the Armed Forces, elected officials in most states, most employees of railroads, some domestic workers, most student workers at schools, and employees of certain small nonprofit organizations.

Output Data Information

In IMPLAN, Total Industry Output (TIO) is the value of production by industry in a calendar year.  It can also be described as annual revenues plus net inventory change.  The output for the wholesale and retail sectors represents the wholesale or retail margin only; it does not represent revenues (sales). 

National Industry Output

Output is, by necessity, estimated from a number of sources. With the exception of the farm sectors and the commercial fishing sector, for which there is state-level raw data, raw TIO data are only available at the national level.  IMPLAN Output data largely come from the same sources as those used by the BEA in developing their Benchmark I-O tables.  The raw data source for the construction sectors and most service sectors is the BEA’s Industry Output Series.  The raw data source for most manufacturing sectors is the U.S. Census Bureau’s Annual Survey of Manufactures (ASM).  Both of these data sources are on a national basis and are lagged one year relative to the IMPLAN data year.  These data are projected based on the change in employment and employee compensation from the previous year to the current data year. While the BEA Industry Output Series data  for detailed sectors is lagged one year relative to the IMPLAN data year, the same data source has a non-lagged series at a more aggregate sectoring level, to which we control our projected values for the more detailed sectors.  Redefinition adjustments are also applied to output estimates in accordance with BEA practices.  Some special sectors require information from other surveys and censuses, as described below. 

Farm Sectors

We get state-level output estimates for the farm sectors from the USDA’s NASS Value of Production and ERS Cash Receipts data series. These state values are then distributed to the counties by using the ratio of county physical production to state physical production from the latest Census of Agriculture.  Please see this document for more details.

Extraction of Natural Gas and Crude Petroleum and Extraction of Natural Gas Liquids

We use a combination of BEA Output Series data, Economic Census data, and physical production and prices data from the U.S. Energy Information Administration (EIA) for petroleum and natural gas. While the EIA data are current and have the necessary sector detail, they are on a commodity basis, whereas the BEA data (which are lagged a year and have less sector detail) are industry-based, which is what IMPLAN needs. Thus, we first use the ratio of “Extraction of natural gas and crude petroleum” output to “Extraction of natural gas liquids” output from the latest Economic Census (which only comes out every 5 years) to split out the lagged BEA value into the two IMPLAN sectors. We then project the two BEA figures using the EIA data.


Retail

The BEA Industry Output series has a limited number of retail sectors. Therefore, we apply the margin-to-sales ratio, calculated using data from the U.S. Census Bureau’s Annual Retail Trade Survey which is lagged one year, to current year sales data from the U.S. Census Bureau’s monthly time-series data for retail sales to get an estimate of current year retail margin. Note that the output for the wholesale and retail sectors represents the wholesale or retail margin only; it does not represent revenues (sales). 

Other Sectors

National output for the owner-occupied housing and tenant-occupied housing sectors is set to the Personal Consumption Expenditure (Household Final Demands) values for owner-occupied housing and tenant-occupied housing from BEA NIPA Table 2.4.5. – Personal Consumption Expenditures by Type of Product.

State-level output for the commercial fishing sector comes from the NOAA Fisheries Office of Science & Technology, Fisheries Statistics DivisionOAA Fisheries Office of Science & Technology, Fisheries Statistics Division.

Sectors 527 through 530 (Used and second-hand goods, Scrap, Rest of world adjustment, and Non-comparable imports, respectively) are commodities only; therefore, their TIO is zero.

Sectors 531-536 are government payroll sectors and whose TIO, by definition, is equal to Value-Added.

State and County Distribution of National TIO

For the farm sectors and the commercial fishing sector, state-level TIO data are available.  County data are a function of state output per worker ratios applied to county employment figures.  For the remaining sectors, the first estimate of TIO is calculated as Intermediate Expenditures (IE) plus Value-Added (VA), where IE is based on U.S. IE-to-Employment ratios.  State TIOs are forced to sum to U.S. TIO, and county TIOs are forced to sum to state TIOs.

Measures of GDP: Value Added and Final Demand

GDP Defined

GDP is defined as the total market value of all final goods and services produced within a region in a given period of time (usually a quarter or year). GDP is the sum of value added at every stage of production (the intermediate stages) of all final goods and services produced within a country in a given period of time. In other words, GDP is the wealth created by industry activity. In a social accounting matrix (SAM) model such as IMPLAN, this is the sum of value added. Furthermore, in a balanced SAM model, total value-added = total final demand.

Note that GDP is only concerned with new and domestic production; therefore, it excludes the value of used goods and output produced in another country that is owned by domestic factors of production (including the latter yields Gross National Product). Note also that not all productive activity is included in GDP. For example, unpaid work (such as that performed in the home or by volunteers) and black-market activities are not included because they are difficult to measure and value accurately. That means, for example, that a baker who produces a loaf of bread for a customer would contribute to GDP, but would not contribute to GDP if he baked the same loaf for his family (although the ingredients he purchased would be counted).1 GDP takes no account of the wear and tear on the machinery, buildings, etc. (i.e., capital stock) that are used in producing the output. If this depletion of the capital stock, called depreciation, is subtracted from GDP we get net domestic product.1

Furthermore, GDP is not a measure of the overall standard of living or well-being of a country. Although changes in the output of goods and services per person (GDP per capita) are often used as a measure of whether the average citizen in a country is better or worse off, it does not capture things that may be deemed important to general well-being. So, for example, increased output may come at the cost of environmental damage or other external costs such as noise. Or it might involve the reduction of leisure time or the depletion of nonrenewable natural resources. The quality of life may also depend on the distribution of GDP among the residents of a country, not just the overall level.1

Measuring GDP

Theoretically, GDP can be measured in three different ways: the production method, the income method, and expenditure method. Conceptually, all of these measurements are tracking the exact same thing. Some differences can arise based on data sources, timing and mathematical techniques used.

Production Method

The production approach sums the “value-added” at each stage of production, where value-added is defined as total output (also known as value of production)2 less the value of intermediate inputs into the production process. This can be calculated either by subtracting input costs from the final output of each industry or by summing each industry’s payments made to the factors of production.3

National Income Method

The income approach sums the incomes generated by production, which includes the following:

  1. Compensation of employees (wages, salaries, benefits, etc)
  2. Proprietor income (sole proprietorship and unicorporated business income
  3. Rental income (property-owner income)
  4. Corporate profits
  5. Net interest (paid by business)
  6. Taxes on production and imports (sales tax, property tax, custom duties, and other taxes and fees) less government subsidies
  7. Net business transfer payments (net payments by businesses to persons, government, and the rest of the world for which no current services are performed
  8. Surplus of government enterprises

National Expenditure Method

The expenditure approach is the most widely-used approach to measure GDP. This approach adds up the value of purchases made by final users. Final demand expenditures consist of:

  1. Personal consumption expenditures: spending by households on non-fixed-capital items.
  2. General government final consumption: spending by governments on non-fixed-capital items, excluding transfer payments.4
  3. Gross domestic fixed capital formation: the value of houses and other durables formed during the year plus increases in stocks and works in progress (i.e., net additions to inventory).
  4. Net Exports: exports represent items that are produced in the country and sold to purchasers outside the country. In the same way, imports are subtracted from the calculation.
  5. From this sum, institutional sales must be subtracted since they are accounted for elsewhere in GDP. For example, a government institution5 might provide hospital services to a household. Government then has extra income and extra spending (e.g., buying more stethoscopes). The sale/purchase of hospital services cannot increase both personal consumption expenditures and government final consumption.

Relationship between GDP and Final Demand

In general macroeconomic terms, both GDP and Final Demand (FD) share the same equation: GDP or FD = total consumption spending (C) + gross private investments (I)6 + total government expenditures (G) + net exports (X-M). In compact form:

[1]   FD = C + I + G + (X-M)

Note that total output by industry (O) is the sum of output going to final demand (e.g., production of vegetables that households consume), plus output that serves other industries, also known as intermediate expenditures (IE) (e.g., vegetables that food manufacturing sectors buy as one of their inputs into the production of other food products). So, we now have another equation in compact form:

[2]   O = FD + IE

As mentioned above, output can be measured as the sum of value added and intermediate expenditures. One could ask each business how much raw materials and services they purchased, how much did they pay employees, how much did they pay in taxes, and how much was left over as profit. This gives a third equation:

[3]   O = IE + VA

Note that VA consists of labor income (LI), other property income (OPI), and taxes on production and imports net of subsidies (TOPI):

[4]   VA = LI + OPI + TOPI

If we substitute the right-hand side of equation [3] into the left-hand side of equation [2], we get the following:

IE + VA = FD + IE.

In this case, IE cancels on both sides, and we are left with VA = FD, which demonstrates the equality of Value Added and Final Demand. Thus, it is true that final demand equals value added. This equality can be envisioned graphically in a SAM as well. The row sum for an industry equals the column sum for that same industry. Each transaction where industries intersect is a component of IE. Other than IE, each industry’s row has only FD leftover. Similarly, other than IE, each industry’s column has only VA left over. Since output measured by rows equaled output measured by column to begin with, it is necessarily the case that FD = VA.

One can also use equations [1] and [4] to relate the components of FD and VA as follows:

C + G + I + X – M = LI + OPI + TOPI.


1http://www.imf.org/external/pubs/ft/fandd/basics/gdp.htm

2Value of production = sales + net inventory change + on-site use (e.g., on-farm consumption)

3In IMPLAN, the factors of production are Employee Compensation, Proprietor Income, Other Property Income (largely corporate profits), Taxes on Production and Imports less Subsidies.

4Transfer payments include Social Security, Medicare, unemployment insurance, welfare programs, and subsidies.

5Government institutions represent administrative government and are distinct from government enterprises in that the latter cover a significant portion of their operating expenses through sales (for example, public transportation services cover a large portion of their operating costs through ticket sales).

6Savings and investment are the same thing in accounting. Savings are defined as the money left in the business after all costs and profits have been paid/distributed. If these savings are not invested in something concrete, it can still be considered an investment in cash.

Output, Value Added, & Double-Counting

INTRODUCTION:

Gross Output and Gross Domestic Product (GDP) are both highly useful economic statistics that are published as part of the BEA’s industry accounts. 

OUTPUT

Output is the value of an industry’s production.  It can be measured in two ways: from the sales (income) perspective or the expenditures (spending) perspective.

  1. From the sales (income) perspective, Output is the sum of sales to final users in the economy (GDP) + sales to other industries (intermediate inputs) + inventory change.  
  2. From the expenditures perspective, Output is the sum of an industry’s Value Added + intermediate inputs.

VALUE ADDED

Value Added is defined as the total market value of all final goods and services produced within a region in a given period of time (usually a quarter or year).  It is the sum of the intermediate stages of production. It is the sum of all added value at every stage of production (the intermediate stages) of all final goods and services produced within a country in a given period of time.  In other words, it is the wealth created by industry activity (1).

Value Added in a Social Accounting Matrix (SAM) model such as IMPLAN, is equal to Gross Domestic Product (GDP). In a balanced SAM model, total Value Added = total Final Demand.  

COMPARING OUTPUT & VALUE ADDED:

OUTPUT VS. VALUE ADDED 

Output is simply a measure of the total value of all goods produced. Value Added is a subset of Output and is a useful measure of wealth created by an economy.  An industry buys goods and services from other industries and remanufactures those goods and services to create a product of greater value (Output) than the sum of the goods that goes into its product (Intermediate Expenditures). That increase in value is the value that the producer adds to the inputs as a result of the production process.  This added value is then used to pay labor and taxes with hopefully some remainder for profit.

DOES OUTPUT DOUBLE-COUNT?

Analysts sometimes focus on Output because it is bigger than Value Added.  However, because the Output of an industry requires Output from other industries, it double-counts if one attempts to use it as a measure of aggregate production.  

For example, suppose an entrepreneur named Doug sets up a shop called “Doug’s Computer Service” to install an operating system onto customers’ computers, as well as give some instruction on how to use it.  For this service he charges $100. If he services 100 customers:

     Revenue (Output) = $10,000

     Shop costs (electricity, rent, etc.) = $2,000

     Value Added = $8,000 (from this he pays property taxes, production taxes, and has a net
     profit) 

Based on the needs of his customers, Doug decides that he will order the computer for them and turn over a complete product.  The computer costs him $950 and he will tack on $50 for the additional hassle of buying the computer. Thus, for each unit the customer now pays $1,100 ($1,000 for the computer plus $100 for the service).  This time, if he services 100 customers: 

     Revenue (Output) = $110,000

     Computer costs = $95,000

     Other shop costs = $2,000

     Value Added = $13,000

Doug’s Output has gone up 1,000% but Value Added only grew by 63% (his costs increased by 4,750%).  His firm’s huge increase in Output would be very misleading as an indicator of how the local economy is doing.  If the computer is manufactured locally, then the manufacturer’s Output will show up as an Indirect Effect, which will double count its contribution to the economy if it is also included in Doug’s firm’s overall Direct Output Effect.  Thus, while Output is an essential statistical tool needed to study and understand the interrelationships of the industries that underlie the overall economy, because of its duplicative nature it may not be a good stand-alone indicator of the overall health or contribution of an industry or sector (2).


Written July 12, 2019

1. Note, however, that GDP misses some aspects of a region’s economic performance.  See this article for more: http://www.foreignaffairs.com/articles/140790/diane-coyle/beyond-gdp

2. For more, see: http://www.bea.gov/faq/index.cfm?faq_id=1034&searchQuery#sthash.U1eMBclU.dpuf