
The perfect visual to show your national footprint.
Showcase your economic footprint with IMPLAN’s Embeddable Maps: dynamic, visual tools designed to bring your impact analysis to life, right on your website.
The perfect visual to show your national footprint.
Showcase your economic footprint with IMPLAN’s Embeddable Maps: dynamic, visual tools designed to bring your impact analysis to life, right on your website.
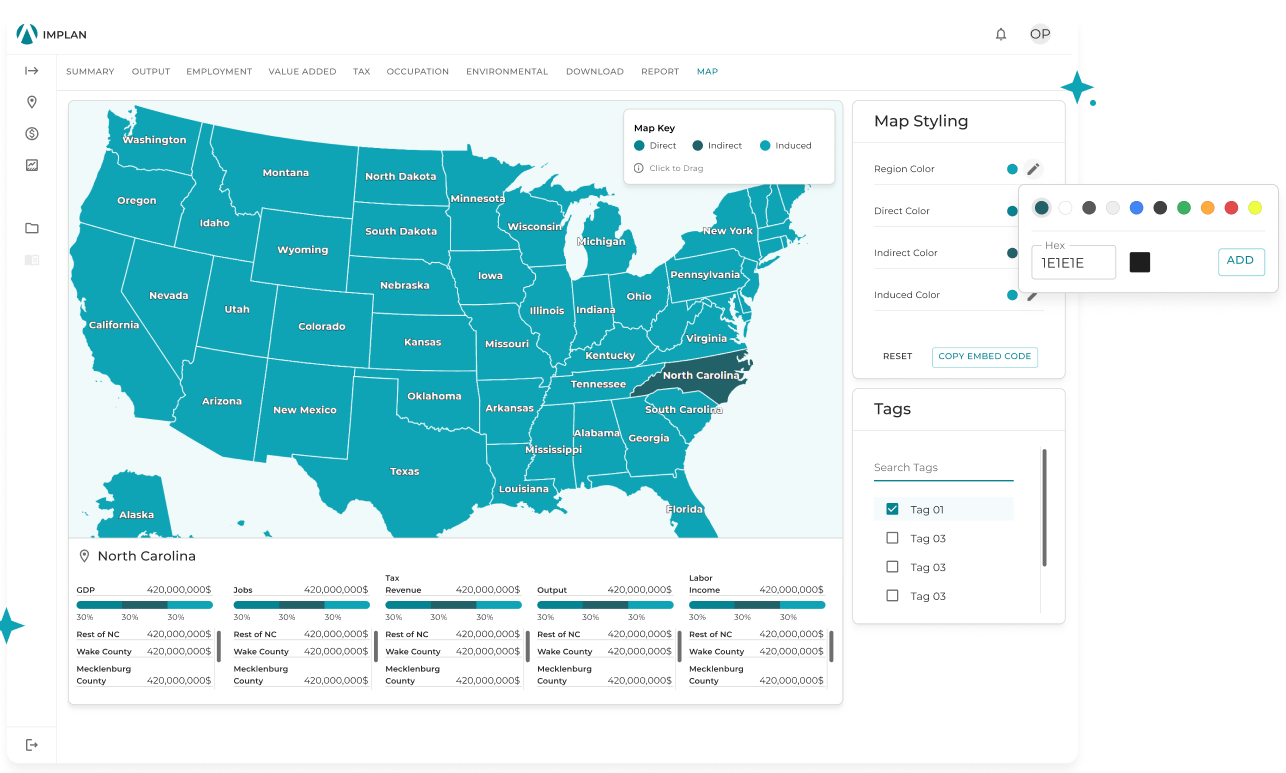
What Are Embeddable Economic Impact Maps?
IMPLAN’s Embeddable Maps feature allows you to create interactive, web-based economic visualizations – no coding or GIS expertise required. These maps make it easy to communicate key insights like employment impact, tax revenue, output, and labor income across states and counties.
Perfect for embedding on:
- Economic development websites
- Government and policy reports
- Research dashboards
- Sustainability reports
- Investor relations pages
Key Features of IMPLAN Embeddable Maps
Conducting an EIA requires careful planning and accurate data. Here are the basic steps:
- Interactive: Hover over each state or county to explore detailed economic metrics.
- Fully Embeddable on Any Website: Generate a simple embed code and drop it into your site. No web developer or plugin needed.
- Shareable and Customizable: Use your organization’s branding and easily integrate maps into public pages or internal dashboards.
Embeddable Maps in Action: Automotive Manufacturing in the Southeast
- Indirect and induced job creation
- Regional GDP contribution
- Labor income and tax revenues
- Industry ripple effects
IMPLAN simplifies economic impact analysis, offering:
- Comprehensive Data: Access to detailed industry, regional, and demographic data.
- Customizable Scenarios: Tailor analyses to specific projects, policies, or regions.
- User-Friendly Tools: Intuitive platform with powerful visualization and reporting capabilities.
Whether you’re conducting a feasibility study, evaluating policy impacts, or exploring new markets, IMPLAN empowers you to make data-driven decisions with confidence. Let IMPLAN’s Embeddable Maps help you turn data into an impactful, visual story.
Interested in learning more? See IMPLAN in action or book your demo with us today to explore how IMPLAN can enhance your economic analyses.