Error Messages & How to Fix Them

INTRODUCTION

The IMPLAN Development Team works tirelessly to ensure that your experience using the application is as smooth as possible. Once in a while, however, you will see “Oops! Something went wrong” or the dreaded coral colored error bar shows up on your screen.

The first thing we recommend to fix any issues is to clear your cache and then logout and log back into your account. If that doesn’t work, here’s what all of these error messages mean and how to fix them.


WEB BROWSER

IMPLAN recommends using Google Chrome to get the best experience. IMPLAN also works in Edge, Firefox, and Safari. Internet Explorer is no longer supported.  


Error_-_IE.jpg


OOPS SOMETHING WENT WRONG

It’s never good when a frowny face shows up on your screen. The error notes “There could be a misconfiguration in the system or a service outage. We track these errors automatically, but if the problem persists feel free to contact us. Please try again.”


Error_-_Oops.jpeg


Cause

Solution

Using Internet Explorer

Literally use anything else

Using an outdated bookmark to login

Go straight to app.implan.com to login

Outage or server disruption

Our Product Team has automatically been alerted and will be working on this fix ASAP


CORAL ERROR BAR

Sometimes you will see a coral error bar pop up on your screen. Here are the reasons why the error is being triggered.


Error_-_Model_is_not_built_yet.jpg


Cause

Solution

Specification Code cannot be negative or zero.

Choose an appropriate selection in the Specification field and hit Run.

Model is not built yet for group X.

IMPLAN is building your Combined Region or Custom Aggregation Scheme; give it a few minutes and try again. You can check to see if a Region is done building by checking for the information icon being available on the Regions screen.

Object Progress Event

Take out any special characters you have in your name like #, +, %, etc.

This action cannot be completed because one or more Groups has no name. Please name all Groups.

One or more of your Groups on the right side of the screen is missing a name, please add one.

Please ensure that all groups have  Region selected from the Regions drop down menu for each group

Ensure that there is a Region name populated in each Group


BLANK SCREEN

If you navigate to a screen in IMPLAN and you don’t see the tables you expect, refresh your screen. If that doesn’t work, clear your cache and then logout and log back into your account. 


IF ALL ELSE FAILS

Your Customer Success Manager is here to help! Shoot an email to support@implan.com and one of our team members will look into the problem to ensure you can successfully complete your project.


RELATED ARTICLES

Did You Know?

Known Issues in IMPLAN

Common Acronyms

INTRODUCTION

At IMPLAN, we use a lot of acronyms. Here’s a list of what they are and what they mean.


IMPLAN TERMS

ABP

Analysis by Parts

EC

Employee Compensation

HH

Household

II

Intermediate Inputs

I-O

Input-Output

ICA

Industry Contribution Analysis

LI

Labor Income

LPF

Leontief Production Function

LPP

Local Purchase Percentage

MRIO

Multi-Regional Input-Output

OPI

Other Property Income

PI

Proprietor Income

RPC

Regional Purchase Coefficient

RSC

Regional Supply Coefficient

SAM

Social Accounting Matrix

S/D Ratio

Supply/Demand Ratio

TOPI 

Taxes on Production & Imports less Subsidies

VA

Value Added

DATA TERMS

FTE

Full-time equivalent

GDP

Gross Domestic Product

LMI

Labor Market Information

MSA

Metropolitan Statistical Area

NAICS

North American Industry Classification System

PC

Personal Consumption Expenditures


DATA SOURCES

ASM

Annual Survey of Manufacturers

BLS

Bureau of Labor Statistics

BEA

Bureau of Economic Analysis

CBP

County Business Patterns

CEW

(Quarterly) Census of Employment and Wages

EIA

U.S. Energy Information Administration

NASS

National Agricultural Statistics Service

NIPA

National Income & Product Accounts

NOAA

National Oceanic and Atmospheric Administration

REA

Regional Economic Accounts

SNA

System of National Accounts

USDA

U.S. Department of Agriculture

QCEW

Quarterly Census of Employment and Wages


What Kind of Data Can I Bring to IMPLAN?

INTRODUCTION

Your answers to the questions you should ask yourself when preparing your analysis: Who, What, Where, When and Why can range in level of detail widely. The more information you bring to IMPLAN, the more detailed your analysis can be defined. IMPLAN is based on Input-Output Analysis which quantifies the secondary demands supported across industries within a given Regional economy due to some primary economic effect. The primary, initial change or effect is entered into IMPLAN using Events by the analyst, you! Therefore you need some information about the level of production, spending, or income/revenue generated from the economic Event you are analyzing. 

This article specifically speaks to defining the What element of your analysis, which corresponds to your Event Values and other Event Settings when entering your analysis into the application. 

The “What” element of your analysis simply refers to the quantified size of the economic Event you are analyzing. Who answers the Industry, Commodity, Institution or Income type responsible for the initial effect being analyzed.

The more data brought into the application from outside of IMPLAN the more IMPLAN data points and averages are being replaced with the analyst’s known values or assumptions. More specificity is added to the analysis when more data is known about the effect and is incorporated in the setup of the analysis in the application. Doing so takes time, effort and attention to detail to prevent any unintended errors. Taking the time to add extra specificity to your analysis is recommended when the data to do so is available and that data is reliable, the “Who” of your analysis spends differently than the norm for this actor in the economy or how IMPLAN says they do, or the details of your analysis will be heavily criticized by your audience. 


INDUSTRY CONTRIBUTION ANALYSIS

Industry Contribution Analysis (ICA) is appropriate when you’d like to estimate how existing production supports demand to other Industries in the economy. As a rule of thumb, we recommend using ICA especially when the existing production you are analyzing makes up more than half of its Industry. ICA allows you to quantify the extent to which that Industry is connected to the Regional economy and on the other side what an economy stands to lose in the hypothetical scenario that the Industry leaves the Region. 

ICA Events in IMPLAN differ from other Event Types, used to analyze Impacts, as they restrict any purchases back to the Industry such that the Indirect and Induced Effects for the specified Industry will always be zero in the Results.  

The Event Value of an ICA Event can either be an Output ($) or a percentage (%) of the Output in the Industry according to the Region Details behind the “i” in the Study Area Data. No other data points can be used in ICA. If you’d like to estimate the contribution of an Industry based on an Employment number, you’ll need to first convert the value to Output using the data in:

     Study Area Data 

          > Industry Summary 

Find the row for the Industry you are analyzing and find the intersecting column for Output per Worker. Multiply your number of employees by Output per Worker for the given Industry.


CONTRIBUTIONS: USING IMPLAN DATA 

Using 100% as the Event Value in an Industry Contribution Analysis is the one situation in which you don’t need to bring your own value to IMPLAN. 


What_Kind_of_Data_-_ICA.jpg


For example, above is an ICA Event setup to analyze the effect of 100% of the Automobile manufacturing Industry. The value of the 100% depends on the Region and Data Year of the Group in which this Event is analyzed. 


What_Kind_of_Data_-_Groups.jpg

Dragging and dropping the Event into a Group with Region: United States, Data Year: 2018 will analyze the effect of the entire Automobile Manufacturing Industry in 2018 across the whole country. Dollar Year is ignored when using a percentage as the Value. Because the analysis will use the Region Details data, the Value analyzed will always be in the same Dollar Year as the Data Year. You can choose what Dollar Year to report in by using the Dollar Year Filter in the Results. 

CONTRIBUTIONS: USING YOUR OWN % OR OUTPUT VALUE

You may want to analyze the contribution of just a segment of an IMPLAN Industry. For example, in 2018, the Output of the U.S. Automobile Manufacturing Industry was $217,100,880,875.11. If the specific manufacturer you want to analyze produced $115B worth of cars in 2018, or about 53% of the value of all cars produced in 2018, I could either us $1115B or 53% as the Event Value.   


IMPACT ANALYSIS

The most common types of Impacts analyzed in IMPLAN are:

  • New construction
  • New business operations
  • New final demand spending:
    • Tourism/Visitors
    • Population growth
    • Fiscal spending policy changes

When there is new activity (such as the possible impacts above) in an economy due to a change in demand, there are additional secondary demands that ripple throughout the Region’s economy. These secondary demands stem from impacted Industry’s need for inputs. The chain of transactions that are supported by the impact in the Region are quantified by IMPLAN as Indirect and and Induced Effects. Unlike in ICA, the specified Industry can experience Indirect and Induced Effects. 

To analyze some new activity, remeber you need to identify in IMPLAN Where and When the Impact occurs by defining the Region, Data Year and Dollar Year. Each of these indicators are captured in a Group. Events specify the economic transactions occurring in the local economy in terms of Type, Specification, and Value. The Who and What of the new activity should be captured by the Event Specification and Value. The Who and What of the economic transaction are paired with Where and When by dragging and dropping an Event into a Group. 

For standard Industry Events, the Event Specification can be defined as the IMPLAN Industry impacted by the initial change. There are four different Industry Event Types: Industry Output, Industry Employment, Industry Employee Compensation, Industry Proprietor Income. Choosing between these Event Types should be based on the known Event Value. In some cases, information about new activity may not be known from a production standpoint, but rather from a consumption standpoint. The Industry vs. Commodity Output article provides a questionnaire to help guide you to the appropriate approach for analyzing your data. 


IMPACTS: SINGLE VALUE 

For construction impacts its common to only know total cost of construction, for operations impacts its common to only known number employees and for new final demand spending, total spend (by Industry or Commodity) is typically all that is known. To analyze any impact, you need to know, at least, either Output, Employment, Total Employee Compensation or Total Proprietor Income.

Output is equal to the total value of production. Industry Output in IMPLAN is the value of the Industry’s production, including production that is added to inventory, in the given Data Year. Commodity Output in IMPLAN is the value of the total supply of the Commodity, including from inventory, in the given Data Year. Output is equivalent to the Producer Price of a good or service. 

Employment in IMPLAN follows the same definition as Bureau of Economic Analysis Regional Economic Accounts (BEA REA) and Bureau of Labor Statistics Quarterly Census of Employment and Wages (BLS QCEW) data, which is full-time/part-time annual average. Thus, it adjusts for seasonality, but does not indicate the number of hours worked per day. Thus, if you have a full-time equivalent (FTE) value you will want to first convert the FTE value to IMPLAN employment prior to using it as an Event Value IMPLAN. Conversely, if you need to report FTEs you will want to convert the IMPLAN employment to reflect those. FTE and wage and salary to Employment Compensation conversions can be found in the article “546 Industries, Conversions, Bridges, & Construction – 2018 Data.”

Employee Compensation is the total payroll cost of the wage and salary employee paid by the employer. This includes wage and salary, all benefits (e.g., health, retirement), and payroll taxes (both sides of social security, unemployment taxes, etc.). IMPLAN also provides a conversion between Employee Compensation and Wage and Salary data in the article “546 Industries, Conversions, Bridges, & Construction – 2018 Data.”

Proprietor Income is the current-production income of sole proprietorships, partnerships, and tax-exempt cooperatives. Excludes dividends, monetary interest received by nonfinancial business, and rental income received by persons not primarily engaged in the real estate business (BEA).

Typically, information about retail and wholesale Industry impacts are in the form of consumer spending, whether the consumer is a business or household. As discussed in the Output section, Output is in Producer Prices. Therefore when you enter Total Revenue into an Retail or Wholesale Industry Event, IMPLAN calculates the Marginal Revenue, a portion of Total Revenue to the specified Industry as the Direct Effect. Read on in the linked articles to learn more about Industry Margins and Commodity Margins.


IMPACTS: MULTI-VALUE

When only one Event Value is provided, IMPLAN estimates all effects based on this one number and the Industry’s average Leontief Production Function. If more than one Event Value is known it is always best to use this known information as opposed to IMPLAN’s estimate to reflect the more unique characteristics of what you are analyzing. 

When multiple Event Values are provided in an Industry Event via the Advanced Menu fields shown below, Output will be determined by the Event Values in the following priority, regardless of the selected Event Type:

  1. Output
  2. Employee Compensation
  3. Proprietor Income
  4. Employment


What_Kind_of_Data_-_Inudstry.jpg


All secondary Event Values will be a customization to IMPLAN’s estimation for the Event Value.

Other data adjustments can be applied to standard Industry Events for some further customization. 


IMPACTS: DOING MORE WITH ABP 

Do you have more information beyond the values that can be entered in an Industry Event: Output, Employment, Employee Compensation and Proprietor Income? Analysis-by-Parts or ABP is a technique for that allows you to define the spending associated with Industry  as you’d like, giving the option to:

  • Specify the purchase amount of all Intermediate Inputs (all commodities purchased from operating the businesses)
  • Specify the Local Purchase Percentage of all Intermediate Inputs
  • Adjust allocations of Output to TOPI and OPI (essentially tax and profit)
  • Specify household income level of employees if known

Getting Started

INTRODUCTION:
Now that you have the information to run your first impact from this article, you are ready to jump into app.implan.com!

Before you can log in to IMPLAN, you must first have valid and active credentials. Valid IMPLAN credentials consist of two components: a username and a password, both of which are exclusive to each individual user. To acquire a username and password, you must first have an active IMPLAN data subscription. To purchase a data subscription, contact us directly at 800-507-9426 or sales@implan.com.

LOGGING IN:
The process begins at the login screen. This is where you will enter your email address and password. Then, click the LOG IN button. If you’ve logged in in the past, you can just click on your email address and you will be directed straight into IMPLAN.

Getting_Started_-_Login.jpg

To change your password, click on the text “Not your account?” and then click “Change or reset password.”

Getting_Started_-_Change_PW.jpg

Upon doing so, you’ll arrive at the Password Reset screen. Click into the empty field that says “yours@example.com” and enter your email address. Click SEND EMAIL. Upon doing so, you’ll return to the Login screen and a message that says “WE’VE JUST SENT YOU AN EMAIL TO RESET YOUR PASSWORD” will appear. Back in your email inbox, you’ll find a new email message from support@IMPLAN.com. Click on the link in the email and you will be prompted to create and confirm a new password. If you don’t see an email from us, check your spam folder.

Once you log in, you will be directed to the IMPLAN dashboard. Here you will find the REGIONS, IMPACTS, and PROJECTS buttons. Throughout the process, you can always click the IMPLAN logo in the upper left to return to this screen.

Getting_Started_-_Dashboard.jpg

SELECTING A REGION:
Next, we will look at the process of selecting a Region in IMPLAN. The procedure begins at the IMPLAN Dashboard and ends at the IMPACTS screen.

IMPLAN needs to know the specific regional economy in which your study’s real-life event will occur. So, every time you conduct an impact analysis with IMPLAN, you’ll need to tell it where your study’s event will take place by selecting a Region. Thankfully, IMPLAN makes this extremely easy to do by offering a large interactive map which lets you complete the process visually.

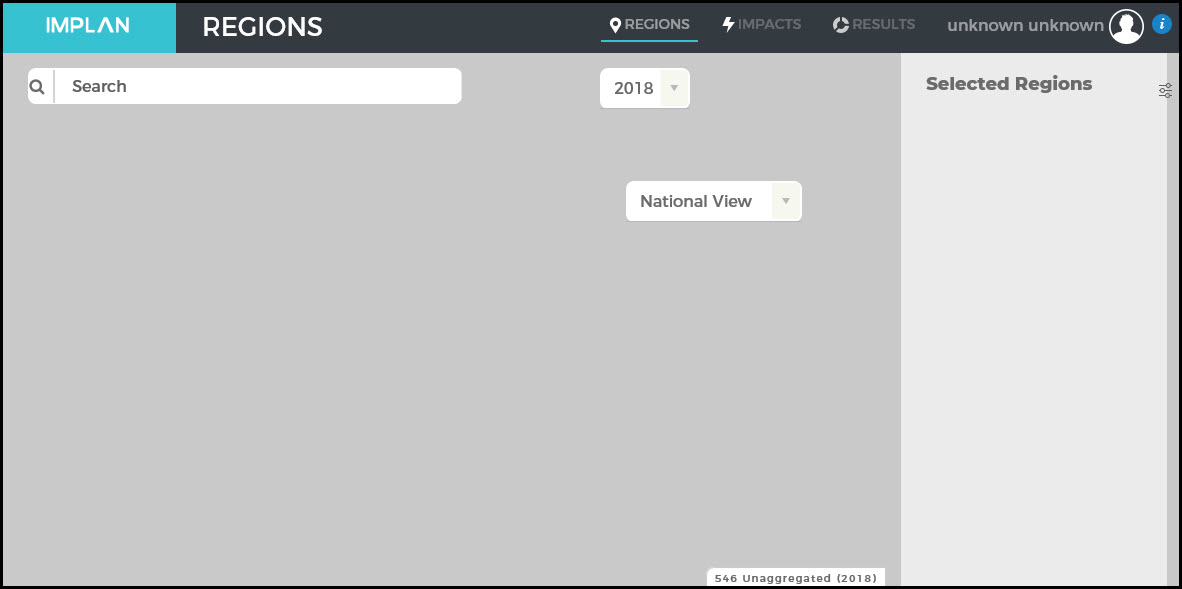
Start by clicking REGIONS from your home screen. This will take you to the map of the U.S.

Getting_Started_-_Regions.jpg

You can select your Region by either clicking on the appropriate place on the map or using the search bar in the upper left of the screen. In the search bar you can type in U.S. Total or the names of states, counties, MSAs, zip codes, or congressional districts. When you have selected a Region, it will become a darker shade of blue on the map and the Region name, Data Year and basic data will populate on the right side of the screen in the Selected Region section.

Next, click the CREATE IMPACT button.

Getting_Started_-_Regions_Create_Impact.jpg

This will create a popup that will prompt you to give your new project a name. Remember to make it easy to understand what you are modeling. Next, hit SAVE.

Getting_Started_-_Regions_Name_New_Project.jpg

After saving, you will be redirected to the IMPACTS screen.

CREATING AN EVENT:
Now we are on the IMPACTS screen and ready to input our data! An Event is arguably the most important element of any impact analysis performed with IMPLAN. When estimating the effects of an economic activity, IMPLAN relies on Events to communicate the unique quantitative characteristics of that activity.

IMPLAN can calculate impact results using as few as just one data point. However, the less you tell IMPLAN about a given event, the less it knows. And the less it knows, the more it has to assume. And the more it has to assume, the less reliable its results can ultimately be in providing insights. So, it’s always best to provide IMPLAN with as much information about your Event as you possibly can if you want the most valuable results possible in return.

To begin, click Add New Event.

Getting_Started_-_Impacts_Add_New.jpg

Upon doing so, a box of editable fields will appear.

Getting_Started_-_Impacts_Event_Line.jpg

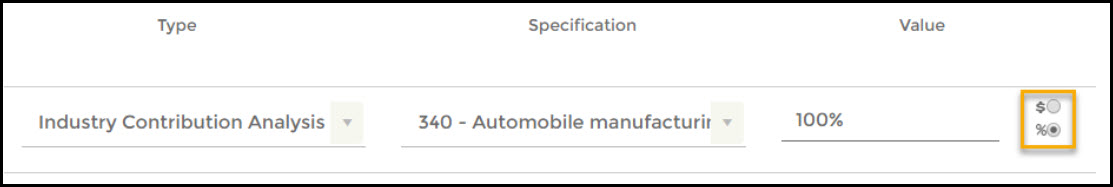
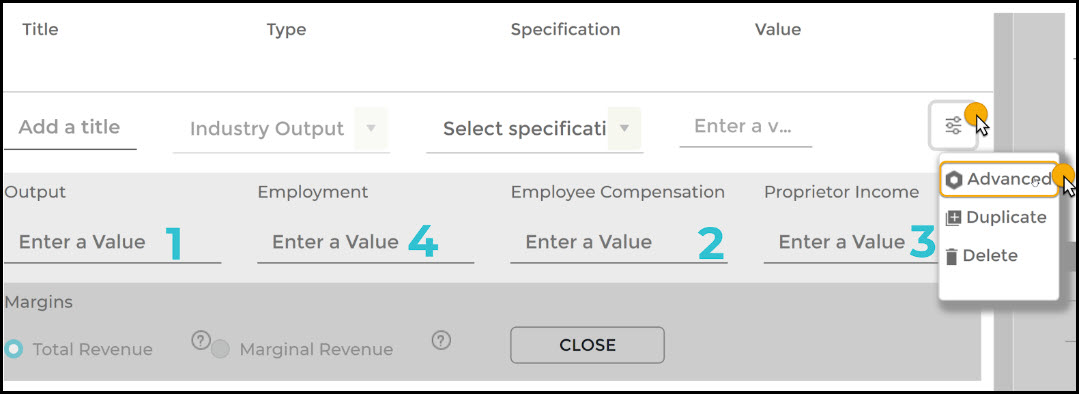
In this box, you will first enter a title. Make it something memorable and explanatory so you can keep track of your different Events. After naming your new Event, click into the Type menu and select an Event Type from its dropdown list. You can choose from Industry, Commodity, Labor Income, Household Income, Contribution, Industry Spending Pattern, and Institutional Spending Pattern. The differences between the Event Types can be found here. The most basic and frequently used are the Industry Events (Output, Employment, Employee Compensation, and Proprietor Income).

After selecting a Type, click into the Specification menu and select from the dropdown list. The options available will vary depending on which Event Type you selected from the Type menu. Industry Events will give you a list of the 546 Industries from which you can choose. If you know the name of the Sector you want to use, you can start typing it directly into the Specification box.

After selecting a Specification, click into the Value field and enter your data point. If you choose an Industry Employment Event, for example, your Value would be the total employment you want to analyze. The options menu button on the right of the Value field can be accessed to allow for further customization, duplication or deletion of the Event.

To move your Event into your Group, click on the Event line until it turns blue. Then you can drag it (while holding the click) over to the right side of the screen into your Group. When your Group turns blue, drop the Event by releasing the click.

Getting_Started_-_Impacts_Drag.jpg

Notice when you add your Event to the Group on the right, the little circle in the upper right of the North Carolina Group box changes from a 0 to a 1. This indicates how many Events are in this Group. You can drag multiple Events into a single Group.

Getting_Started_-_Impacts_BBQ.jpg

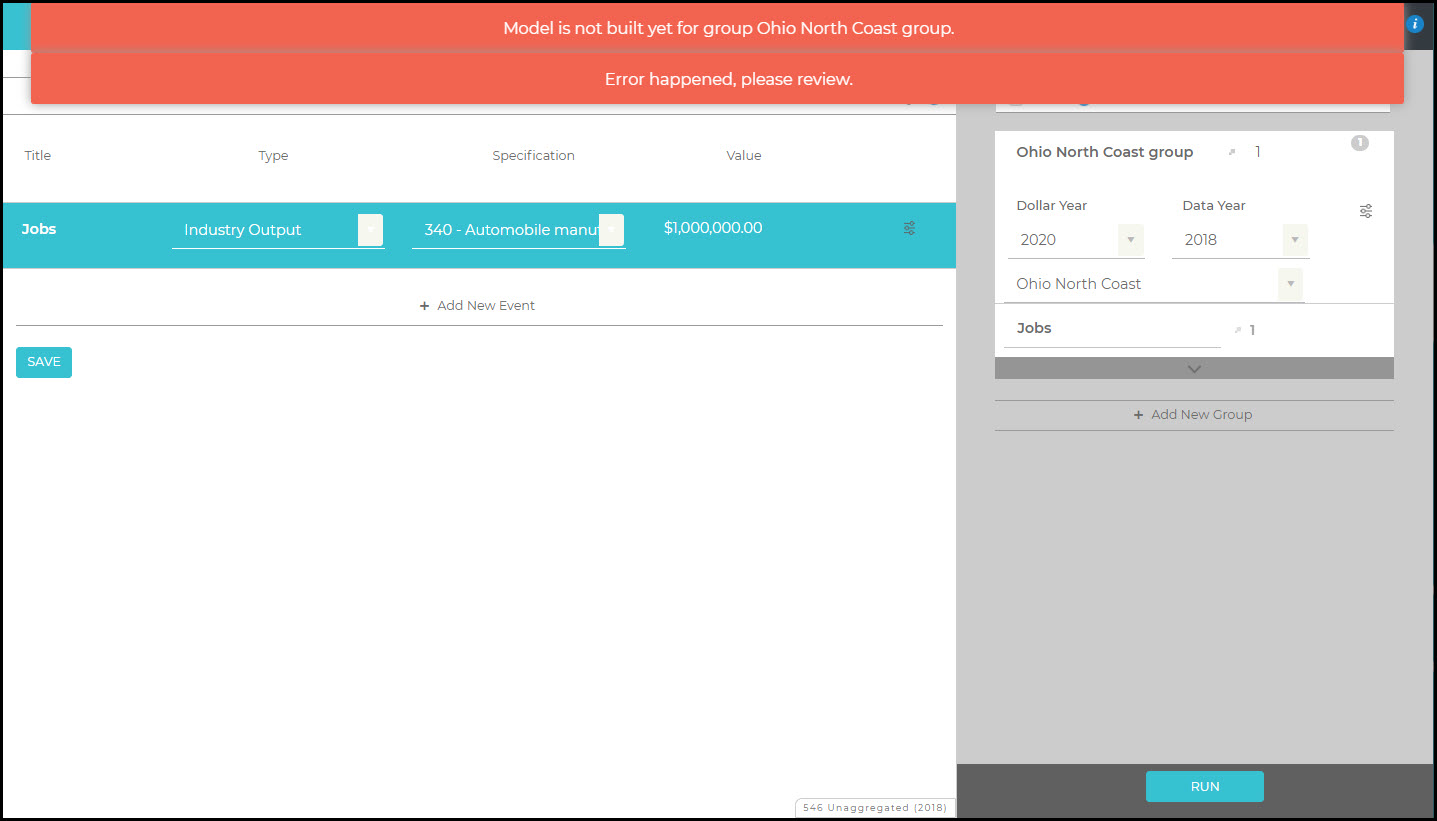
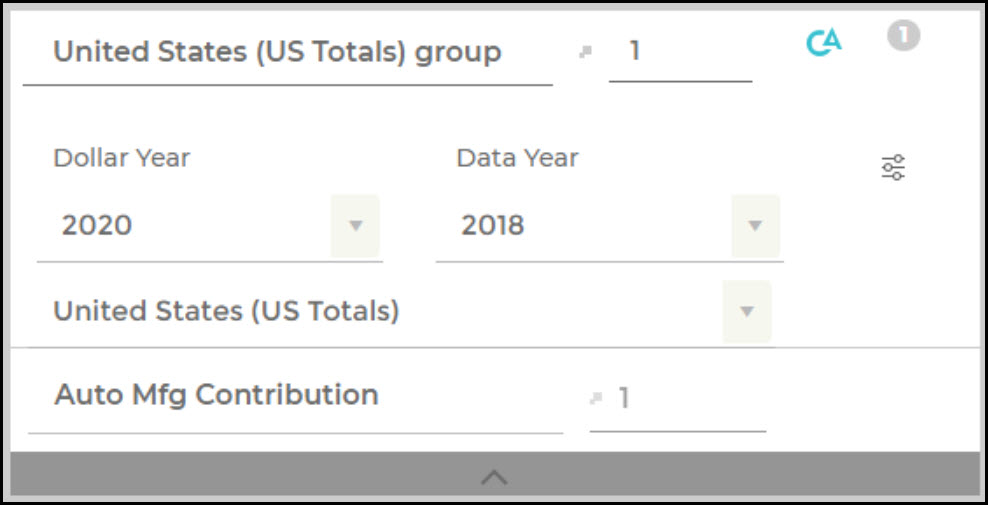
You can also add new Groups from this screen by clicking on “Add New Group.” You will need to give your new Group a title and Select the Region for the blank drop-down menu. Because you can add any Region available to you from the Region field of a Group, this gives you the alternative path of starting your Project directly from the IMPACTS screen when you do not need to access additional features and data available in the REGIONS screen. The Dollar Year will default to the current calendar year and the Data Year will default to the most current year of data available in IMPLAN. You can use the options menu icon to Scale, Duplicate, or Remove Groups.

Getting_Started_-_Impacts_Add_New_Group.jpg

Now that you have your Event all set up in your Group, you are ready to hit RUN! IMPLAN will show how many iterations are Queued, In Progress, and Ready in the box in the lower right corner of your screen. When your analysis is finished, VIEW RESULTS will appear in the lower right. When you click VIEW RESULTS, you will automatically be taken to the RESULTS screen.

EXAMINING YOUR RESULTS:
Your RESULTS screen will default to the Impact Results Overview as shown. You will see the Economic Indicators by Impact, Tax Results, and Top 5 graphs. Scrolling down on the page you will see the Top 15 Industries by Estimated Growth Percentage and a table of Industries by Estimated Growth Percentage.

IMPLAN will default to showing you Results for every Region, Group and Event in the current calendar year Dollar Year. You can change what you see by clicking on FILTERS.

Getting_Started_-_Results_Summary.jpg

You can also dig deeper into the Output, Employment, Value Added, and Tax Results by clicking on the ribbon menu along the top of the screen.

You can see from these results, the economic impact of 1,000 new employees working in Sector 101 – Mayonnaise, dressing, and sauce manufacturing will have a total effect of 2,742.55 jobs, $117.9M in Labor Income, $207.8M in Value Added, and $841.47 in Output in North Carolina in 2019.

Running Your First New Business Impact

INTRODUCTION:
Welcome to IMPLAN and economic impact modeling! This article will guide you through what you need in order to run your first analysis. Good news! You only need to know a few things to get going. While it is true that the more data and information you have, the more accurate your results will be, sometimes you are only given small pieces of information.

BASIC INDUSTRY ANALYSIS:
Setting up your analysis will follow the same steps we all learned in grade school: who, what, where, when, and why. We call this framing. The most basic type of analysis in IMPLAN is an Industry Event for a new business. Here is what you will need to know.

WHO: Which Industry is being affected? Is this a cotton farm or a medical device manufacturing company? Is there new construction involved or just new operations of a business? Construction and operations should always be analyzed and reported individually. There are 546 Sectors in IMPLAN to choose from. Pick the one that most closely matches the business that you want to impact.

WHAT: What is the Value of the change? Is it 100 new jobs or $100M in new Sales? To analyze an Industry Event in IMPLAN, you will need to have at least one (but you can input all four) of the following: Employment, Employee Compensation (fully loaded payroll), Proprietor Income, or Output. Output differs by business type:

Industries that do not hold inventory
Output = sales (revenues)
Manufacturing
Output = sales plus/minus change in inventory
Retail and Wholesale
Output = gross margin (or Marginal Revenue)
WHERE: IMPLAN data is available for Congressional Districts, Zip Codes, counties, Metropolitan Statistical Areas (MSAs), states, and the nation. Answering this should be determined by the Region where your impact is happening and in which regional economy you want to measure the impact.

WHEN: Each analysis in IMPLAN needs to have an associated Dollar Year. This is usually the same as the year in which the economic event you are analyzing occurred or is expected to occur. The default in IMPLAN will be the current year.

Each Region in IMPLAN is associated with a Data Year. The default Data Year will be the most recent Data Year available in IMPLAN which is appropriate for current and future projects. Historical Data Years are also available in IMPLAN when analyzing a past economic event that.

WHY: The last question answers why this Event is being analyzed in the first place. It is often a good idea to start with the why question to help guide you through the other required steps, but sometimes it is also useful to think about this throughout your analysis all the way to reporting the results.

IMPLAN Pro System Requirements

INTRODUCTION:

So you aren’t ready to move to our new platform app.implan.com?  We understand. This article is just for you to ensure that your Pro desktop system keeps running smoothly for you in an ever-changing world of technology.


OPERATING SYSTEM:

At this point, there is no limit on what Windows Operating System is required for IMPLAN Pro.  However, changes may occur that impair the functionality as Windows is continuously being updated.  This is one of the main reasons that we are working hard on our new platform at app.implan.com. 


.NET FRAMEWORK

Software applications require .NET framework to run on Windows. You really don’t need to know anything about this to run IMPLAN, but you may run into an error message that will prompt you to update your .NET framework.  


Pro_Requirements_-_dot_net_error.PNG

So it isn’t really an update, it’s actually kind of a downdate since it requires an older version. Depending on the permissions you may or may not have on your computer, you may need to loop in your IT team.

Use your computer’s Search Bar at the bottom left of your screen to find the “Turn Windows Features On or Off” option in order to activate the older version of .NET Framework

Pro_Requirements_-_features.png

Turn on the version of .Net Framework that was unchecked:.

Pro_Requirements_-_Turn_On.jpg


Now attempt re-downloading the IMPLAN Pro software. If this still gives you issues you may need to consult your IT Team to ensure they can activate .NET Framework 2.0.


FURTHER SUPPORT:

If your version of IMPLAN Pro still isn’t working, please contact your Customer Success Manager at support@implan.com or 800-507-9426.

How to Reset Your IMPLAN Password

CONTENTS

The contents of this tutorial are outlined below. If you already know what you’re looking for, click on a link to advance to a specific section or STEP!

1. Click Change or reset password….
2. Enter your email address.
3. Click SEND EMAIL >.
4. Visit your email inbox.
5. Click click here.
6. Enter your new password.
7. Confirm your new password.
8. Click >.
9. Return to the Log In screen.
10. Log in to IMPLAN.
 

INTRODUCTION

This tutorial is designed to walk you through the process of resetting your IMPLAN password. The procedure begins at the Log in screen (fig. 1) and ends at the IMPLAN Dashboard (fig. 10.a).

Featured_image_-_The_Change_Password_screen.pngFeatured image: The Change Password Screen

SOME BACKGROUND…

Below is a brief discussion about the process of resetting IMPLAN passwords. For more information about credentials, see How to Log In to IMPLAN.

Who is this tutorial for?

This tutorial is for anybody who doesn’t know how to reset their IMPLAN password. Now and then, an IMPLAN user may need to reset their password because they’ve forgotten theirs or would like to change it to something new. Follow THE STEPS herein and you’ll have a new one before you know it.

Why is this process important?

Every single user is required to log in to IMPLAN each time they use the software. To do that, users are required to provide a valid password. So, regardless of why you may need to reset yours, you should know how to do this in order to always maintain the credentials necessary to log in at will.

Do I need anything before I can do this?

Yes. Before you can reset your IMPLAN password, you must first have a password to reset! To acquire valid credentials (a username and password), you must have an active IMPLAN data subscription. To purchase a data subscription, visit IMPLAN.com or contact us directly at (800) 507-9426.

Will I need to do this often?

That’s up to you! The only reason a user should need to reset their password is because they’ve forgotten what theirs is or they’d like to actively change it to something new. So, the frequency with which your IMPLAN password is reset is your choice. If you prefer to change your password every month to increase personal security, IMPLAN grants you that freedom. If you prefer to choose a password, enter it once, and never think about it again, IMPLAN grants you the convenience to set it and forget it. Your credentials can be as close or as far from the forefront of your IMPLAN use as you choose.

THE STEPS

The procedure to reset your IMPLAN password begins at the Log in screen (see fig. 1) and ends at the IMPLAN Dashboard (fig. 10.a). The instructions below include links to other user’s guide tutorials and/or articles which may prove helpful in the event that you encounter any roadblocks during the course of your analysis. If challenges persist, visit the ADDITIONAL RESOURCES section for a more extensive selection of supplementary material.

1. Click Change or reset password….

At the Log in screen, click Change or reset password… (see fig. 1).

Fig._1_-_The_Log_In_screen_-_Change_or_reset_password....pngFig. 1

Upon doing so, you’ll arrive at the Password Reset screen (fig. 1.a).

Fig._1.a_-_The_Password_Reset_screen.pngFig. 1.a

2. Enter your email address.

At the Password Reset screen, click into the empty field that says ‘yours@example.com‘ (see fig. 2) and enter your email address.

Fig._2_-_The_Password_Reset_screen_-_Enter_your_email_address.pngFig. 2

3. Click SEND EMAIL >.

After entering your email address, click SEND EMAIL > (see fig. 3).

Fig._3_-_The_Password_Reset_screen_-_SEND_EMAIL__.pngFig. 3

Upon doing so, you’ll return to the Log in screen and a message that says ‘WE’VE JUST SENT YOU AN EMAIL TO RESET YOUR PASSWORD‘ (see fig. 3.a) will appear.

Fig._3.a_-_The_Log_In_screen_-_Confirmation_of_sent_email_meassage.pngFig. 3.a

4. Visit your email inbox.

Visit the inbox (see fig. 4) for the email address you entered into the Reset Password screen.

Fig._4_-_Email_sign_in_screen_-_Visit_your_email_inbox.pngFig. 4

Upon doing so, you’ll find a new email message from support@IMPLAN.com (fig. 4.a) inside.

Fig._4.a_-_Password_Reset_Request_email.pngFig. 4.a

5. Click click here.

Open the email from support@IMPLAN.com and click the click here link (see fig. 5) in the body of the message.

Fig._5_-_Password_Reset_Request_email_-_Click_click_here.pngFig. 5

Upon doing so, you’ll arrive at the Change Password screen (fig. 5.a).

Fig._5.a_-_The_Change_Password_screen.pngFig. 5.a

6. Enter your new password.

At the Change Password screen, click into the empty field that says ‘your new password‘ (see fig. 6) and enter your new password.

Fig._6_-_The_Change_Password_screen_-_Enter_your_new_password.pngFig. 6

7. Confirm your new password.

After entering your new password, click into the empty field that says ‘confirm your new password‘ and enter it again.

Fig._7_-_The_Change_Password_screen_-_Confirm_your_new_password.pngFig. 7

8. Click >.

After entering and confirming your new password, click > (see fig. 8).

Fig._8_-_The_Change_Password_screen_-_Click__.pngFig. 8

Upon doing so, a prompt will appear (see fig. 8.a) to confirm that your password has been successfully reset.

Fig._8.a_-_Success_prompt_-_Your_password_has_been_reset_successfully.pngFig. 8.a

9. Return to the Log in screen.

After the confirmation prompt appears, return to the Log in screen (fig. 9).

Fig._9_-_The_Log_In_screen.pngFig. 9

10. Log in to IMPLAN.

After returning to the Log in screen, log in to IMPLAN (see fig. 10) to make sure that your new password works. For instructions on logging in, see How to Log in to IMPLAN.

Fig._10_-_The_Log_In_screen_-_LOG_IN__.pngFig. 10

Upon clicking LOG IN >, you’ll arrive at the IMPLAN Dashboard (fig. 10.a).

Fig._10.a_-_The_IMPLAN_Dashboard.pngFig. 10.a

Upon arriving at the IMPLAN Dashboard, you’ll have successfully reset your password!

END OF PROCEDURE

WHAT NEXT?

IMPLAN is designed to allow for analyses to be launched or resumed from multiple points of entry. So, you can choose to start or continue your studies from whichever stage best fits your needs—your process doesn’t have to be linear! However, if you’re brand new to IMPLAN and need some guidance, or would just prefer some professional advice, we’re happy to offer our suggestion about what to do next.

WHAT WOULD IMPLAN DO?

If you’re performing your very first impact analysis, then after logging in to IMPLAN, we suggest becoming familiar with the IMPLAN Dashboard. The IMPLAN Dashboard is a streamlined location from which you can visit many of IMPLAN’s most important screens and serves as a “hub” from which to launch or resume studies in the tool. If you feel like familiarizing yourself with the IMPLAN Dashboard is the right “first step” for your study, the resource below may help you become comfortable maneuvering it.

ADDITIONAL RESOURCES

Below are some additional resources which may prove helpful when formulating a personalized itinerary for your study.

ARTICLES & TUTORIALS

Related to:  Credentials

  • For instructions on logging in, see How to Log in to IMPLAN.
  • For instructions on resetting passwords, see How to Reset Your IMPLAN Password.

Related to:  IMPLAN Dashboard

Related to:  Regions

Related to:  Events

Related to:  Groups

Related to:  Running analyses

Related to:  Results

Related to:  Projects

How to Create a Group

CONTENTS

The contents of this tutorial are outlined below. If you already know what you’re looking for, click on a link to advance to a specific section or STEP!

1. Click + Add New Group.
2. Name your new Group.
3. Select a Dollar Year.
4. Select a Data Year.
5. Choose a selected Region.
 

INTRODUCTION

This tutorial is designed to walk you through the process of creating a Group in IMPLAN. The procedure begins and ends at the IMPACTS screen (featured image).

Featured_image_-_The_IMPACTS_screen.pngFeatured image: The IMPACTS Screen

SOME BACKGROUND…

Below is a brief discussion about the process of creating Groups in IMPLAN.

Who is this tutorial for?

This tutorial is for anybody who doesn’t know how to create a Group in IMPLAN. Groups provide the tool with specific details about the regional economy in which your study’s real-life event will occur and are essential in enabling it to calculate your impact results. Follow THE STEPS herein to delve into one of the simplest (but most crucial!) tasks in any analysis with IMPLAN: creating Groups.

Why is this process important?

Groups play a central role in enabling IMPLAN to calculate your study’s impact results because they provide a mathematical context in which to consider the contents of your study’s Events. While Events are uniquely representative of the real-life economic activity your study’s analyzing, Groups are uniquely representative of the economy in which that activity will take place. Understandably, IMPLAN can’t estimate the economic effects of a given real-world occurrence without first knowing what the condition of the economy in which it occurred was prior to it occurring. So, Groups provide the tool with mathematical “snapshots” of regional economies in order to lay a foundation upon which to carry out the tough number-crunching that delivers your study’s results. For this reason, you’ll need to know how to create them in order to see your own analyses through to completion.

Do I need anything before I can do this?

At first, yes. But later, no. What we mean is, the very first time you create a Group in IMPLAN, you’ll need to have already successfully selected at least one Region in the tool. Otherwise, there won’t be any preformed regional economic models in it for you to populate your Group with. But, after selecting any Region just one time, it will become available for you to insert into any Group you create from that point on. So, as you continue to use IMPLAN over time—conducting more and more analyses, examining more and more regional economies, compiling an increasingly diversified collection of selected Regions—creating Groups will become easier and easier!

Will I need to do this often?

Yes. The same as with creating Events, analysts performing true impact analyses (that is, modeling the effects of a given change in production) will need to use Groups in order for the tool to calculate their study’s results. However, as is explained above, creating Groups in IMPLAN becomes easier over time because as your use of the tool continues, the growing collection of saved Regions inside it remains available to you when populating your Groups. Honestly, while creating Groups is just as important to the overall success of your study as selecting Regions or creating Events, it’s by far the easiest of the three procedures. You’ll be fine—seriously, it’s a cinch.

THE STEPS

The procedure to create a Group in IMPLAN begins and ends at the IMPACTS screen (see featured image). The instructions below include links to other user’s guide tutorials and/or articles which may prove helpful in the vent that you encounter any roadblocks during the course of your analysis. If challenges persist, visit the ADDITIONAL RESOURCES section for a more extensive selection of supplementary material.

1. Click + Add New Group.

At the IMPACTS screen, click + Add New Group (see fig. 1) in the Groups section.

Fig._1_-_The_Groups_section_-_Click___Add_New_Group.pngFig. 1

Upon doing so, a box of editable fields will appear (see fig. 1.a). To learn about the contents of the Groups section, see Exploring the IMPACTS Screen.

Fig._1.a_-_The_Groups_section_-_Editable_fields_box.jpgFig. 1.a

2. Name your new Group.

Inside the Groups section, click into the “Group title” field (see fig. 2) and enter the name of your new Group.

Fig._2_-_The_Groups_section_-_Name_your_new_Group.pngFig. 2

3. Select a Dollar Year.

After naming your new Group, click into the Dollar Year menu (see fig. 3) and select a year from its dropdown list. By default, it will populate with the current year.

Fig._3.a_-_The_Groups_section_-_Opened_Dollar_Year_menu.pngFig. 3

4. Select a Data Year.

After selecting a Dollar Year, click into the Data Year menu (see fig. 4) and select a year from its dropdown list. By default, it will populate with the year of the most current IMPLAN dataset available.

Fig._4.a_-_The_Groups_section_-_Opened_Data_Year_menu.pngFig. 4

5. Choose a selected Region.

After selecting a Data Year, click into the Region menu (see fig. 5) and choose a selected Region from its dropdown list. You must select a Data Year before IMPLAN will allow you to choose a selected Region.

Fig._5.a_-_The_Groups_section_-_Opened_Region_menu.pngFig. 5

Alternatively, you can bypass scrolling through the dropdown list and choose a selected Region by entering it’s name directly into the search bar (see fig. 5.a) at the top of the opened menu.

Fig._5.a_-_The_Groups_section_-_The_Region_menu_search_bar.jpgFig. 5.a

To “scale” the contents of your Group (multiply them proportionally during the calculation of impact results), click into the “Group scaling factor” field (see fig. 5.b) and customize it to your liking.

Fig._5.b_-_The_Groups_section_-_The_Group_scaling_factor.jpgFig. 5.b

Upon doing so, the scaling icon will appear blue (see fig. 5.c) at the top of the Group.

Fig._5.c_-_The_Groups_section_-_The_Group_scaling_factor_customized.jpgFig. 5.c

After choosing a selected Region, you’ll have successfully created a Group!

END OF PROCEDURE

WHAT NEXT?

IMPLAN is designed to allow for analyses to be launched or resumed from multiple points of entry. So, you can choose to start or continue your studies from whichever stage best fits your needs—your process doesn’t have to be linear! However, if you’re brand new to IMPLAN and need some guidance, or would just prefer some professional advice, we’re happy to offer our suggestion about what to do next.

WHAT WOULD IMPLAN DO?

If you’re performing your first impact analysis, then after creating a Group, we suggest officially running your analysis by initiating the calculation of your study’s impact results by the tool. This procedure occurs on the IMPACTS screen. If you feel like running your analysis is the right “next step” for your study, the resources below will a.) help you continue becoming comfortable maneuvering the IMPACTS screen and b.) guide you, step by step, through the process of actually running your analysis.

ADDITIONAL RESOURCES

Below are some additional resources which may prove helpful when formulating a personalized itinerary for your study.

ARTICLES & TUTORIALS

Related to:  Credentials

Related to:  IMPLAN Dashboard

Related to:  Regions

Related to:  Events

Related to:  Groups

  • To learn about the contents of the Groups section, see Exploring the IMPACTS Screen.
  • For instructions on creating Groups in IMPLAN, see How to Create a Group.

Related to:  Running analyses

Related to:  Results

Related to:  Projects

How to Create an Event

CONTENTS

The contents of this tutorial are outlined below. If you already know what you’re looking for, click on a link to advance to a specific section or STEP!

1. Click + Add New Event.
2. Name your new Event.
3. Select a Type.
4. Select a Specification.
5. Enter a Value.
6. Click SAVE.
 

INTRODUCTION

This tutorial is designed to walk you through the process of creating an Event in IMPLAN. The procedure begins and ends at the IMPACTS screen (featured image).

Featured_image_-_The_IMPACTS_screen.pngFeatured image: The IMPACTS Screen

SOME BACKGROUND…

Below is a brief discussion about the process of creating Events in IMPLAN.

Who is this tutorial for?

This tutorial is for anybody who doesn’t know how to create an Event in IMPLAN. Events are used to communicate the details of your study’s real-life event to the tool and are essential in enabling it to calculate results. Follow THE STEPS herein to conquer one of the primary tasks in bringing IMPLAN’s most robust analytical capabilities to life: creating Events.

Why is this process important?

An Event is arguably the most important element of any impact analysis performed with IMPLAN. When estimating the effects of real-life economic activity, IMPLAN relies on Events to communicate the unique quantitative characteristics of that activity so it can apply them to preformed computerized models of the regional economies in which it’ll occur. In this way, the tool is able to mathematically mix-and-match Events with a wide array of economic models and provide you with the most exhaustive impact results in the game. Trust us, if there’s one thing in IMPLAN that you really want to put in the time to learn inside and out, this is that thing.

Do I need anything before I can do this?

Well, kind of. Events can literally be created in the software with little to no preparation on the part of the analyst. But, without any data pertinent to the real-life economic activity your study is analyzing, the value or utility of that Event is negligible. Yes, the tool’s extremely powerful—so much so, in fact, that it can even calculate impact results using as few as just one data point from an analyst. However, the less you tell IMPLAN about a given event, the less it knows. And the less it knows, the more it has to assume. And the more it has to assume, the less reliable its results can ultimately be in providing insights into that event’s economic impact. So, it’s always best to provide IMPLAN with as much information about your study’s real-life event as you possibly can if you want the most valuable results possible in return.

Will I need to do this often?

Yes. We’ve established that Events in IMPLAN represent real-life economic activity occurring out in the world. So naturally, most Events you create in the tool will decrease in value over time thanks to the ever-changing nature of both people and economies. Given that Events are only as helpful as they are relevant, you’ll likely need to create new ones frequently in order to ensure that they most accurately reflect the current state of the economic activity your study’s analyzing.

THE STEPS

The procedure to create an Event in IMPLAN begins and ends at the IMPACTS screen (see featured image). The instructions below include links to other user’s guide tutorials and/or articles which may prove helpful in the event that you encounter any roadblocks during the course of your analysis. If challenges persist, visit the ADDITIONAL RESOURCES section for a more extensive selection of supplementary material.

1. Click + Add New Event.

At the IMPACTS screen, click + Add New Event (see fig. 1) in the Events section.

Fig._1_-_The_Events_section_-_Click___Add_New_Event.pngFig. 1

Upon doing so, a box of editable fields will appear (see fig. 1.a). To learn about the contents of the Events section, see Exploring the IMPACTS Screen.

Fig._1.a_-_The_Events_section_-_Editable_fields_box.pngFig. 1.a

2. Name your new Event.

Inside the Events section, click into the Title field (see fig. 2) and enter the name of your new Event.

Fig._2_-_The_Events_section_-_Name_your_new_Event.pngFig. 2

3. Select a Type.

After naming your new Event, click into the Type menu (see fig. 3) and select an Event Type from its dropdown list.

Fig._3_-_The_Events_section_-_Select_a_Type.pngFig. 3

Alternatively, you can bypass scrolling through the dropdown list and locate an Event Type immediately by entering its name directly into the search bar (see fig. 3.a) at the top of the opened menu.

Fig._3.a_-_The_Events_section_-_The_Type_menu_search_bar.jpgFig. 3.a

4. Select a Specification.

After selecting a Type, click into the Specification menu (see fig. 4) and select an option from its dropdown list. The options available will vary depending on which Event Type you selected from the Type menu. To learn about the contents of the Specification menu, see Exploring the IMPACTS Screen.

Fig._4_-_The_Events_section_-_Select_a_Specification.pngFig. 4

Alternatively, you can bypass scrolling through the dropdown list and locate an available option immediately by entering its name directly into the search bar (see fig. 4.a) at the top of the opened menu.

Fig._4.a_-_The_Events_section_-_The_Specification_menu_search_bar.jpgFig. 4.a

5. Enter a Value.

After selecting a Specification, click into the Value field (see fig. 5) and enter a data point from your study’s real-life event that’s relevant to the selections you made in the Type and Specification menus.

Fig._5_-_The_Events_section_-_Enter_a_Value.pngFig. 5

To continue populating your Event with details from your study’s real-life event, click the “Additional Options” menu (see fig. 5.a) and select Advanced from its dropdown list.

Fig._5.a_-_The_Events_section_-__Additional_Options_.jpgFig. 5.a

Upon doing so, more editable fields will appear (see fig. 5.b) inside the Events section.

Fig._5.b_-_The_Events_section_-_Expanded_editable_fields_box.pngFig. 5.b 

6. Click SAVE.

After populating your Event, click SAVE (see fig. 6). Upon doing so, your Event will be saved inside the Project you’re working in.

Fig._6_-_The_Events_section_-_Click_SAVE.pngFig. 6

After clicking SAVE, you’ll have successfully created an Event!

END OF PROCEDURE

WHAT NEXT?

IMPLAN is designed to allow for analyses to be launched or resumed from multiple points of entry. So, you can choose to start or continue your studies from whichever stage best fits your needs—your process doesn’t have to be linear! However, if you’re brand new to IMPLAN and need some guidance, or would just prefer some professional advice, we’re happy to offer our suggestion about what to do next.

WHAT WOULD IMPLAN DO?

If you’re performing your very first impact analysis, then after creating an Event, we suggest creating a Group to provide IMPLAN with specific details about the regional economy in which your study’s real-life event will occur. The same as with creating Events, the procedure for creating Groups occurs on the IMPACTS screen. If you feel like creating a Group is the right “next step” for your study, the resources below may a.) help you continue becoming comfortable maneuvering the IMPACTS screen and b.) guide you, step by step, through the process of actually creating a Group.

ADDITIONAL RESOURCES

Below are some additional resources which may prove helpful when formulating a personalized itinerary for your study.

ARTICLES & TUTORIALS

Related to:  Credentials

Related to:  IMPLAN Dashboard

Related to:  Regions

Related to:  Events

  • To learn about the contents of the Events section, see Exploring the IMPACTS Screen.
  • For instructions on creating Events in IMPLAN, see How to Create an Event.

Related to:  Groups

Related to:  Running analyses

Related to:  Results

Related to:  Projects

How to Select a Region

CONTENTS

The contents of this tutorial are outlined below. If you already know what you’re looking for, click on a link to advance to a specific section or STEP!

1. Click REGIONS.
2. Locate and click a geography.
3. Click CREATE IMPACT.
4. Name your new Project.
5. Click SAVE.
 

INTRODUCTION

This tutorial is designed to walk you through the process of selecting a Region in IMPLAN. The procedure begins at the IMPLAN Dashboard (see fig. 1) and ends at the IMPACTS screen (fig. 5.a).

Featured_image_-_The_REGIONS_screen.pngFeatured image: The REGIONS Screen

SOME BACKGROUND…

Below is a brief discussion about the process of selecting Regions in IMPLAN.

Who is this tutorial for?

This tutorial is for anybody who doesn’t know how to select a Region in IMPLAN. IMPLAN can’t calculate impact results without first knowing the specific regional economy in which your study’s real-life event will occur. So, every time you conduct an impact analysis with IMPLAN, you’ll need to tell it where your study’s event will take place by selecting a Region. Thankfully, IMPLAN makes this extremely easy to do by offering a large interactive map which lets you complete the process visually. So, selecting a Region is not only easy, but fast! Follow THE STEPS herein and you’ll master selecting Regions in a matter of minutes.

Why is this process important?

If you’re looking to run an actual impact analysis with IMPLAN, then there’s just no way around selecting Regions. That said, not every analysis performed with IMPLAN is a full-blown impact analysis. Some analysts simply use IMPLAN to compare the regional economic profiles of different locations to one another; no calculations needed! Other analysts choose to introduce IMPLAN into their day-to-day operations in order to have heaps of comprehensive regional economic data within arm’s reach at all times. But, if you’re interested in going a step further and actually estimating the economic “ripple effects” of a given event throughout a geography, then you’re talking about true impact analysis. And for that, the tool has to first know which regional economy to focus on. So, if you ever want to take full advantage of IMPLAN’s awesome analytical power, you’ll need to know how to select a Region.

Do I need anything before I can do this?

Nope. Aside from simply knowing the regional economy in which your study’s real-life event will occur, you don’t need to “bring anything to the table” in order to select a Region in IMPLAN. In fact, the tool’s so versatile that it can even allow you to begin your study without definitively knowing that yet. But, if we’re getting technical (which, of course, we are—it’s kind of our thing), then in order to complete the specific procedure described in this tutorial, you’ll need to at least have some desired regional economy in mind.

Will I need to do this often?

Yes. Isolating regional economies is a fundamental component of all impact analyses, so every time you use IMPLAN to conduct one yourself, you’ll need to tell it which economy you’re studying. However, in spite of this, when you choose to select a Region is completely up to you and can be carried out at any time during your process. Perhaps you prefer to complete all your study’s research and data collection first, and then wait until some point down the road to select an official Region? Okay. Perhaps every time you take on a new assignment, you prefer to immediately log in, select a Region, and then save it so you can revisit it later when you’re done researching and collecting? Okay. Either way, regardless of your preference, IMPLAN’s answer is, “Yes”.

THE STEPS

The procedure to select a Region in IMPLAN begins at the IMPLAN Dashboard (see fig. 1) and ends at the IMPACTS screen (fig. 5.a). The instructions below include links to other user’s guide tutorials and/or articles which may prove helpful in the event that you encounter any roadblocks during the course of your analysis. If challenges persist, visit the ADDITIONAL RESOURCES section for a more extensive selection of supplementary material.

1. Click REGIONS.

At the IMPLAN Dashboard, click REGIONS (see fig. 1).

Fig._1_-_REGIONS.pngFig. 1

Upon doing so, you’ll arrive at the REGIONS screen (fig. 1.a).

Featured_image_-_The_REGIONS_screen.jpgFig. 1.a

2. Locate and click a geography.

At the REGIONS screen, locate the geography in which your study’s real-life event will occur and select it by clicking it on the map (see fig. 2).

Fig._2_-_Selected_geography.pngFig. 2

Alternatively, you can bypass the map tool altogether and locate and click a geography by entering its name directly into the Regions search bar (see fig. 2.a). To learn about the map tool and/or the Regions search bar, see Exploring the REGIONS Screen.

Fig._2.a_-_Regions_search_bar__geography_located_in_dropdown_.jpgFig. 2.a

3. Click CREATE IMPACT.

In the Selected Regions section, click CREATE IMPACT (see fig. 3).

Fig._3_-_CREATE_IMPACT.pngFig. 3

Upon doing so, the Name New Project prompt will appear (see fig. 3.a).

Fig._3.a_-_Name_New_Project_prompt.jpgFig. 3.a

4. Name your new Project.

At the Name New Project prompt, click into the empty field that says ‘Enter Project Name Here‘ and enter the name of your new Project (see fig. 4).

Fig._4_-_Name_New_Project_prompt_populated.jpgFig. 4

5. Click SAVE.

After naming your new Project, click SAVE (see fig. 5).

Fig._5_-_SAVE.jpgFig. 5

Upon doing so, you’ll automatically be redirected to the IMPACTS screen (fig. 5.a).

Fig._5.a_-_The_IMPACTS_Screen.pngFig. 5.a

Upon arriving at the IMPACTS screen, you’ll have successfully selected a Region!

END OF PROCEDURE

WHAT NEXT?

IMPLAN is designed to allow for analyses to be launched or resumed from multiple points of entry. So, you can choose to start or continue your studies from whichever stage best fits your needs—your process doesn’t have to be linear! However, if you’re brand new to IMPLAN and need some guidance, or would just prefer some professional advice, we’re happy to offer our suggestion about what to do next.

WHAT WOULD IMPLAN DO?

If you’re performing your very first impact analysis, then after selecting a Region, we suggest creating an Event to communicate the details of your study’s real-life event to the tool. This procedure occurs on the IMPACTS screen. If you feel like creating an Event is the right “next step” for your study, the resources below may a.) help you become comfortable maneuvering the IMPACTS screen and b.) guide you, step by step, through the process of actually creating an Event.

ADDITIONAL RESOURCES

Below are some additional resources which may prove helpful when formulating a personalized itinerary for your study.

ARTICLES & TUTORIALS

Related to:  Credentials

Related to:  IMPLAN Dashboard

Related to:  Regions

  • To learn about the contents of the REGIONS screen, see Exploring the REGIONS Screen.
  • For instructions on selecting Regions in IMPLAN, see How to Select a Region.

Related to:  Events

Related to:  Groups

Related to:  Running analyses

Related to:  Results

Related to:  Projects