A grouping of one or more Events that represents a related spending change within the Study Area. Six types of Activities are available, falling into three main categories: production by industry (Industry, Construction, Retail), production of goods & services (Commodity), and institutional spending. (Household, Labor Income).
Accumulation accounts are flow accounts that record the acquisition and disposal of financial and non-financial assets and liabilities by institutional units through transactions or as a result of other events. (SNA)
An account is a tool which records, for a given aspect of economic life, (a) the uses and resources or (b) the changes in assets and the changes in liabilities and/or (c) the stock of assets and liabilities existing at a certain time; the transactions accounts include a balancing item which is used to equate the two sides of the accounts (e.g. resources and uses) and which is a meaningful measure of economic performance in itself. (SNA)
Hospitals that are not privately owned fall into two categories: public/government owned facilities and non profit organizations. Modeling the economic impacts of these two types of hospitals follow the same path in IMPLAN as neither will pay the full tax rate of a private hospital. This article will help you unpack the best way to model your public or nonprofit hospital or system of hospitals.
DETAILED INFORMATION
If you are only given a small amount of information, sometimes an Industry Event will suffice. Usually however, correctly modeling public (government run) and nonprofit hospitals involves following a method known as Analysis-by-Parts (ABP). This method splits the effects on an institution into its individual components: labor spending and operations spending.
There is a Industry in IMPLAN specifically for hospitals; Industry 490 – Hospitals is made up of both private and nonprofit hospitals. Employment and payroll at public hospitals actually fall under Industry 540 – * Employment and payroll of state govt, hospitals and health services. However, in terms of tax liability, public and nonprofit hospitals are very similar. Therefore these types of institutions can be modeled in the same way with reductions in tax payments.
THE PROCESS USING PAYROLL
Sometimes we are given very little information from which to model the economic impacts. The following example assumes that we only know the total payroll.
Tombstone Hospital System, a nonprofit, regional healthcare system, is located in Cochise County, Arizona and we want to find out their impact on the entire state. They have 500 employees with a payroll of $55M. Given that we do not know any information about the other expenditures Tombstone Hospital System is making, we will have IMPLAN estimate these for us using the regional detail in the model.
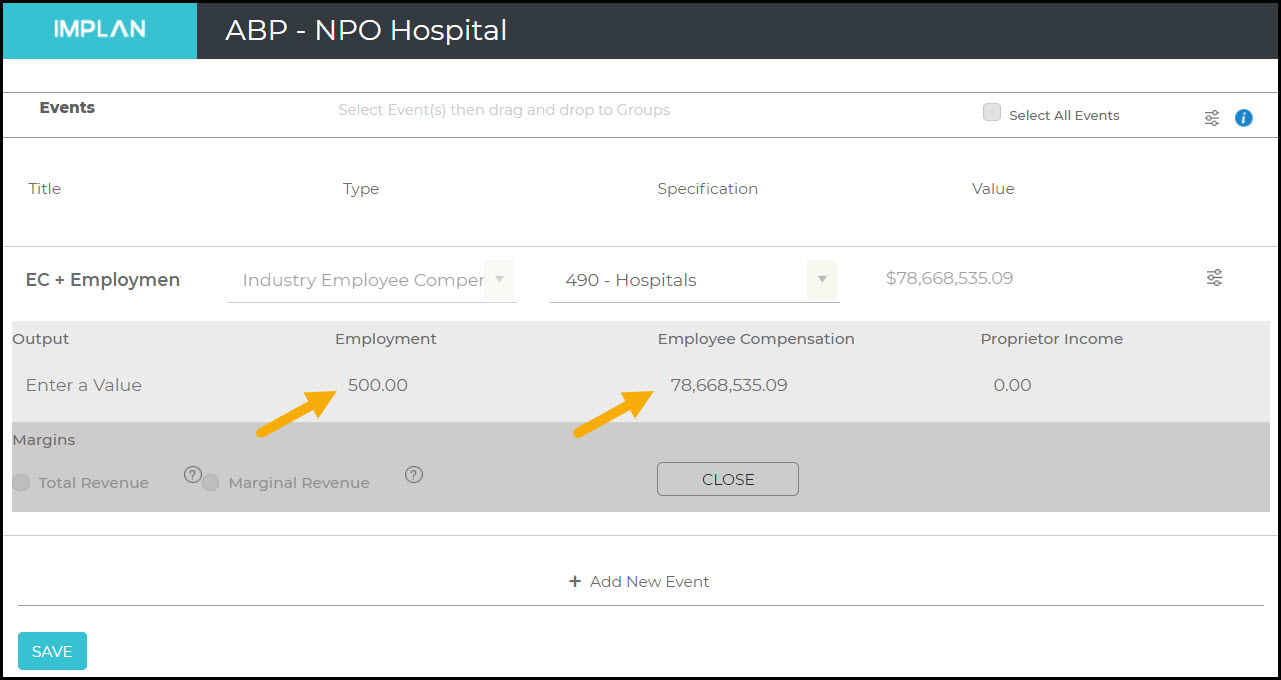
The first thing we need to figure out is what is included in the payroll figure. Wages and salaries need to be converted to Employee Compensation values for IMPLAN. Employee Compensation is the total cost of payroll: wages and salaries, plus benefits and payroll taxes. To convert payroll figures to EC, use the template IMPLAN to FTE Conversions. Using this document, we see that the ratio of wages to EC for Industry 540 is 1.43033700172487. So we can multiply our $55M in payroll by 1.43033700172487 to yield an EC of $78,668,535.09.
If you have a count of full-time employees or full-time equivalent employment (FTE), you will need to adjust those figures as well. In IMPLAN, employment is based on headcount, not an FTE figure. This conversion is done using the same spreadsheet.
On the Events screen, we create an Industry Employee Compensation Event in Industry 490 – Hospitals for $67,434,348. By clicking the Advanced menu button, we can add our 500 employees to this Event as shown. If you do not know the total employment, just leave it blank.
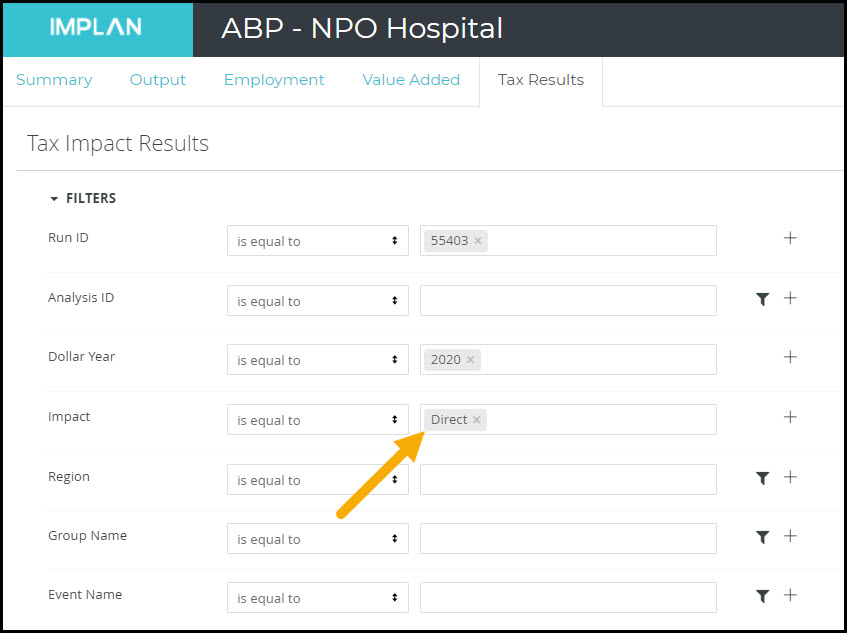
Now we drag our Event into our Group on the right side of the screen and hit Run. On our Results screen, we will have to make a few changes to ensure that our hospital is not showing payments to taxes that public and nonprofit hospitals are not required to pay. On the Tax Results tab, filter for Direct Taxes and click Run.
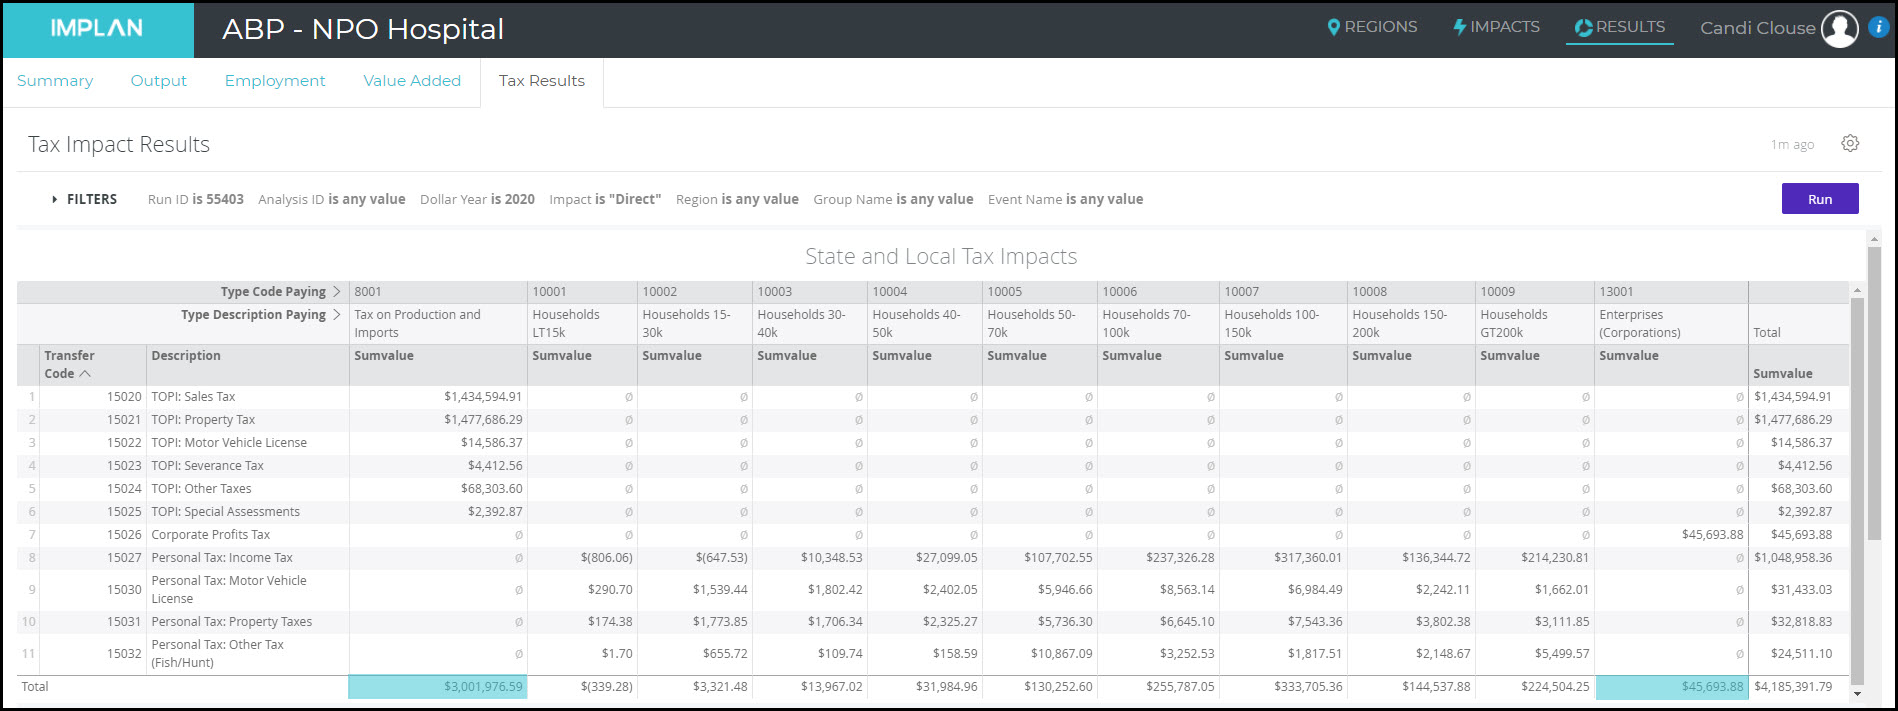
Now, add up the Tax on Production & Imports and Enterprises (Corporations) columns for both the State & Local and Federal taxes; these will not be counted in this impact. You can use the template ABP – Removing Direct Taxes to fill in your data.
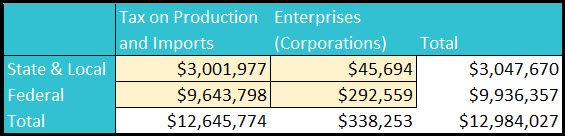
Copy these numbers into the yellow boxes in the template.
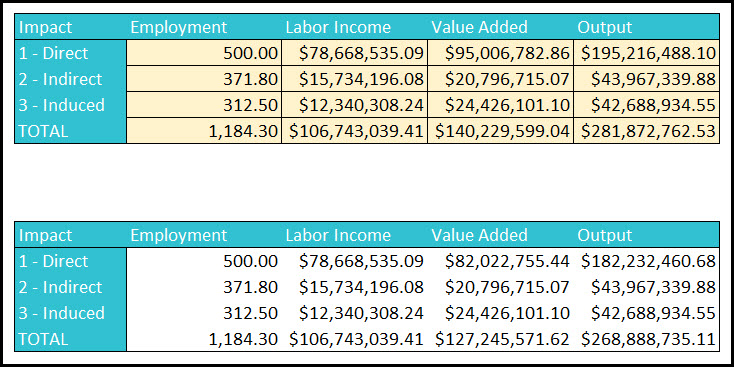
Next, copy your summary results into the template. This will then give you Results that omit the Direct TOPI and Enterprise payments from Value Added and Output.
Thus, our results show Tombstone Hospital’s 500 employees and $500M in payroll supports 1,184 jobs, $106.7M in Labor Income, $127.2M in Value Added, and $268.9M in Output.
THE PROCESS USING REVENUE
The more information we have for our economic impact analysis, the stronger the results will be. If on top of employment and payroll, we also know spending either in total or by line item for other things that our hospital needs to function, we can enter them into IMPLAN using Analysis-by-Parts (ABP).
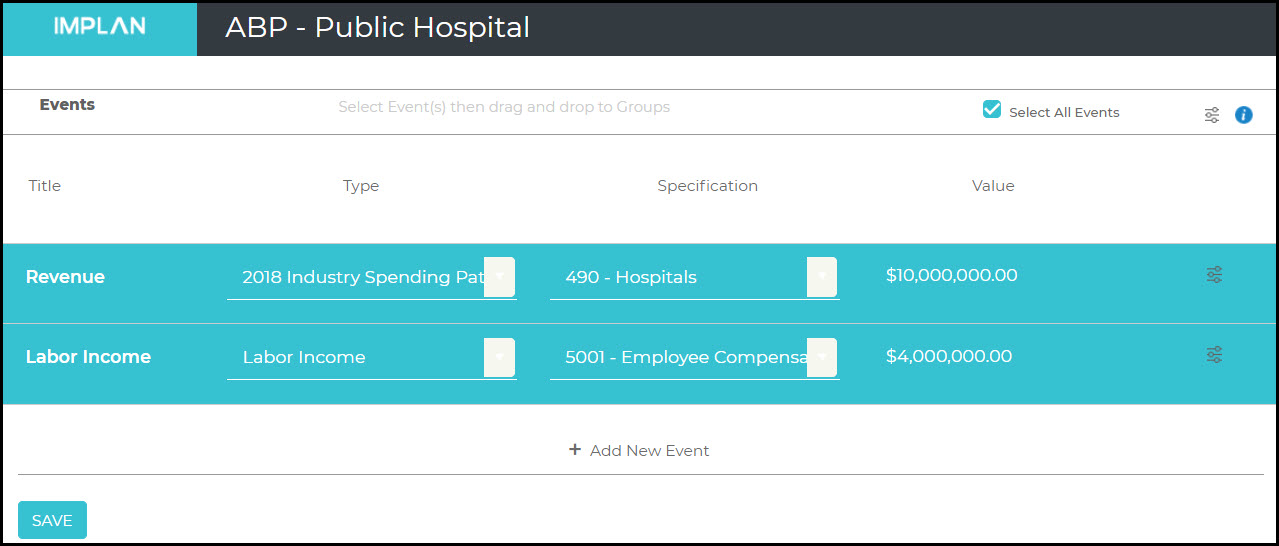
Band Aid is a proposed city hospital in Charlotte, NC. We are told that they will have $10M in revenue and $4M in Employee Compensation and we want to model their proposed economic impact on the local economy. Because the county will own the hospital, they will not be taxed in the same way as private hospitals.
Choose an Industry Spending Pattern Event in the Impacts screen
Select Industry 490 – Hospitals under Specification
Enter $10,000,000 under the Value
On the Advanced Menu, the default Value should be the total dollars spent on Intermediate Expenditures (Intermediate Inputs) – this should be switched to Output as we know total proposed Revenue
STEP 2 – INDUCED EFFECTS AS A RESULT OF LABOR INCOME
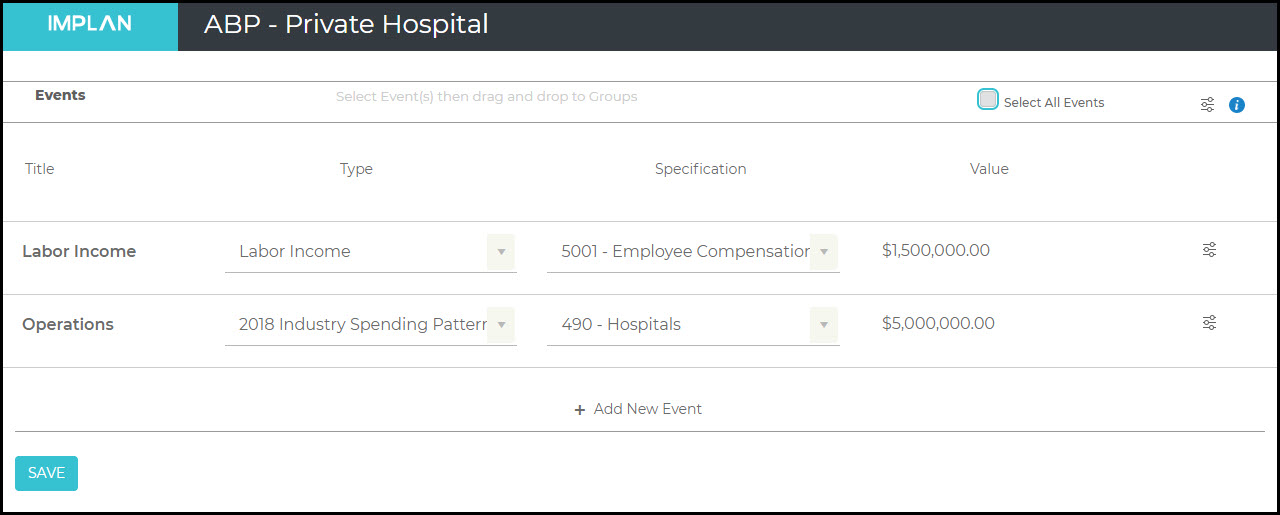
Create a new Event for Labor Income
Choose Employee Compensation for the Specification with a Value of $4M
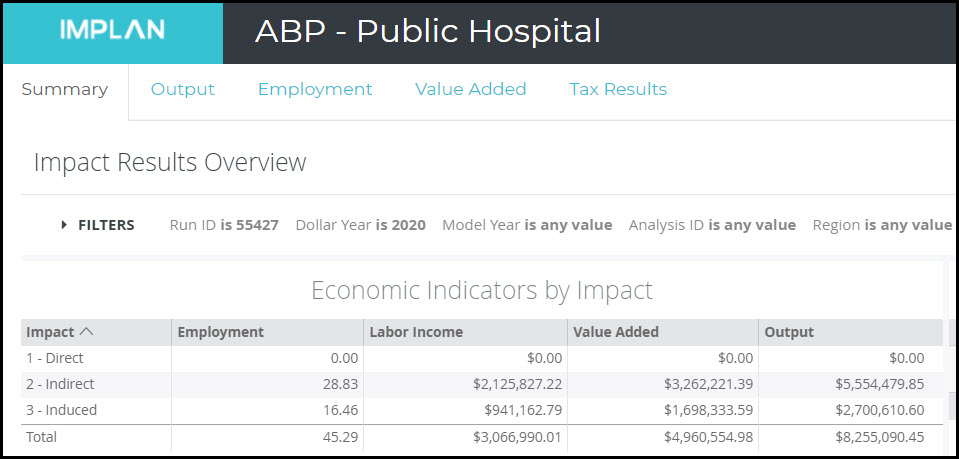
STEP 3 – RUN THE ANALYSIS
Now that we have these two Events, we can hit Run on our analysis.
The first thing we can see in the Results is that there is no Direct Effect.
STEP 4 – DIRECT EFFECTS
To figure out the Direct Effects we will need to add in, we will need to download the summary Results into Excel. You can use the template ABP – Recalculating Directs to fill in your data.
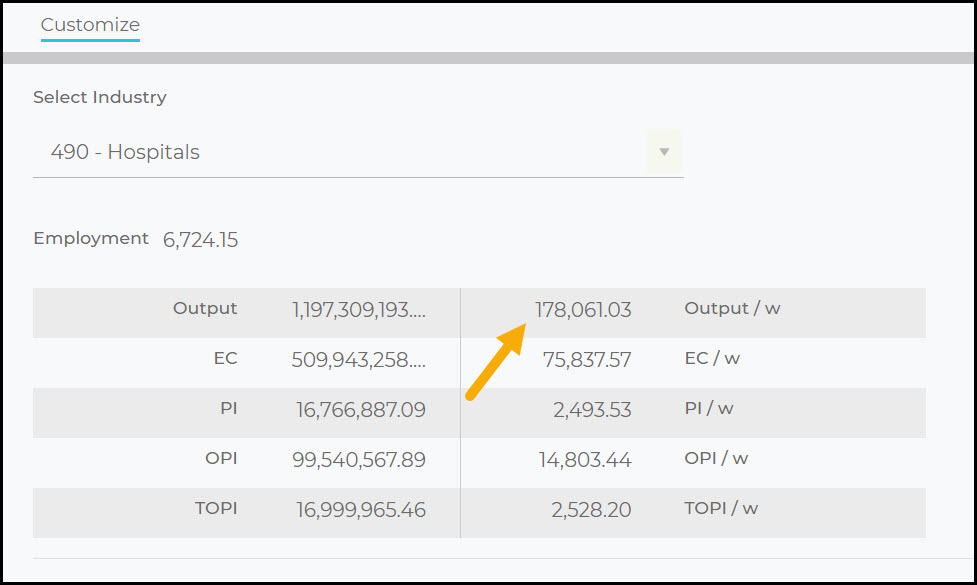
If not all the Direct factors are known, estimates of these factors can be made from the underlying Study Area Data using the information found on the Regions screen by clicking on the information button and then clicking on the Advanced Menu and selecting Customize Region
Select Industry 490 – Hospitals
Record the Output/Worker (and if required the TOPI/Worker and OPI/Worker) values the Excel template
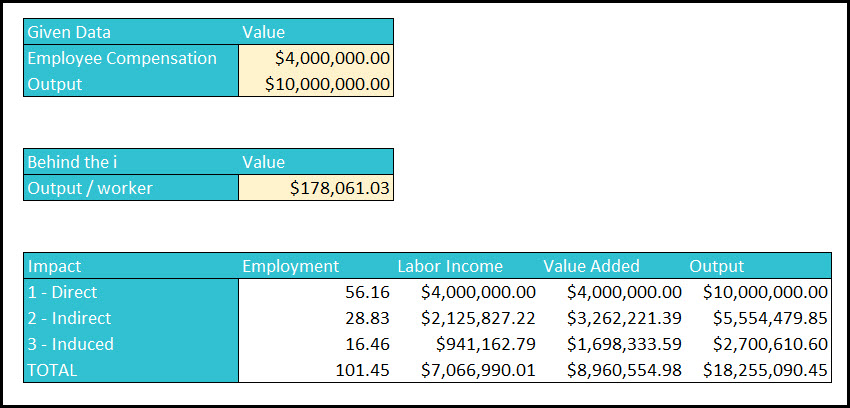
Using the data given to us from the county ($10M in Revenue (Output) and $4M in Labor Income) and the Output/Worker, we can enter in all of the missing data as shown here.
GOVERNMENT SUBSIDIES & GRANTS
Public and nonprofit organizations that receive part or all of their funding through government subsidies like Medicare and Medicaid will have negative results in TOPI. Also, the Direct Labor Income will be larger than the direct Value Added because this money is considered to be a negative tax value (a negative component of Value Added). If they receive the entirety of their funding through subsidies, then their Value Added will be negative. If this subsidy or grant is large enough, Labor Income can also be larger than Output. In fact, if the government foots the bill for the entirety of the hospital, the direct Output will be zero (because of the large negative TOPI).
If the hospital you are modeling is private, you can simply model spending through Industry 490 – Hospitals. As always, enter as much data for the Industry Event as you have (Output, Employee Compensation, Proprietor Income, and/or Employment). If you have data for more than one of these elements, you can (and should) override IMPLAN’s estimates with your known values.
You can also modify the Industry Spending Pattern and couple that with a Labor Income change to account for any known spending differences in the hospital you are modeling. This technique is known as Analysis-by-Parts (ABP).
EXAMPLE
Let’s say a new private hospital is going to open in Mecklenburg County. We are told they will spend $5M in operations and $1.5M in Employee Compensation (EC) in their first year. We have no information about Proprietor Income (PI), so we will only enter EC. Remember, Labor Income = EC + PI.
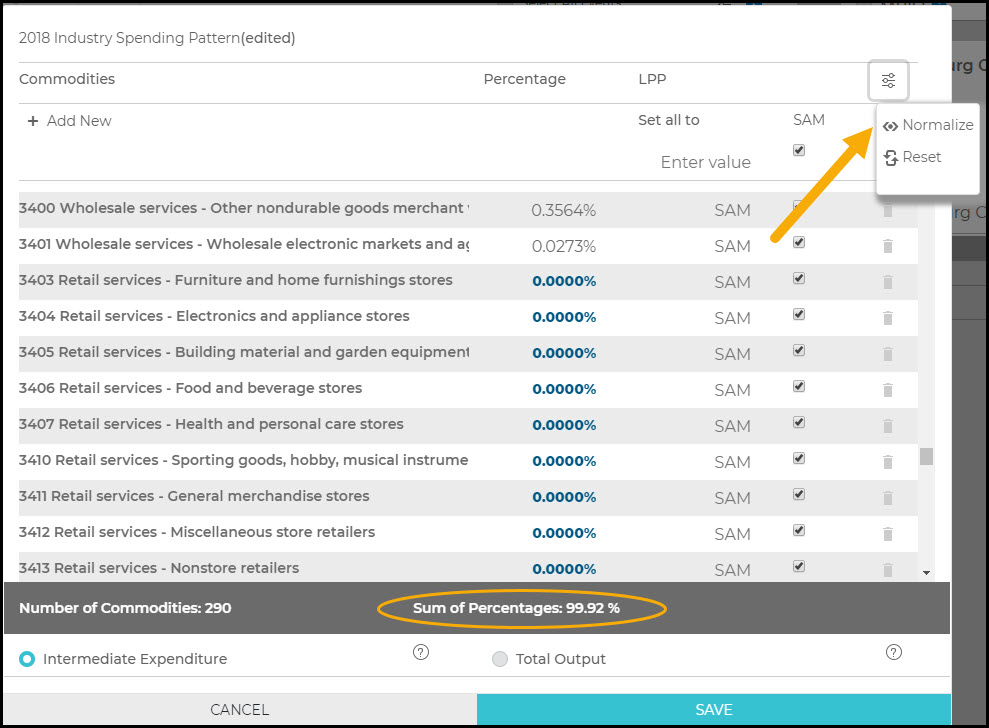
If we are given any further information on the proposed spending by Commodity, we can click the Advanced button and edit the percentages of the Industry Spending Pattern. We may know, for example, that they will not be purchasing anything from a retail store; instead using only wholesalers. We can zero out all Retail Services entering zero in the place of the current percentages. Then, choose Normalize in the Advanced Menu so that the Sum of Percentages is again 100.0%.
Now drag the two Events into the Mecklenburg County Group and hit Run.
Our Results give us Indirect and Induced effects, so we will need to add back in the Direct effect from the information we were given by the hospital.
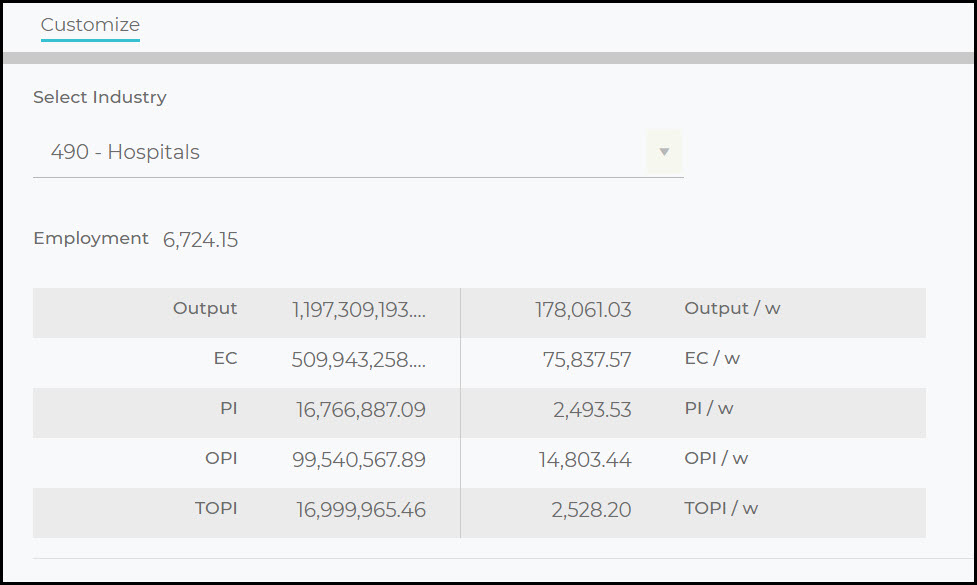
To calculate our Direct effect for our example, we will examine the Output equation in the model by navigating to the Regions screen, choosing Customize, then selecting Industry 490 – Hospitals.
Direct Employment = known Direct Employment. If Employment is unknown, you can calculate it on your own by dividing Direct Output by Output-per-worker. For this clinic, we know that Output is $5M and Output/Worker is $178,061, so we can divide them and find 28.08 Direct employees.
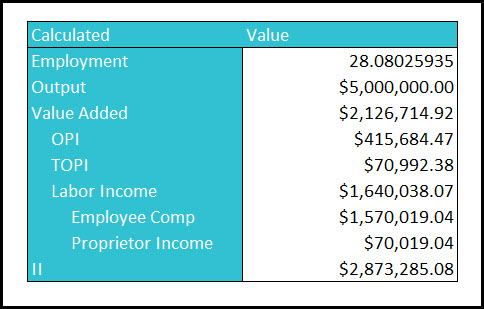
Direct Output = Intermediate Inputs + Value Added. In this example, we know the total Output was $5M.
Direct Value Added = Direct Labor Income + Tax on Production and Imports + Other Property Income
From the Output equation, we know the average TOPI and OPI per worker
Multiply these figures by the total employment
Add Labor Income + TOPI + OPI
Direct Labor Income = EC + PI.
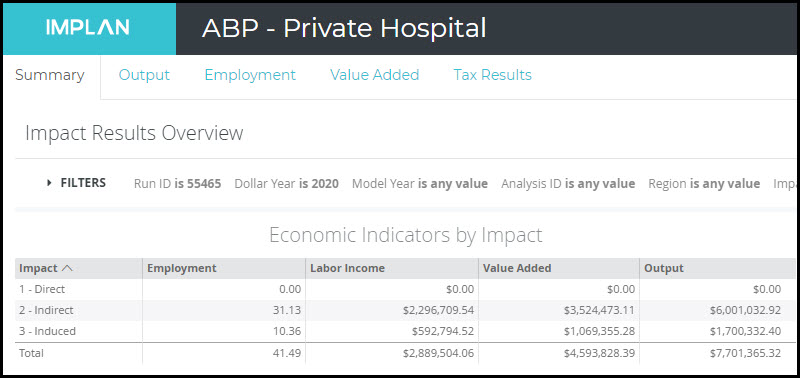
Now we have our final results table below showing our calculated Direct effect and the modeled Indirect and Induced effects.
Hospitals can pose an interesting case for IMPLAN analysis. Many are large institutions with immense buying power. But even the smallest of hospitals are anchor institutions, rooted in our communities and unlikely to close or move.
Hospitals will be classified differently in IMPLAN depending on their legal status and how they operate. They also may have facilities that fall under more than one IMPLAN Sector.
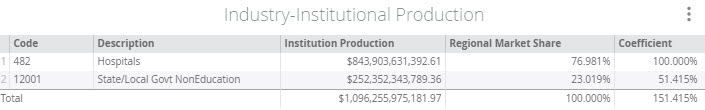
Across the United States in 2017, hospitals accounted for 2.5% of total Output and 2.6% of total Employment. Hospital services were split between the Hospital Sector (76.981%) and State/Local Government Non-Education (23.019%). This means that about ¾ of hospitals across the country are privately held or are nonprofits, while ¼ are run by state and local governments. This data can be found for your study area on the Regions screen by navigating to
Social Accounts >
Balance Sheets >
Commodity Balance Sheet >
Industry-Institutional Production
and then using the Filters button to choose your Commodity of interest. In this case, we used Commodity 3482 – Private Hospital Services.
CHANGE IN DEMAND FOR HOSPITAL SERVICES:
We know from the Industry-Institutional Production information that the Commodity 3482 – Private Hospital Services is produced by both private Hospitals and State/Local Government Non-Education. If there was an increasing population and we wanted to model that change in demand for hospital services, we might not know what combination of private, nonprofit, or public (government) hospitals will absorb the new influx of patients. In this case, running a Commodity Event would be the best option.
SECTOR CONTRIBUTION:
Analysts may want to examine the entirety of the hospital industry. In this case, the best method would be to conduct an Industry Contribution Analysis (ICA). ICA removes buybacks to the Sector(s) of interest and more accurately represents the true contributions of the Sector at the current level of production.
CONSTRUCTION OF HOSPITALS:
Hospitals invest significantly in construction projects and this construction differs greatly from building a new house or highway; therefore hospital construction spending should be modeled through IMPLAN Sector 52 – Construction of new health care structures. Major improvements and renovations to hospitals should be modeled through IMPLAN Sector 62 – Maintenance and repair construction of nonresidential structures.
All construction Sectors in IMPLAN exclude Furniture, Fixtures, & Equipment (FFE). FFE consists of movable furniture, fixtures, and other equipment that is not directly attached to a building. Specialized medical equipment is also not included and therefore should be modeled separately.
Additionally, any land purchases are not included in IMPLAN as the sale of the land has very little impact on the economy. The purchase of the land necessary for a construction activity should not be included as Industry Output for the construction sectors because land sales are considered asset transfers, where one person receives money while the other receives tangible property. Thus, the land sale itself has no value in IMPLAN. Some small impact may be captured however, by creating an Event for real estate fees, and for large commercial projects legal fees.
OTHER HOSPITAL SERVICES:
Hospitals may provide care beyond services that fall under Sector 482 – Hospitals. For example, they may have on site home health care agencies (Sector 480 – Home health care services) or ambulance services (Sector 481 – Other ambulatory health care services). Each of these functions should be modeled separately.
As with any type of analysis in IMPLAN, the more details you have available as the analyst, the more accurate the results. You may have to split out a nonprofit hospital from its privately held ambulance service. Also, you may consider separately modeling the doctor and technician offices that are located on hospital grounds. Each different function, which will fall under a different IMPLAN Sector, should be modeled as its own Event (of group of Events) so that the results can be examined for each of the business functions of the hospital.
Physicians owning their own private practice are often sole proprietorships (LLC or S-Corp). These sole proprietorships can be paid in different ways depending on the hospital; some might be considered wage and salary employees while others are contractors. Be careful not to double count the spending on these doctors in your analysis.
CAUTIONS:
Deciding what to include and what to exclude in your hospital economic impact analysis can be a very delicate balancing act. While you may choose to include certain associated Sectors with your hospital impact, do not fall into the trap of adding every Sector that exists in the hospital supply chain. Incorporating too much not only dulls the focus on the actual impact of the hospital, but it also lowers the credibility of the entire study.
You may want to assume that but for this hospital, there would be no regional impact in the Sector. However, consider that other entities might expand or open facilities in the absence of the one you are modeling.
COMMUNITY & HEALTH BENEFITS:
In order to model a real-life event in IMPLAN, the initial economic effect in terms of a spending or production change, needs to be determined. Some circumstances require additional assumptions by the analyst before modeling.
A few extra steps may be necessary to determine the economic effect of a real-life event including socio-political impacts, environmental impacts, policy changes, price changes, forward linkages, and feasibility analysis.
Modeling tax impacts, like a change in Medicare or Medicaid benefits, falls under the umbrella of socio-political impacts. Therefore, the spending behavior associated with the tax impact/change would need to be determined by the analyst before it can be modeled in IMPLAN. These government policies can affect citizens in many different ways. For example, if a policy is enacted that decreases health care rates, households may spend the money that would have been spent on health insurance on something else.
Another modeling consideration is the savings the hospital might see by decreasing emergency room visits in favor of encouraging patients to seek preventative care and health screenings. The cost differential between the primary care and emergency care could be modeled as a cost savings to the hospital.
A final consideration is potential savings to companies for healthier employees. Fewer sick days and lost productivity could be modeled. Additionally, the ability to work additional years might be modeled as productivity increases.
After reviewing Considerations when Conducting College & University Economic Impacts, you are ready to examine the economic impact of your public college or university. Public colleges and universities are vital to not only the education system, but also to our regional and state economies and this article outlines how to model their expenditures.
Public colleges and universities contribute to local economic activity via different pathways, each of which ought to be evaluated separately for a robust economic impact study that best captures all the effects. The best way to model these impacts is through Analysis-by-Parts (ABP). In this example, we will use the Bill of Goods (BoG) approach and show spending across five categories: university operations, university labor, student spending, visitor spending, and capital expenditures. Each school is unique, so each university impact can include any or all of these parts.
THE PROCESS:
In this example, we will be studying our fictitious school, Leontief State University. It was named in honor of the father of Input-Output analysis, nobel prize winning economist Wassily Leontief. LSU is located in Amherst, Massachusetts and we want to examine its impact on Hampshire County.
STEP 1 – OPERATIONS EXPENDITURES
To begin modeling the impacts of operations expenditures, we will first examine the non-labor budget. In this example we will look at three example industries. When modeling an actual university, there will likely be many more affected Industries. The budget information we know for Leontief State University is:
For each of the expenditure categories, create a new Event. For each Event, choose Industry Output, then select the appropriate sector as the specification. Finally, enter the value of expenditures in that category.
We recommend that you save your work after each new section of data is entered.
SECTOR 473 TRAP:
Unfortunately, there is no IMPLAN sector for public colleges and universities. The sectors in the IMPLAN sectoring scheme are limited to Private Sectors, Government Enterprises, or unique Government Institution “Sectors” that do not include spending patterns. Don’t fall into the trap of Sector 473 – Junior colleges, colleges, universities, and professional schools.
All public education, including K-12 schools through college, are captured in the Institution for State/Local Government Education. Standard Government Institutional activities are not part of the sectoring scheme and thus public colleges and universities are not represented in the Sector listing. This is because Government Institutions don’t have production functions or Multipliers. Specifically, there is no direct relationship between sales and production for Government Institutions since they derive revenue from collected tax dollars and not sales. Public entities, including colleges and universities, require a different approach to measure impacts.
CONSIDERATIONS:
You can choose to model the effect of Commodity purchases rather than Industry purchases
You can enter as many events as you have line items in the budget you are modeling
Also, remember to adjust the Local Purchase Percentage (LPP) as necessary; only local purchases should be included
ALTERNATE APPROACH:
An alternative approach, as opposed to modeling each Intermediate Expenditure through a Bill of Goods approach is to run the total Intermediate Expenditures value through the Institutional Spending Pattern that best reflects the industry you are modeling; in this case, State/Local Govt Education.
However, the Institutional Spending Pattern for State/Local Govt Education also encompasses primary and secondary schools in addition to colleges. Because of this, you may want to consider using the private sector as a proxy. In this case, choose Sector 473 – Junior colleges, colleges, universities, and professional schools. For more information on this approach, follow the instructions for Analysis-by-Parts: Using an Industry Spending Pattern Event with Labor Income Event(s).
STEP 2 – LABOR EXPENDITURES
Since labor costs were not modeled as a part of the school’s operations expenditures in Step 1, we will have to model them independently. Let’s say that Leontief State University tells us that Labor expenditures sum to $50 Million. To analyze this impact, we create a new Labor Income Type Event, with a specification of Employee Compensation, and a Value of $50 Million. This is entered on the same Events screen as the three Industry Output Events.
CONSIDERATIONS:
These should be fully loaded payroll values which include wage and salary, all benefits (e.g., health, retirement) and payroll taxes (both sides of social security, unemployment taxes, etc.)
If the University’s employees commute into the study area for work, then they should not be included in the Labor Income Event
STEP 3 – STUDENT SPENDING
Personal spending by students on non-college goods and services (like the classic textbook Input-Output Economics (Leontief, 1966) and Moscow Mules) will also have an impact on the local economy. To estimate these impacts, we will need to know how much they spend on personal items and which items they purchase. These can then be modeled by adding expenditures to an additional Industry Output Event, with the appropriate Specification. Some considerations on what to include in student spending are outlined below. Additional details on outlining student spending can be found in Surveying for Input-Output.Some items to consider including are:
Books
Transportation
Food & beverages
Alcohol
Recreation & amusement
Retail
At Leontief State, we know the average student spends according to the following table. With actual survey data, you will likely have more spending categories.
We also know that LSU has 12,000 total students.
STEP 4 – VISITOR SPENDING
Personal spending by visitors on non-college goods and services (like hotels, transportation, and restaurants) will also have an impact on the local economy. To estimate these impacts, we will need to know how much they spend on personal items and what they purchase. These can then be modeled by adding expenditures to an additional Industry Output Event, again with the appropriate Specification. Remember, visitors will not spend their money in the same was as a college student. Consider spending categories such as:
Lodging
Transportation to the city
Transportation within the city
Gasoline
Food & beverages
Retail
Recreation & amusement
From a visitor survey, we are given the following information from Leontief State for their estimated 25,000 annual visitors.
STEP 5 – CAPITAL EXPENDITURES
If in addition to its operations, the college or university supported other economic activity in the region because of new campus construction projects (note that general maintenance and repair are part of the operational spending pattern), you can model the effects of these activities as well. This analysis can be done by adding expenditures to an additional Industry Output Event, with the appropriate Specification.
College impacts often have associated capital expenditure layouts that it may be desirable to consider within the analysis. When looking at these expenditures there are some important things to keep in mind.
Typically investments in buildings and equipment are temporary in nature. While the building and equipment will continue, the actual expenditures on these items tend to be one time or of a short-term, non-recurring nature, as opposed to be year-over-year expenditures. Thus it is important that we distinguish these impacts from those that are recurring.
For Furniture, Fixtures, and Equipment (FFE) or other major equipment purchases, it is important to consider if the purchase is from a manufacturing sector or if the purchase is actually through a wholesaler or retailer, as these will affect how FFE is modeled. In addition to this, if the equipment is not produced in the region of the model, it may be good to report on that expenditure, but not include it’s value in the modeling process.
For example, LSU just opened up a state-of-the-art new College of Statistics at a cost of $50M. We can run this through an Industry Output Event in Sector 55 – Construction of new educational and vocational structures.
Our Event screen now is fully populated with all of the information we have from LSU. When creating a long list of Events as in this example, give each a name that is easy to remember so that using the FILTERS button on the Results screens is straightforward.
STEP 6 – RUN THE IMPACT
Now either use the button at the top to select all or highlight each Event and drag them into your Group. Next, hit run.
STEP 7 – ANALYZE THE RESULTS
The results will show you the economic impact of all of the Events you entered which will include the Industry Events and the Labor Income Event. To look at the results by Event, use the FILTERS button and select which of the Events you would like displayed. For example, choosing all three Operations Events and the Labor Event will filter the results to only include the economic impact of the university operations.
University operations are yearly impacts. Construction impacts occur only once. Therefore, we recommend that these are not reported together. Remember to clearly label your tables and figures so readers have a clear understanding of your results.
Total 2019 Operations Impact of Leontief State University on Hampshire County, Massachusetts
Total 2019 Capital Impact of Leontief State University on Hampshire County, Massachusetts
https://implan.com/wp-content/uploads/Market-site-Logo-resized-2-1.jpg00Adam Smithhttps://implan.com/wp-content/uploads/Market-site-Logo-resized-2-1.jpgAdam Smith2019-10-25 09:35:042019-10-25 09:36:18College: Modeling Public College & University Impacts
Now that you have read Considerations when Conducting College & University Economic Impacts, you are ready to examine the economic impact of a private college or university. Private colleges and universities spend and save money in a very different manner than their public counterparts. Remember, each school is unique, so the more details that you enter in the model, the more accurate the results.
The goal of this article is to be a guide in framing your private college impact study. Spending can be split across operations, university labor, student spending, visitor spending, and capital expenditures.
THE PROCESS:
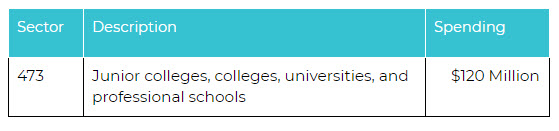
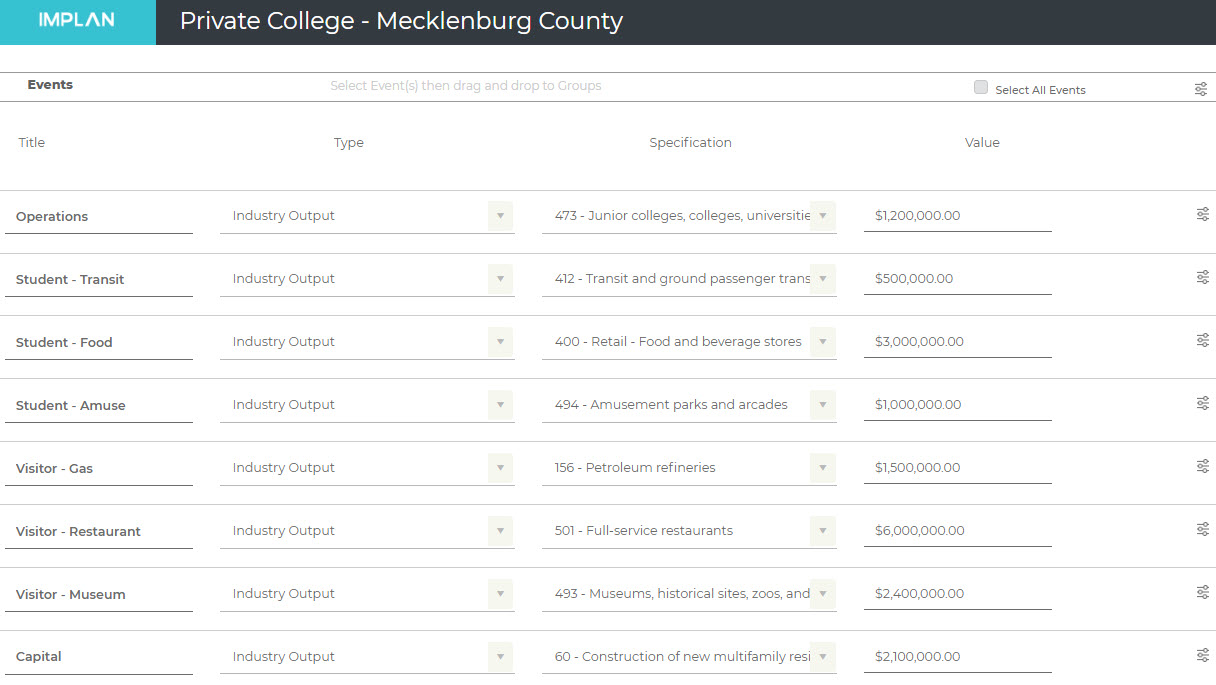
For this example, we will be looking at Input Output University (IOU), a four-year liberal arts school known worldwide for their advanced economic theory program. They are located in Huntersville, NC in Mecklenburg County. We know that IOU spends $120 million in annual operating costs.
STEP 1 – OPERATIONS EXPENDITURES
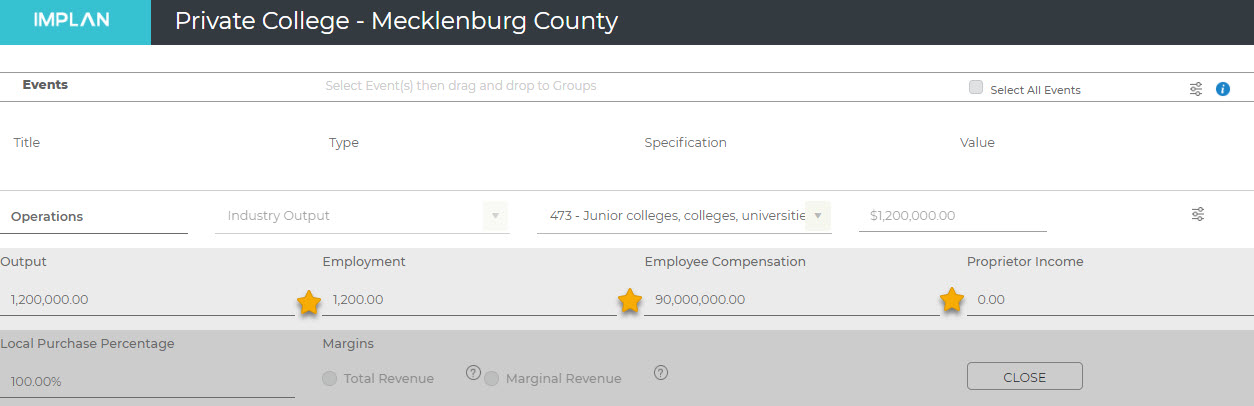
If only total operations expenditures for the university are known, the total can be run through Sector 473 – Junior colleges, colleges, universities, and professional schools. This Sector includes all private colleges and universities while excluding all public institutions. Note that some specialty, business, and technical schools are actually included in Sector 474 – Other educational services.
Since labor costs were not modeled as a part of the school’s operations expenditures in Step 1, we can add this information to our Industry Output Event. IOU spends $90 Million on salaries and benefits to their 1,200 employees (note this was not included in the $1.2 million operations figure). We can add the Employment, Employee Compensation, and zero out the Proprietor Income as there is no ownership entity for IOU.
CONSIDERATIONS:
These should be fully loaded payroll values which include wage and salary, all benefits (e.g., health, retirement) and payroll taxes (both sides of social security, unemployment taxes, etc.)
If the University’s employees commute into the study area for work, then they should not be included in the Labor Income Event
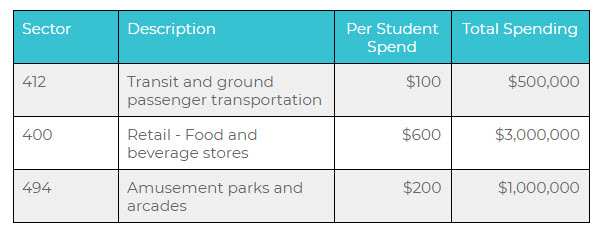
STEP 3 – STUDENT SPENDING
Personal spending by private school students on goods and services (outside of tuition and fees paid to the school) will also have an impact on the local economy. To estimate these impacts, we will need to know how much they spend on personal items and what they purchase. Additional details on outlining student spending can be found in Surveying for Input-Output. Examples of potential spending categories include:
Student Spending
Books
Transportation
Food & beverages
Alcohol
Recreation & amusement
Retail
IOU has 5,000 students and their yearly spending is outlined as follows:
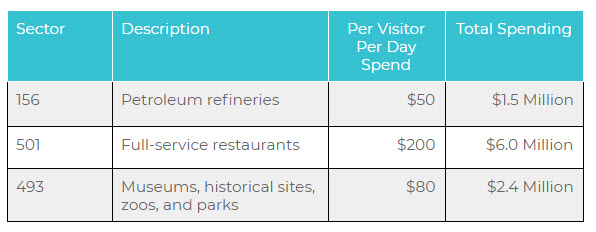
STEP 4 – VISITOR SPENDING
Colleges and universities welcome sporting event spectators, patrons of the arts, parents, siblings, and prospective students to campus as visitors. The spending by these visitors can be captured via survey and used as inputs in the model by adding expenditures to an additional Industry Output Event. Consider spending categories such as:
Lodging
Transportation to the city
Transportation within the city
Gasoline
Food & beverages
Retail
Recreation & amusement
IOU estimates that 15,000 total guests visit each year, for an average of two days, and estimates their spending as follows:
STEP 5 – CAPITAL EXPENDITURES
Often times, colleges and universities also like to show their economic impact in terms of large-scale construction projects. IOU just opened a brand new dormitory at a cost of $2.1 million. This can be entered as an Industry Output Event in Sector 60 – Construction of new multifamily residential structures.
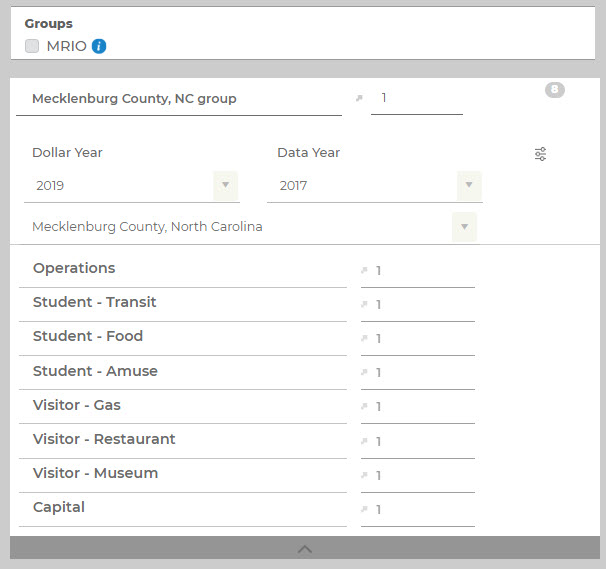
Now we have a complete picture of IOU’s direct spending as shown below. Remember to give each of your Events a memorable name so that using the FILTERS button on the Results screen is seamless.
STEP 6 – RUN THE IMPACT
Now either use the button at the top to select all or highlight each Event and drag them into your Group. Next, hit run.
STEP 7 – ANALYZE THE RESULTS
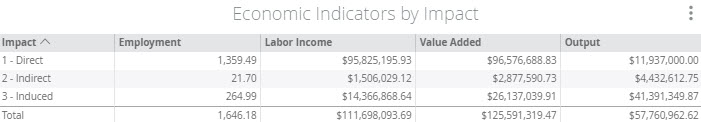
The results will show you the economic impact of all of the Events you entered which will include the Industry Events and the Labor Income Event(s). If you want to look at the results by Event, use the FILTERS button and select which of the Events you would like displayed. For example, choosing all three Operations Events and the Labor Event will filter the results to only include the economic impact of the university operations.
Total 2019 Operations Impact of Input Output University on Mecklenburg County, North Carolina
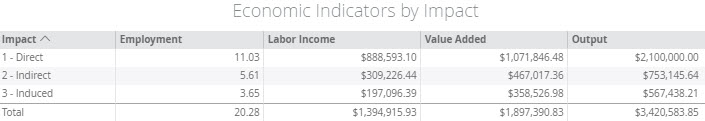
Total Impact of Input Output University 2019 Dormitory Construction on Mecklenburg County, North Carolina
Examining the impact that a college or university has on a region is a common use case in IMPLAN, but the potential complexities warrant careful consideration when setting up and framing the study. The goal of this article is to help guide you in correctly framing your analysis and to increase awareness of some of the special considerations of college and university analyses.
CAPTURING NET NEW EFFECTS:
When considering our Study Area geography, a question can arise about the importance of where the funding originates when it differs from the location where the funds are spent.
In IMPLAN, we are interested primarily in how and where money is spent, not its source. As long as we know that the money is new to the Study Area, we can consider these funds to create a measurable impact.
The idea of what new money is, however, can become more challenging when residents spend money on sporting events, conventions, fairs and other transient events, this spending is considered substitutive rather than new money to the region. This is an important designation because it means that rather than truly supporting economic change and growth in a region, resident money is simply shifting from one local venue to another. Resident spending only has a true ‘new’ impact in cases where the event draws out spending that would normally be saved.
In the context of college student spending, generally resident students aren’t counted. While they may have some short term impacts while setting up new households, the general spending they represent in the economy is not likely to significantly change beyond those one-time purchases. Why? The increase in their daily spending is offset by a decrease in their parents local spending.
When would this rule not apply? If you can make the argument that your university, college, or program is unique and thus kept the students from leaving the region. This creates a theoretical ‘new’ spending circumstance. Examples of this might be having a medical degree program or being a religious college. With these sorts of specializations an argument can be made that the students would have left the region but for these local programs.
If the goal is to see how a college or university fits within the regional economic ecosystem or no information on net new money is available, consider performing an Industry Contribution Analysis (ICA). ICA can be used to estimate the relative extent and magnitude of an existing institution in the study area.
LIFETIME EARNINGS & LOANS
While we do not recommend looking at forecasting the prospective value of college student’s education on their economic potential, IMPLAN has been used as a factor in some of these scenarios. If you are looking at projecting earning potentials of students, please keep in mind the effects of loans. These loans must be paid back and thus reduce the earning potential of students and their ability to create effects on the local economies where they live. Some other caveats to consider if you are looking at these types of impacts are:
Will students actually receive job placements in their target degree area, and how long will it take them to get the experience needed to get these jobs?
How much of their increased earning is attributable to this degree, especially if their job is outside of their field or they go on to graduate school?
Will the student remain in the region after receiving training?
What percentage of students remain long-term in their degree field?
How many open positions or places for advancement are available and are these accounted for within the calculation for potential future income generation?
DOUBLE COUNTING:
Impacts that involve multiple stages, like many college impacts, can easily incur scenarios for double counting. For instance, spending on tickets for sporting games may be a separate impact, but those ticket funds may also be accounted for as part of the college’s operations budget. Likewise, tuition covered by scholarships that are provided by the school creates no additional impacts because these are already accounted for in the college’s budget.
It is important then, when framing the impact to consider where funds are captured. The total college operations budget should include all sources of revenue. Tuition is obviously captured here, but, depending on the school and the services or programs it offers, funds coming in from on-campus sporting events (such as ticket and drinks sales), campus owned bookstores, college owned dormitories, and college meal plans could also be sources of double-counting if they are also captured as part of student spending.
OPERATIONS AND CAPITAL IMPACTS
University operations are yearly impacts. Construction impacts occur only once. Therefore, we recommend that these are not reported together. There are two main reasons that we recommend that you do not report operations impact and capital impact together.
People love job numbers. It is not uncommon for studies that report rolled up construction and operational impacts to have job numbers that mix both temporary and ongoing Employment picked up and reported by others as the recurring Employment impact. This is one source of the idea that Input-Output Analysis studies overestimate impacts.
The same principles apply to other economic factors as well. The Labor Income, Value Added and Output of the construction are occurring only over a short period of time and thus have a more limited impact than operational changes. This is best reflected when the two types of impacts are handled separately.
PUBLIC VERSUS PRIVATE SCHOOLS:
There are many factors for the analyst to consider when modeling any institution of higher learning. Most importantly, public and private colleges and universities will follow very different spending and additionally will attract different students and visitors. The sheer size of some large public universities will lend them to have immense overall budgets. They also might see large influxes of visitors in town for a playoff game. Alternatively, universities that focus heavily on research tend to invest in the sciences as well as research and development activities and may not offer any sports programs. Small fine arts schools might be more selective but have talented and famous alumni network that generously subsidizes their capital budget. Knowing the details of each school will ensure that the analysis is accurate and defendable. For details on the specifics on public and private college and university impacts, visit the pages below.
https://implan.com/wp-content/uploads/Market-site-Logo-resized-2-1.jpg00Adam Smithhttps://implan.com/wp-content/uploads/Market-site-Logo-resized-2-1.jpgAdam Smith2019-10-25 09:17:432019-10-25 09:17:57College: Considerations when Conducting College & University Economic Impacts
Price paid by the purchasers of commodities at the wholesale trade level; wholesale purchasers prices are obtained by adding wholesale trade margin plus transportation costs to producers prices. (BEA)


 and then clicking on the Advanced Menu
  and selecting Customize Region