The following downloads are for the 2018 data. They are not valid for the 536 Sectoring scheme used in datasets from 2013-2017.
IMPLAN 546 Industries and Commodities
2017 NAICS to IMPLAN 546 Sectors
Convert BEA’s 2017 NAICS codes to IMPLAN Sectors (546 scheme) using this downloadable spreadsheet.
2012 NAICS to IMPLAN 546 Sectors
Convert BEA’s 2012 NAICS codes to IMPLAN Sectors (546 scheme) using this downloadable spreadsheet.
Definitions of IMPLAN’s 546 Construction Sectors
View the breakdown of IMPLAN’s construction sectors (546 scheme) using this downloadable spreadsheet.
536 TO 546 BRIDGE
This bridge allows you to convert from the 536 sectoring scheme (2013-2017 data years) to the new 546 sectoring scheme. Note that the ratios only work one way: The 536 to 546 bridge is useful for converting 536-based sectors to 546-based sectors, but is not useful for converting 546-based sectors to 536-based sectors.
In the 536 to 546 bridge, a ratio of 1 means that 100% of the 536 sector should be classified as the corresponding 546 sector. In theory, there could be any number of sectors with a ratio of 1 merged into a single sector. So, the ratio of 1 for two different 536-based sectors simply means that both fit entirely into the same 546-based sector. In general, this happens rarely since we disaggregated more sectors than we aggregated.
546 TO 536 BRIDGE
This bridge allows you to convert from the 546 sectoring scheme to the old 536 sectoring scheme (2013-2017 data years) . Note that the ratios only work one way: The 546 to 536 bridge is useful for converting 546-based sectors to 536-based sectors, but is not useful for converting 536-based sectors to 546-based sectors.
In the 546 to 536 bridge, a ratio of 1 means that 100% of the 546 sector should be classified as the corresponding 536 sector. In theory, there could be any number of sectors with a ratio of 1 merged into a single sector. So, the ratio of 1 for two different 546-based sectors simply means that both fit entirely into the same 536-based sector. In general, this happens rarely since we disaggregated more sectors than we aggregated.
https://implan.com/wp-content/uploads/Market-site-Logo-resized-2-1.jpg00Adam Smithhttps://implan.com/wp-content/uploads/Market-site-Logo-resized-2-1.jpgAdam Smith2019-10-24 15:36:172019-10-24 15:37:29546 Sector Industries, Conversions, Bridges, & Construction – 2018 Data
IMPLAN economists are often asked about best practices when modeling changes in utility prices and rebates on energy purchases. This article gives some general guidance on how to best proceed when investigating these situations.
DETAILS:
The first step in looking at changes in energy prices is to determine who is the producer and the consumer. In IMPLAN, utilities are produced by both Industries (Sectors 41-51) and Government (Sectors 519, 522, & 525). Consumers of utilities can be Households, Industries, and Government.
Perhaps you want to model a price change in the Commodity, not knowing if it will be produced by a firm or the government. If this is the case, consider using a Commodity such as 3041 – Electricity.
Next, you will need to make assumptions about the price increases or decreases that will be modeled – who will be affected and if that change is positive or negative. This will frame your analysis.
HOUSEHOLDS:
A popular case to examine is modeling increased income that households would see from a decrease in utility pricing or from utility rebates. To model this, a Household Income Change (HHIC) is a great option. The HHIC will remove personal taxes and savings before calculating the results.
Any changes to household spending will be at the same rate across all spending categories. This means that even though the savings might be spent on increased retail shopping or entertainment, the spending pattern will allocate the savings across all household purchases, which doesn’t always make sense. Just because someone saved money on their utility bill doesn’t mean their rent increased. Each analyst must determine how the savings will be spent.
In the case of a rate hike, you would see a reduction or negative impact in households. Be careful in this case as well. Giving a household less disposable income doesn’t necessarily mean they won’t pay their student loans or buy groceries. They may instead cut their utility usage or decrease their entertainment budget. If the increase is small enough it may have little to no impact on household spending for any group.
Remember, different households may respond differently, depending on the size of the rate increase, their needs, and income level. A larger increase will likely affect the spending of lower income households but may not affect the spending of higher income households as these payments may come from savings (leakages in IMPLAN).
INDUSTRIES:
PRODUCING
As a producer, Industries can be positively or negatively affected by price changes. If the cost of inputs skyrockets or bottoms out, these price changes can’t immediately be passed on to the consumer, so short-term losses may occur.
Changes in Industries can be modeled through:
Sector 41 – Electric power generation – Hydroelectric
Sector 42 – Electric power generation – Fossil fuel
Sector 43 – Electric power generation – Nuclear
Sector 44 – Electric power generation – Solar
Sector 45 – Electric power generation – Wind
Sector 46 – Electric power generation – Geothermal
Sector 47 – Electric power generation – Biomass
Sector 48 – Electric power generation – All other
Sector 49 – Electric power transmission and distribution
Sector 50 – Natural gas distribution
Sector 51 – Water, sewage and other systems
CONSUMING
Estimating a change in Industry price or profit is outside of the scope of Input-Output analysis. Therefore, the analyst must make assumptions about where the price changes would occur and how to model them.
For a price reduction or rebate, the likelihood is that this savings would go into Other Property Income (OPI). OPI in IMPLAN is treated as leakage. However, you may know that this savings is allowing the affected Industries to hire more staff or produce more widgets. This can be modeled in IMPLAN.
If you want to assume that the businesses cannot control the price of their products, any increase in utility costs could show a loss in profit. It might even be enough to shutter some businesses altogether. More likely, however, they will just raise the price of their products to offset the higher bills.
GOVERNMENT:
PRODUCING
As a producer of utilities in many areas, the changing cost of inputs can affect the operating margin of government-run utilities. Changes to government utility production can be modeled through one of the government utility Sectors:
Sector 519 – Federal electric utilities
Sector 522 – State government electric utilities
Sector 525 – Local government electric utilities
CONSUMING
Governments can be affected negatively by increased utility costs, as well. More money being spent on electricity, for example, decreases the overall budget and might lead to program cuts or elimination. Often this is just in the short-run, however, as increased costs will likely be passed onto the consumer.
Governments can see savings as well when utility costs decrease. Analysts will need to determine how to model these cost savings. Knowing how the savings will be spent is key to being able to modeling the impact. If a new school is built with the savings, then a simple construction Event is appropriate. Perhaps you may only know which government entity will spend the savings, in which case you should choose from the Institutional Spending Patterns. When using an Institutional Spending Pattern, remember to modify it to remove the purchases of Commodities related to the utility generation you are examining.
CONSTRUCTION:
Although temporary in nature, construction projects conducted by utility companies are often large and costly. Consider modeling this as a separate impact from operations or price changes.
NET ANALYSIS:
If a government entity is considering building a new facility to produce utilities more efficiently in the long-term, a Net Analysis should be used to model both the losses to private Industry and the cost savings to Government (increased spending) or Households (additional HH income). This assumes, however, that the utility company would not continue to produce that Commodity and that the previous local consumption could not be replaced by non-local consumption (exports).
The Institutional Spending Pattern Event Type represents a general spending distribution for measuring broad Institutional activity in your region. These include general spending for:
Federal Government
NonDefense
Defense
Investment
State/Local Government
NonEducation
Education
Investment
Capital
Inventory Additions/Deletions
Note that the Specifications for Capital and Inventory Additions/Deletions relate to all Industries, not only government and should rarely be used.
INSTITUTIONAL SPENDING PATTERN:
These general spending patterns are unique in that they describe both Intermediate Expenditures and Value Added within the same Spending Pattern. This results in these Spending Patterns producing ‘mixed results’; where the reported Direct Effects describe both what we would generally consider Direct Effects (income, Employment and Value Added) and the first-round Indirect Effects that arise from the government spending its budget. This mixing of the results requires some additional work on the part of the analyst to parse the results, or requires the analyst to divide the Spending Pattern into the traditional Spending Pattern prototype that includes only Intermediate Expenditures, and then create a separate Activity to account for the labor/payroll component using Analysis-by-Parts (ABP).
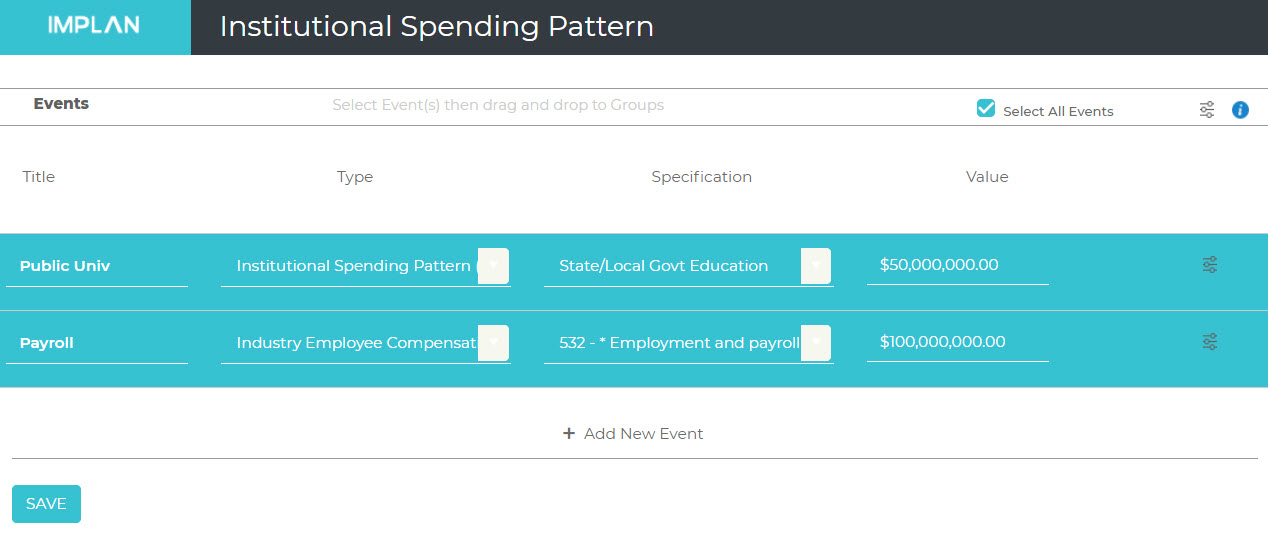
As an example, let’s say we want to use the Institutional Spending Pattern to model a public university. This would fall under State/Local Government Education.
The Advanced Menu shows all of the Commodities and the LPP is set to SAM. This will model the university’s purchases of local commodities based on the rate in which each commodity is purchased locally in the Data Year.
Note also that the Sum of Event Values is 100%. This means that every dollar Value entered will be spent across the Spending Pattern.
At the bottom of the Events list, note the two Sectors designed with an * and the wording ‘Employment and payroll’. These Sectors are special Sectors that have no associated spending pattern and are used to calculate the Employment value and Value Added associated to government activity.
At this point in the analysis, we have two options for proceeding.
Option 1
We can use the full value of our university annual operations in the Value field and run the impact. No further edits are made as all of the spending of the institution is captured in the spending pattern.
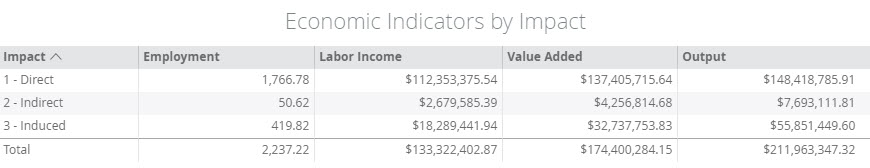
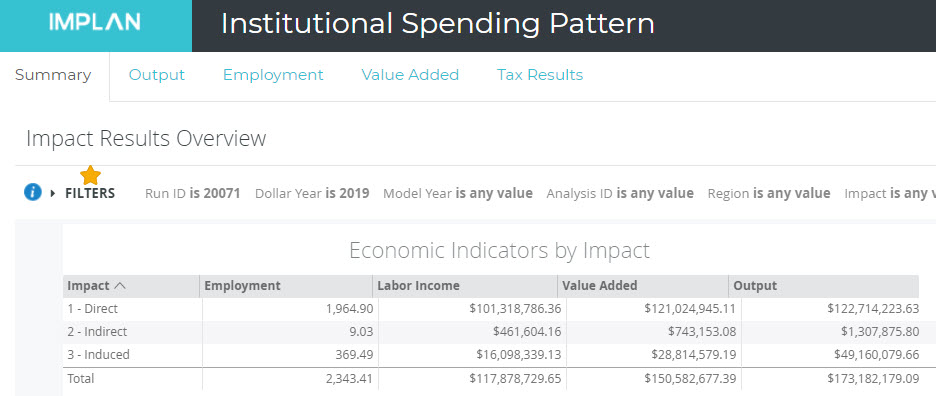
It is important to remember that the reported Direct Effects are a mixture of the effects of the university itself and the first-round of Intermediate Expenditures in the region. This also explains why the reported Indirect Effects appear to be so low, and why the Employment, Labor Income, and Output reported for the Direct Effects do not match the numbers we put in on the impacts screen.
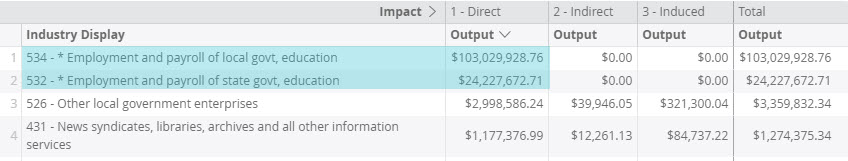
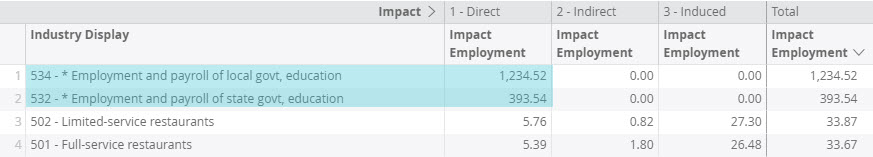
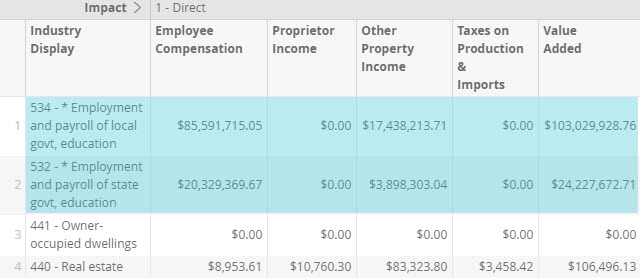
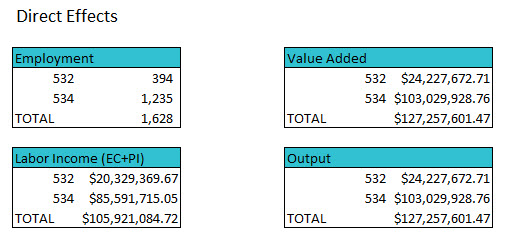
Now we pull out the Direct Effect of Sectors 532 and 534 (Employment and payroll) from our Output, Employment, Value Added tabs.
Output
Employment
Value Added
We can copy the Direct Effects for Sectors 532 and 534 into Excel and total them. The template here will help you to follow along with the calculations. This gives us our true Direct Employment, Labor Income, and Value Added.
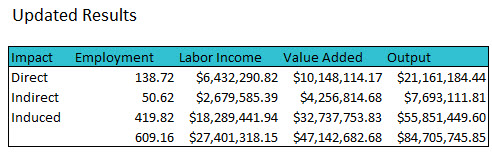
Next, update the results by subtracting the calculated Direct Effect from the original Direct Effect.
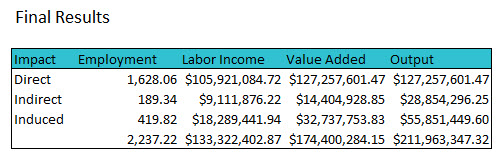
Finally, add the Direct Effect + Indirect Effect from the updated results together to create your Indirect Effect. Then Add back your calculated Direct Effect and sum the table.
Note that when we do this, Value Added = Output. This occurs because these special ‘payroll only’ Sectors do not include any Intermediate Expenditures. We can now adjust the reported Direct Effects by removing these figures from the results and then reformatting the results by summing the Direct and Indirect lines together and moving this total to the Indirect line. Next, we insert our Direct Value in the Direct line.
After all that work, note that the total from our original impact match the totals from our final results. The difference lies in what is included in the Direct and Indirect Effects.
Option 2
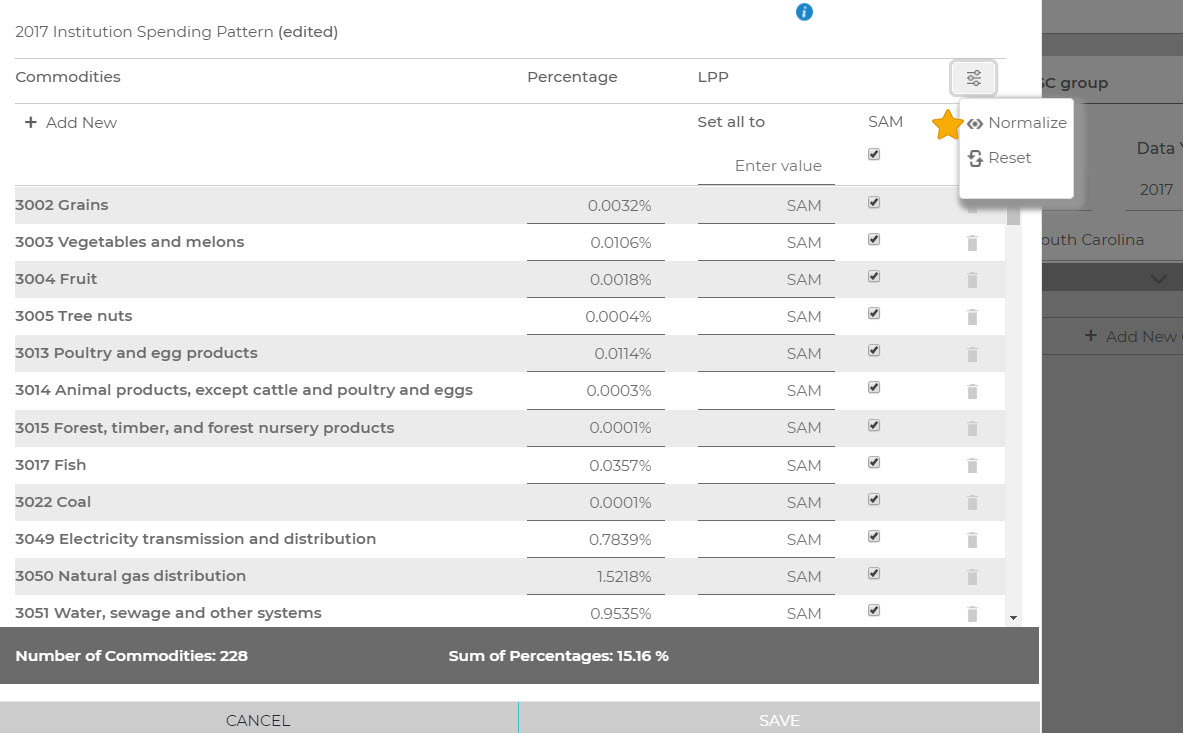
The second option involves zeroing out the two payroll Sectors from the spending pattern before running the analysis. In the Advanced menu on the Impacts screen, click the trash to delete both 3532 and 3534 (Employment and payroll).
After the payroll Sectors have been removed the spending pattern Sum of Event Values is only 15.16%. This indicates that by default the Intermediate Expenditures associated to State & Local Government Education activity make up only 15.16% of their total production value.
One advantage of removing the payroll Sectors is that we can easily, and predictably, change the assumption of the amount of spending that goes towards the purchase of goods and services for university operations to our known value. If we only have total operational value, and don’t have a budget and payroll value, we can certainly use this percentage to approximate the split between Intermediate Expenditures and Value Added and use known figures as our Value. However, if we know the goods and services budget, we can normalize the Spending Pattern so that we can use the budgetary figure as our Value.
Note that after we click Normalize, the Sum of Event Values is 100% again, thus indicating that every dollar in the Event Value will be spent on the spending pattern. We can now set the Value to the cost of goods and services for the university.
Now that the goods and services have been accounted for, we need to see the impacts of their payroll effects. We can do this by creating another Event for the payroll using Industry Employee Compensation and Sector 532 – Employment and payroll of state government education. If we know the employment, we can add it to this Event under the Advanced menu.
We use the Industry Employee Compensation Event type (instead of a Labor Income Event) because it captures or estimates the additional Value Added element of the capital consumption. A Labor Income Change could also be used with the payroll value and an Employee Compensation Event, but you would need to solve for Value Added separately, which can be cumbersome.
Two Scenarios are used because this avoids having the ‘mixed’ set of results we saw in Option 1 above. From these two Scenarios we now get two sets of results. The first is the spending pattern results which describe the effects of our budgetary expenditures on the local economy. Again these results do not include our Direct Employment, Labor Income, Value Added or Output, but do reflect the Employment, Labor Income, Value Added and Output associated to the first-round of Intermediate Expenditures of the university in the local economy in the listed Direct Effects. The second is the impact of the payroll and employment which show the impact of staff spending their income in the local economy. Our Results screen will default to showing both combined. If you want to look at the Results of only one of the impacts, click on Filters and choose the Event Name you wish to see. Filtering by the Institutional Spending Pattern will show the Direct Effects that should all be added to the existing Indirect Effect to produce the true Indirect Effect. From there you can simply add the results of the Industry Employee Compensation Event to the edited Institutional Spending Pattern results. All that is left is to populate the Direct Output with the combination of the 2 Event Values run in each Event.
If you know all of the Direct Effects of your institution, we recommend using Option 2. By removing the payroll Sectors and normalizing the Spending Pattern you have complete control over the ratios and how your values are applied.
Note that the two Scenarios will not produce the same results if you use a different ratio of Intermediate Expenditures to Output in Option 2.
ADDITIONAL CONSIDERATIONS:
To include only state or local employees, you can use either method. If you want to use the Option 1 which leaves the payroll Sectors in the Spending Pattern, you can sum the two coefficients for payroll Sectors together and use the new coefficient with the relevant Sector. Alternatively, you can use the Option 2 as described; removing the payroll Sectors from the spending pattern and then creating your new Event with the Sector that is appropriate for your known Employee Compensation.
Value Added is greater than Employee Compensation, which might not make sense for a public institution. While the majority of Value Added is Employee Compensation, there is a small additional value that these Sectors account for that describes the Institution’s capital consumption allowance.
Spending Patterns can be thought of as the backward linkages or supply chain of the Industry. Spending Pattern Events are best used when modifications to an Industry’s Production Function are necessary that cannot be made with a standard Industry Event. When detailed information is known about the Industry’s spending, a Spending Pattern Event can be used and adjusted to reflect the specific purchases or ratios of purchases. Spending Patterns include all Intermediate Expenditures for a given Industry.
One size may fit most, but maybe not all. While the Spending Patterns represent the average buying pattern and ratios of all firms in that Industry, it may not match the expenditure pattern of your firm. For example, if you are working with an organic farmer, you might note that there are no Sectors for organic farming. As a result your Indirect Effects include a large quantity of pesticides and herbicides that just aren’t appropriate. You can use the Industry Spending Pattern to adjust the purchases of your firm with your detailed knowledge of their spending.
DETAILS:
The default in IMPLAN is set the Event Value of an Industry Spending Pattern to Intermediate Expenditures. This includes the purchases of non-durable goods and services such as energy, materials, and purchased services that are used for the production of other goods and services (rather than for final consumption). When Intermediate Expenditures is chosen, the Event Value will be run through the model.
However, only total Output may be known. Output is the total value of Industry production in producer prices.
Manufacturing Sectors: Output = sales plus/minus change in inventory
When Output is chosen, the value will be multiplied by the total Gross Absorption percentage for the Industry before being run through the model.
INDUSTRY SPENDING PATTERN:
Industry Spending Patterns allow you to build an Industry from data about its expenditures. The coefficients listed in an Industry Spending Pattern Event represent the amount spent on each commodity per dollar of that Industry’s Intermediate Expenditures.
An important note about these spending patterns is that the direct effect is not accounted for in the results.
Let’s say we want to model the Industry Spending Pattern for a new fast food restaurant (Sector 502 – Limited service restaurants) that is planning to open up in Rochester, NY (Monroe County). Opening up the Advanced Menu of our Event, we see the complete list of Commodities purchased by fast food restaurants in our Region.
We know that our restaurant, Stephanie’s Subs, has projected Sales of $5M. We also know that they will not be serving alcohol, so we want to eliminate this spending (Breweries, Wineries, and Distilleries). We can scroll down to find Commodities 3108, 3109, and 3110 and change the given percentage to 0% in each of them.
After our changes, we can see that the total percentage now sums to 97.18%. Clicking on the Advanced Menu allows us to Normalize the results so that they once again sum to 100%. Also, this is where we can reset the Industry Spending Pattern to IMPLAN defaults.
We also have the option to change the Local Purchase Percentage (LPP) inside the Industry Spending Pattern. The default in IMPLAN is that the LPP is set to the Social Accounting Matrix (SAM) value. Unless you know that the Commodity will be purchased locally, it is advised to leave the SAM value.
Now we are ready to hit Run and examine our Results.
Notice that there are no Direct Effects in our Results so we will need to add those back in manually. We know our total Output is $5M. Now we need to navigate back to our Regions screen and click on
Study Area Data >
Regions Industry Summary
Here we can find IMPLAN’s known totals for Sector 502 – Limited service restaurants for Output, Employment, Labor Income, and Value Added. To model the Induced Effects from the Labor Income, Analysis-by-Parts (ABP) would be the best method.
Calculating the ratio of Stephanie’s Output to the total Output in the county, we see her restaurant will be 0.43% of the total. We can then apply this percentage to the other values in our impact to estimate the Direct effect. The template for these calculations is here.
Remember how IMPLAN Pro let you upload and download Activity Templates? Well, now you can bring all of your IMPLAN Pro work into IMPLAN in just a few easy steps. You can also download a copy of the Event Template to construct multiple Events at once.
What was once called the Activity Template is now called the Event Template, but the Excel document looks the same. Currently, IMPLAN allows you to upload Industry Change, Commodity Output, Labor Income Changes, and Household Spending Changes. We have several improvements and expansions planned for this template as we work to include things like Spending Patterns, Regional Definition, and more. As always, if you have ideas we would love to hear them here!
The Event Template is a very specific file, and each field must be filled out exactly as it is shown in the original template. It can be used to create Events outside of IMPLAN for import into the system. The sheet has one tab for each Activity Type, and the correct tab must be used in order for importing to be successful.
EXPORTING AN ACTIVITY TEMPLATE FROM IMPLAN PRO & UPLOADING IT TO IMPLAN:
STEP 1 – EXPORTING AN ACTIVITY TEMPLATE FROM IMPLAN PRO
Select the Activity you want to export from IMPLAN Pro.
Click Activity Options.
Click Export.
Click To Excel.
Save the Activity as an Excel file on your computer. Save the file in a place, and under a name, that will be easy for you to find and identify later.
If you’ve exported a Household Income Change or a Commodity Change: you will need to ensure that your Excel tab titles are changed to the following – Once the file is saved, find and open the file. For a Household Income Change, edit the Excel tab labeled “Household Income Change” and change it to “Household Spending Change”. For a Commodity Change, edit the Excel tab labeled “Commodity Change” and change it to “Commodity Output”.
For a Commodity Change, the Commodity Output tab must be the second tab in the Excel Workbook, so add an extra tab to the beginning of the workbook (it can be completely blank).
Activities must be exported individually, so repeat these steps for all the Activities you need.
STEP 2 – UPLOADING IT TO IMPLAN
Ensure your Regions and all the Groups you will need for your analysis are set up first to minimize model running time.
Navigate to the IMPACTS screen in IMPLAN.
Click the Advanced Options icon at the top of the page, next to “Select All Events”. You will see two new options: Download Template and Upload Template
Click Upload Template.
Click Select template file.
Find the saved Excel file with your exported Activity from IMPLAN Pro.
Select the file and click Open.
The Type listed in black is the available Type for importing – this should match the Type of Activity you exported.
Check the checkbox next to the available item.
Click Save.
Your Event(s) will now be populated in the IMPACTS screen
Events will need to be dragged and dropped into the appropriate Groups – the import process will not automatically match Events to Groups, and therefore the import process will not assign any “Event Year” (now called “Dollar Year”) to the Events – this step must be done manually
Note Event types that are in orange text are not available
IMPORTING A NEW EVENT TEMPLATE IN IMPLAN:
STEP 1 – DOWNLOAD THE BLANK EVENT TEMPLATE
Ensure your Regions and all the Groups you will need for your Analysis are set up first to minimize model running time
Open the downloaded “Activity Template.xls”
Select the tab(s) with the Type of Event(s) you’d like to import
Industry Output, Employment, Employee Compensation and Proprietor Income Events can be entered in the ‘Industry Change’ tab
Commodity Output Events can be entered in the ‘Commodity Output’ tab
Labor Income Events can be entered in the ‘Labor Income Change’ tab
Household Income Events can be entered in the ‘Household Spending Change’ tab
The additional tabs are not yet available for importing into IMPLAN
Populate the selected tab(s) with the Event Input Values you’d like to use. “Event Value” corresponds to Output in the “Industry Change” tab. For information that you do not have, leave the values (cells) blank.
The Event Year will not be imported. “Event Year” is labeled “Dollar Year” in IMPLAN and must be defined in the tool within the Group(s).
Save the populated Template in a place and by a name that will be easy for you to find and identify later.
STEP 2 – IMPORT THE COMPLETED EVENT TEMPLATE
Ensure your Regions and all the Groups you will need for your Analysis are set up first to minimize model running time
Navigate back to the Impact Screen of IMPLAN
Click the Advanced Options icon at the top of the page next to “Select All Events”
Click “Upload Template”
Click “Select template file”
Find the saved Template Excel file
Select the file and click “Open”
The Type(s) listed in black are the available Types for importing
Check the checkbox next to the Type(s) you’d like to import
Click “Save”
Your Event(s) will now be populated in the Impacts Screen
Events will need to be dragged and dropped into the appropriate Groups – the import process will not automatically match Events to Groups, and therefore the import process will not assign any “Event Year” (now called “Dollar Year”) to the Events – this step must be done manually
Note Event types that are in orange text are not available
MARGINNING:
Margins can be applied in the case of Industry and Commodity Events, where applicable
If you’d like margins to be applied, populate the “Retail” column of the Template with “Yes”. This will choose “Total Revenue” (if the Sector or Commodity is marginable) within the Advanced Menu of the Event, applying Margins.
Remember, not all Industries and Commodities are marginable.
The only marginable industries are Retail and Wholesale sectors. IMPLAN has adjusted the best practices of modeling commodity purchases with margins rather than industry purchases. The only exception is for wholesale and retail industries which maintain their marginable status.
Now, when the item purchased is known, a Commodity Output Event should be modeled using the purchased item as the Specification and Margins can be applied if appropriate.
Commodities that can be purchased from a retailer are the marginnable Commodities. Find current margins 2017 COMMON (IMPLAN5) MARGINS (notice there is a different file for IMPLAN Pro).
INDUSTRY CHANGE:
Sector: This field is required. Your Sector value should be 1-536 for data years 2013-present.
Event Value: This field is optional.* This field is equivalent to Industry Output in the Event in IMPLAN and needs to be in the dollar value that is triggering the Event. Do not use a dollar sign when you enter the dollar amount in this field as this could cause errors on import.
Employment: This field is optional.* If you know the Employment associated to your impact, you will want to enter it in this field. If you leave this field blank, IMPLAN will estimate the Employment value based on Output per Worker values for the selected Sector.
Employee Compensation: This field is optional.* If you know the value of Employment Compensation paid in your Event, you will enter that value here. Again, do not use a dollar sign when you enter the dollar amount in this field as this could cause errors on import.
Proprietor Income: This field is optional.* If you know the value of Proprietor Income paid in your Event, you will enter that value here. Do not use a dollar sign when you enter the dollar amount in this field as this could cause errors on import. If you know that no Proprietor Income is paid by your Event, enter “0” here.
*While each of these four fields is optional, at least one of these them (Event Value, Employment, Employment Compensation, or Proprietor Income) will require an entered value. IMPLAN will estimate the value of the remaining fields based on the value you enter into the template. If two or more fields contain information, IMPLAN will estimate the remaining values based on the entered Event Value.
Event Year: This field is will not be recognized by IMPLAN and can be left blank. A Dollar Year will need to be determined in the Group on the Impact screen and should reflect the value of the dollars or the year of the jobs you are entering into the other Event fields.
Retail: This field indicates to IMPLAN whether or not Margins should be applied to the Event value. The capitalization of the word is important – ‘Yes’ is entered if you want Margins applied to your Event value. A retail selection must entered for every Event line.
Local Direct Purchase: By default this field is 100%, and you will not want to change this value unless:
You are working with a sales value that doesn’t all occur within the Study Area (e.g. Big Box X did $80MM in sales this year in North Carolina, of which 18% was in my county (Event Value = 80MM, Local Direct Purchase = .18).
You are using an Industry Change Activity type but are modeling budgetary spending (i.e. first round Indirect Expenditures).
COMMODITY OUTPUT:
Sector: This field is required. Your Sector value should be 3001-3536 for data years 2013-present.
Event Value: This field is equivalent to Industry Output in the Event in IMPLAN and needs to be in the dollar value that is triggering the Event. Do not use a dollar sign when you enter the dollar amount in this field as this could cause errors on import.
Event Year: This field is will not be recognized by IMPLAN and can be left blank. A Dollar Year will need to be determined in the Group on the Impact screen and should reflect the value of the dollars or the year of the jobs you are entering into the other Event fields.
Retail: This field indicates to IMPLAN whether or not Margins should be applied to the Event value. The capitalization of the word is important – ‘Yes’ is entered if you want Margins applied to your Event value. A retail selection must entered for every Event line.
Local Direct Purchase: By default this field is 100%, and you will not want to change this value unless you are working with a sales value that doesn’t all occur within the Study Area (e.g. Big Box X did $80MM in sales this year in North Carolina, of which 18% was in my county (Event Value = 80MM, Local Direct Purchase = .18).
LABOR INCOME CHANGE:
Sector: This field is required.
5001 – Employment Compensation is selected if you are working with a value paid to wage and salary workers
6001 – Proprietor Income is selected if your entered value represents payments to sole proprietors or business partners
Labor Income: This field is required. The dollar value paid to Employment Compensation or Proprietor Income should be entered. Do not use a dollar sign when you enter the dollar amount in this field as this could cause errors on import.
Event Year: This field is will not be recognized by IMPLAN and can be left blank. A Dollar Year will need to be determined in the Group on the Impact screen and should reflect the value of the dollars entered into the Labor Income field. This will typically be the year of the labor payments.
Local Direct Purchase: This field is required. By default this field is 100%, and you will not want to change this value unless you are working with an income value that wasn’t all paid within the Study Area (e.g. Big Box X paid $80MM in Employment Compensation this year in North Carolina, of which 18% was in my county (Event Value = 80MM, Local Direct Purchase = .18)). This is different from commuting rates, which should be calculated outside of the Model.
HOUSEHOLD SPENDING CHANGE:
Sector: This field is required. The following Household Sectors are available. Descriptions are provided here for guidance, but only the numbers (10001-10009) should be entered into the field.
Household Expenditures: This field is required. The dollar value of Household Income should be entered. Do not use a dollar sign when you enter the dollar amount in this field as this could cause errors on import. Household Income implies a value that includes income tax and savings but does not include payroll taxes of benefit values.
Event Year: This field is will not be recognized by IMPLAN and can be left blank. A Dollar Year will need to be determined in the Group on the Impact screen and should reflect the value of the dollars entered into the Household Income field. This will typically be the year of the Household Income.
Local Direct Purchase: This field is required. By default this field is 100%, and you will not want to change this value unless you are working with an income value that wasn’t all paid within the Study Area (e.g. Big Box X paid $80MM in dividends this year in North Carolina, of which 18% was in my county (Event Value = 80MM, Local Direct Purchase = .18).
SPENDING PATTERNS:
Currently, spending patterns can’t be uploaded into IMPLAN. We have several improvements and expansions planned for this template as we work to include things like Spending Patterns, Regional Definition, and more. Stay tuned!
More and more people are interested in the economic impact of tourism – how guests in a region spend their money when visiting. The World Travel & Tourism Council estimates that one in ten jobs are related to tourism, so it’s no wonder that governments and economic development organizations are interested in the local and regional effects. Public money is invested not only in infrastructure and improvements to encourage tourism, but also on large marketing campaigns domestically and internationally.
Tourism is of great interest to many regions of the country. In impact analysis, tourism is unique among export activities. Exports are typically thought of as goods or services shipped by local businesses to purchasers located outside the region. Tourism, on the other hand, involves purchasers traveling into the region to acquire goods and services from local businesses. Tourism is most often classified by the activities in which non-locals participate: film festivals, fall colors, professional sporting events, historical sites, conventions, and so forth. Lodging, restaurants, retail, and recreational services typically rely upon this kind of export as key to their success. Because tourism comprises a wide variety of activities and types of businesses, there is no single “Tourism” sector for modeling impacts.
Stynes (n.d.) poses just a few of the questions that an economic impact analysis of tourism spending can help the analyst answer:
How much do tourists spend in the area?
What portion of sales by local businesses is due to tourism?
How much income does tourism generate for households and businesses in the area
How many jobs in the area does tourism support?
How much tax revenue is generated from tourism?
KEY CONSIDERATIONS:
DEFINING TOURIST
For an impact on the state, anyone traveling from outside would be considered a tourist. Why do we only include non-local tourists in the analysis? Sales to final demand are the classic activities modeled by input-output analysis. These sales (direct effects) result in new production of goods and services that initiate a chain of economic events in the region (indirect and induced effects). While local residents may spend money at these tourist attractions, their expenditures are not typically counted in tourist studies because if those tourist attractions did not exist, the residents would likely still spend that money locally. If they didn’t go to the festival, they might have spent their money bowling or at the movies. That said, a case can sometimes be made for including resident spending on tourist attractions if the study area is very small and has few alternatives for recreation, such that the existing tourist attractions keep residents’ money from leaking to other places (i.e., they keep residents from traveling elsewhere for their recreational pursuits). This is known as import substitution – someone doesn’t have to go to Nevada to gamble if their state legalizes the industry – so the money is no longer leaked out of the local economy.
TOURIST TYPES
There are many different ways to segment tourists. For example, a single individual traveling for the biannual MCRSA/IMPLAN Conference will spend money very differently than a family heading to camp in a National Park. Also, domestic tourists and international tourists are also likely to spend very differently. Consider segmenting your groups to model different kinds of tourists separately. In general, keep these differences in mind when collecting data or analyzing data given to you. Some helpful tips are available in the article about Surveying for Input-Output.
HOW TOURISTS SPEND
Based on the parameters of the tourist survey or the source of our tourist spending data, we may not know if the responses reflect the same purchasing patterns as our local tourists, or if responses were constrained to only describe local purchases. In this case, Local Purchase Percentage (LPP) could be customized to ensure our impacts were conservative and to reflect the idea that tourist purchases in the region follow a pattern like resident purchases regarding locality.
TEMPORARY SPENDING
Tourist spending is likely somewhat more volatile than operational spending. Although it is projected to grow, influences like consumer preferences, generational differences, political climate, and economic conditions are changing the way people travel (Tour Writer, n.d.). Keep these considerations in mind when using older survey data or trying to predict too far into the future.
PREPARING DATA FOR IMPLAN:
Very simply, a study of tourist spending looks at how visitors spend money in a local economy. We are either given data on tourism spending by or must survey visitors to obtain a breakdown of their spending.
Let’s say we want to look at the economic impact of 100 people visiting an amusement park in California for the day. We are given survey results that show each person spends an average of $50 on gasoline, $25 on snacks, $150 in restaurants, and $200 on amusement park tickets, and $75 on retail merchandise, for a total of $500. We can model these through an analysis by assigning one of the IMPLAN Sectors to each of the spending categories and inputting the totals. Since we know what items people were purchasing, but not necessarily from what businesses they bought, we use Commodities.
For the gasoline, we can only assume that about half of that money would stay in the state economy; as some portion is likely leaking to other states on their road trip. To adjust for this, set the Local Purchase Percentage (LPP) to 50%. In our example, the table above is all local spending expect for the gasoline, so for each of our Commodity Events,, LPP will be left at 100%.
For the retail spending, we asked the guests what they spent while in town for the event, so we need to think about margins. The prices that were paid at stores represent Purchaser Prices or Total Revenue, so we need to check the box for Total Revenue to tell the model that to convert these to Producer Prices or Marginal Revenue before applying the Multipliers.
Note that for gasoline we will use the producing Commodity (3156 – Refined petroleum products) even though there is a retail gas station sector in IMPLAN. The reason for this is that we know exactly what was purchased from the retailer in this case (gasoline and oil) and can thus identify the producing sector (Refined petroleum products), whereas in the other retail spending categories we don’t know exactly what was purchased and thus cannot identify the producing sector. For example, we don’t know what Retail consisted of and therefore do not know how to choose between the various manufacturing sectors (tshirts, mouse ears, postcards, etc.). Thus, in this latter case the best we can do is capture the retail margin portion of the purchase, whereas in the case of gas and oil we can also capture some of the producer value (if there is a local producer), as well as the transportation and wholesale margins, in addition to the retail margin. While you could use the retail gas station Commodity (3402 – Retail services – Gasoline stores), you would only capture the retail margin.
Sometimes we need to rely on older survey data for the analysis. We might have a survey that reflects tourist spending in 2009, but we are looking to estimate the impact of tourists in our region in 2019. Since the survey is vintage 2009, the Event Year should reflect that the entered dollar values are 2009 dollars (i.e. Event Year = 2009). If we want to see the economic impact of tourist spending in 2019, we can use the Dollar Year for View on the Results page to adjust the values to 2019 dollars.
Deflators are specific to the dollar value of the investment or expenditures, it is important to ensure that the Dollar Year reflects the dollar value being entered. Because the model’s relationships are all based on the year of the data set or the Data Year (for this example, 2017), dollar values for years other than 2017 must be adjusted to 2017’s prior to those values being applied to the multipliers. This conversion is done by IMPLAN’s built-in deflators. Deflators are units of measure, not descriptions of when an Event is taking place.
THE PROCESS:
Now we are ready to put the data in IMPLAN. Create the California Region and add each line of spending as its own Commodity Output Event. In our example, we have the per person spending, so we enter that in the Event line. Then on the right side of the screen, we use the Scaling option to reflect the 100 visitors. Alternatively, we could multiply each of the Commodity totals by the 100 visitors to get the same result.
THE RESULTS:
In this example, we had 100 visitors to California, each spending $500. We used data from 2017 and are viewing the results in 2019 dollars. We also put in $75 per person in Sector 3405 – Retail services – General merchandise stores, which only captures the retail margin. Therefore, we see the total Direct Output as slightly less than the $50,000 in spending.
We can also see the large Direct Output Impact in Sector 494 – Amusement parks and arcades and Sector 501 – Full-service restaurants, which is to be expected from the large per person spending in these categories.
TIPS FROM THE WEB:
Neffke, F., Ravinutala, S., & Zuccolo, B. (n.d.). Tourist Spending Insights Provide Unprecedented View of Global Tourism. Retrieved from
Surveys are a great way to gather information about a group of people. Surveys are also a fantastic method for gathering information to use as data for input-output analysis. You may want to glean spending by students at a university or visitors to a sporting event. Gathering primary survey data can be an invaluable piece of your IMPLAN analysis.
KEY CONSIDERATIONS:
When designing a survey, remember to think through a few important considerations. The Five Ws are a great way to outline your analysis.
WHY
The first question to ask is why the study is being performed to frame your entire survey design. Knowing what you or your client is interested in learning from the project will guide you in the process. Perhaps they are only interested in spending by international visitors or students. Maybe they only want to know about spending on recreation and amusement facilities.
WHO
Who will you be surveying? You need to ensure that you are only gathering data from those that fit into the profile of those you want. For example, surveying people that are on a college campus does not necessarily mean that they are college students. Also, when looking for tourist spending, expenditures of local residents should not be included unless you are only looking at an Industry Contribution Analysis. You will want to ensure you collect enough surveys to have statistically significant results. A simple Google search for survey sample size calculator or your favorite statistics book can help you determine how many surveys you will need to collect.
WHERE
The next consideration is where the survey will be administered. While studies are often done on-site and via mail, in recent years, web surveys have grown dramatically in popularity. Determine what data collection method works for your team and your budget.
WHEN
Next, you need to decide when the survey will be administered. Think about the best time to survey your population. If you want to look at tourists visiting an amusement park, a rainy day might not be your best choice. Perhaps the best option is to find people at a large event like the Superbowl or a national political convention. Students on a university campus might be around at the start of September, but consider waiting until the end of the first semester to ensure that they have a good grasp on where their money is being spent. Picking the best time to get the most responses is very important.
WHAT
The final piece is the hardest part of the design process. What should we ask? Here are a few things to keep in mind when designing your survey questions.
Keep it short – people lose interest pretty quickly
Ask questions that aren’t too personal – no one wants to share their annual salary with a stranger
Ensure that your questions are easy to understand – think 8th grade reading level
Avoid bias in your questions
Use questions you can quantify
You’ll want your survey responses to easily translated into IMPLAN inputs in terms of Sector and Event Value(s). The questions should be framed in a way that it is obvious how much was spent locally on each type of purchase.
Limit the use of open-ended questions
Consider adding in a few questions at the end of your survey to add commentary to your analysis
Did you enjoy the city/event?
What surprised you?
What could the event organizers improve?
Will you come again next year?
Remember, don’t get too caught up in all the details of exactly how each person spent their money. Asking too many questions increases the likelihood that people won’t finish the survey.
So you are ready to start writing your survey questions. The key is to think through all the possible ways that your population might spend money and then prioritize the most important pieces for your survey, being careful not to ask too many details. Here are some examples of data points you may want to collect.
Student Spending
Tuition – remember not to count this under both student and university spending
Books
From bookstore
From online retailer
Housing
On-campus
Off-campus
With relative
Transportation
Gasoline
Parking
Repairs
Public transit
Food & beverages
Alcohol (it’s college, right?)
Recreation & amusement
Retail
Local retailer
National retailer
Online retailer
Tourist Spending
Lodging
Hotel
Airbnb
Transportation to the city
Flight
Train
Car
Transportation within the city
Bus
Ride sharing
Rental car
Gasoline
Food & beverages
Retail
Local retailer
National retailer
Recreation & amusement
Business Spending
Employment
Employee Compensation
Proprietor Income
Sales/Output
Revenue
Be sure to include any limiting questions in your survey to exclude data from those that are not part of the interested population. You may consider asking questions to segment your sample by gender, age, or another factor. In this case, you may need to collect more surveys to ensure you have a statistically representative sample for each segment you want to measure.
PREPARING SURVEY DATA FOR IMPLAN:
Now we can construct an outline for visitor spending. First, we need to tally up the results of the survey and create an average spend by category. Be sure to look for any outliers in your data. Perhaps one person spent $25,000 on a flight from Korea for the golf event; consider modeling these extreme outliers separately. With the remaining data, create an average spend per Sector.
Next, calculate the average number of days each visitor stayed in town for the Big Game. Keep in mind that visitors that drive in for the day will spend significantly less than guests that stay overnight, so consider splitting day and overnight guests in your analysis.
Now estimate the total number of visitors. This may be available from the event organizer, total ticket sales, stadium capacity, or previous event estimates.
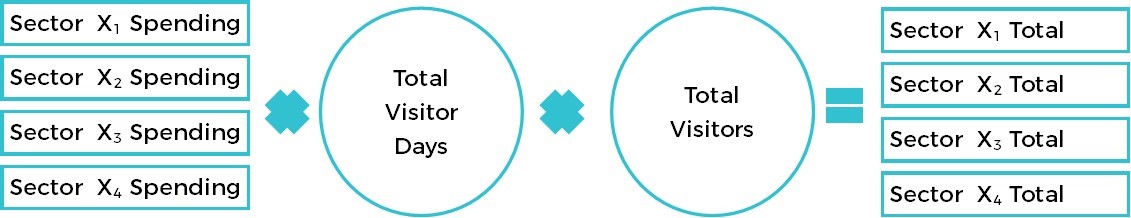
Finally, multiply across to get totals for each Sector by taking the per person spending x the total visitor days x total visitors.
Alternatively, you can let IMPLAN do this math for you by using the Scaling feature within the Advanced Menu of your Group. Individual Events can be scaled as well as an entire Group.
THE PROCESS:
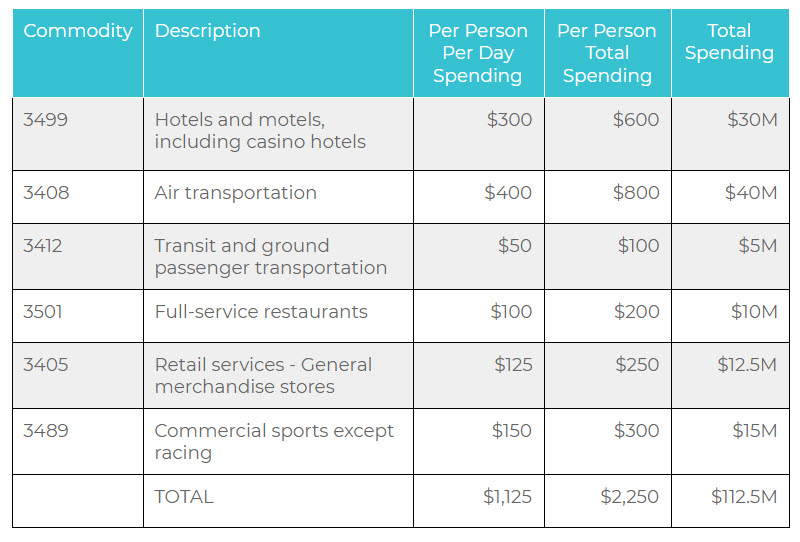
Based on our survey data, we can now put our Events in IMPLAN. In our example, let’s say we are going to model the visitor spending for the Big Game that was held in Charlotte on the entire state of North Carolina. We have a per person spending profile of $1,125, we know that each person stayed on average two days, and we know there were 50,000 guests in for the game.
Since we know what items and services people were purchasing, but not necessarily from what businesses they bought, we use Commodities. Below is the total spending profile:
Now we are ready to put the data in IMPLAN. Create the Region and add each line of spending as its own Commodity Output Event. In our example, each line of spending could be entered with the third column values above as the Event Value and the Scaling could be left at 1, or we could enter the first column values as the Event Values then Scale the entire Group by 10,000 (2 days * 50,000 guests).
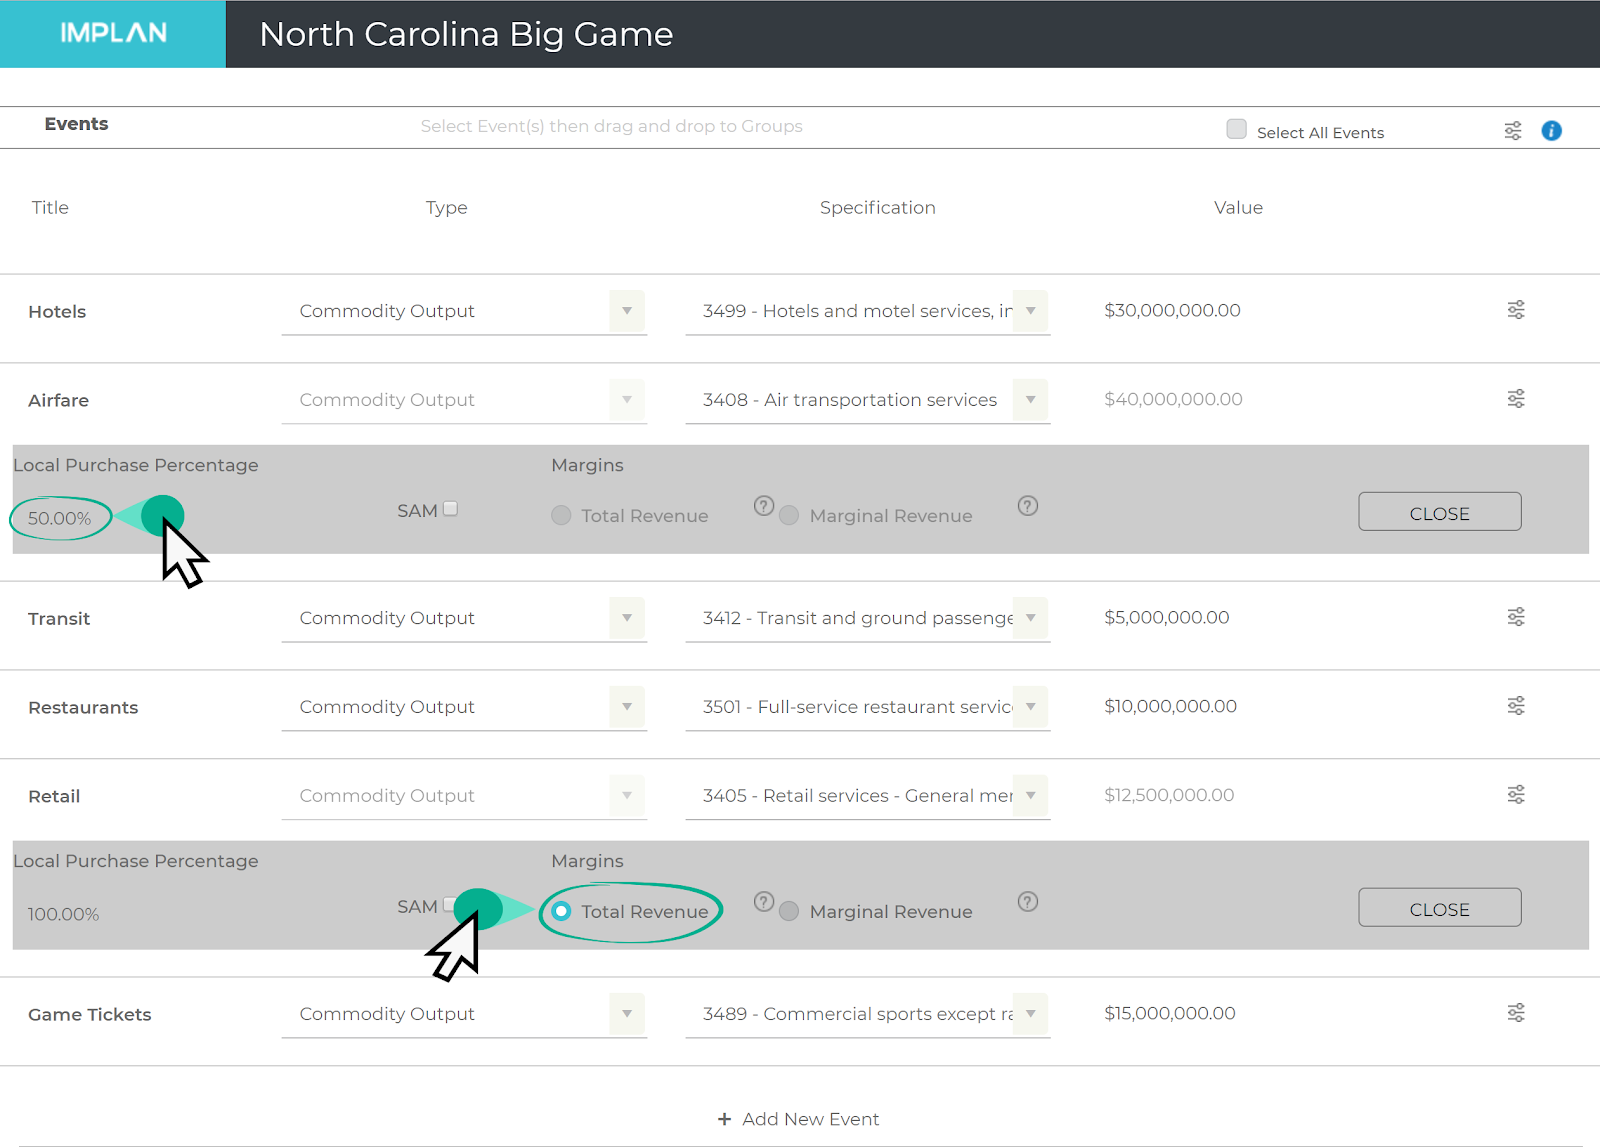
There are a few additional considerations as highlighted in gray. For the airfare, we can only assume that about half of that money would stay in the state economy; the other half likely leaks to their home airport. To adjust for this, set the Local Purchase Percentage (LPP) to 50%.
If the survey has been designed appropriately, dollars spent locally should be easily determined. In our example, the table above is all local spending expect for the airfare, so for each of our Commodity Events other than the airfare Event, LPP will be left at 100%.
For the retail spending, we asked the guests what they spent while in town for the event, so we need to think about margins. The prices that were paid at stores represent Purchaser Prices or Total Revenue, so we need to check the box for Total Revenue to tell the model that to convert these to Producer Prices or Marginal Revenue before applying the Multipliers.
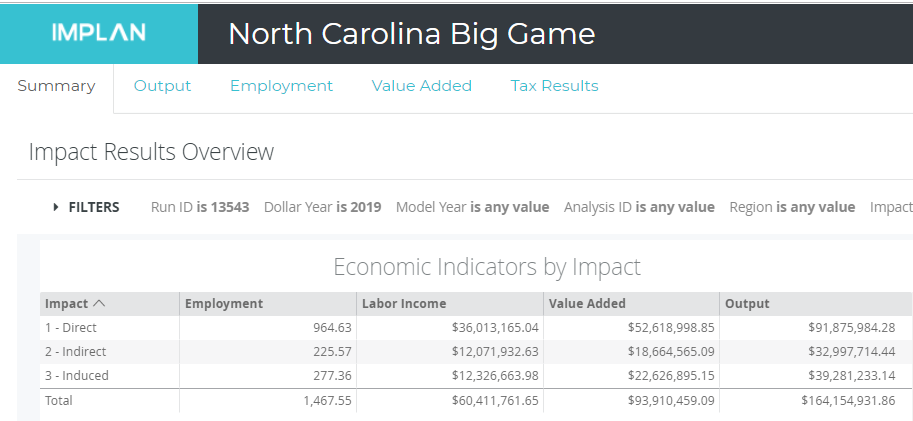
Now click on View Results and we see the economic impact of visitor spending at the Big Game in North Carolina.
SECONDARY DATA
If you can’t administer a survey, there are many great estimations available from convention and visitor’s bureaus and tourism boards. Many states, organizations, government departments, and others conduct their own surveys every year on average visitor spending by major category. This data can be used in conjunction with a bit of knowledge about the scale of your event.
REMEMBER TO SHARE
Remember to always give detailed information about your methodology in your report. This allows people to understand your assumptions and potentially replicate your study so they can fact check your results.
Sometimes the Industry that we want to examine does not exist in our study Region. The Industry might be new to the area. It also might be a new Industry altogether. It also might be an industry that only recently became legal. This article outlines the best way to model these new Industries in IMPLAN.
DETAILS:
The economy is always changing and Industries come and go. Federal data follows these changes by adjusting the North American Industry Classification System (NAICS) codes. IMPLAN follows suit, so when the NAICS codes change, so do IMPLAN Sectors.
There are two ways to create a new Industry depending on what you want to accomplish. Both methods are outlined below.
INDUSTRY THAT EXISTS IN THE US:
If you have a Region that will be gaining an Industry that does exist somewhere in the US, you can follow the steps outlined in the article Adding an Industry by Customizing a Region.
BRAND NEW INDUSTRY:
Federal data lags in categorizing these new Industries, which can pose a problem for researchers. When the newest widget is invented, it is usually categorized under with a similar product or under one of the catch-all codes like “all other…” One interesting case is that of the legalization of cannabis production and sales. Canada has already outlined the NAICS codes for the entirety of the cannabis Industry: Classifying Cannabis in the Canadian Statistical System.
Depending on what part of the supply chain we want to examine, we find the most similar NAICS or IMPLAN code and edit the Industry Spending Pattern for that Industry. In the cannabis example, we may want to model the agricultural impact using one of these Industries: 2 – Grain farming; 6 – Greenhouse, nursery, and floriculture production; or 7 – Tobacco farming. The manufacturing might fall under Sectors 111 – Tobacco product manufacturing or 173 – Medicinal and botanical manufacturing. Finally, the retail component will fall under 406 – Retail – Miscellaneous store retailers.
Let’s say we want to examine the effect of a $100M in cannabis agricultural production in Ohio and we know that a full $5M of that will be spent on legal fees. We also know there will be 25 employees each making $50,000.
First we have to decide what Sector we want to use. In this case knowing the climate in Ohio, we make the assumption that the agriculture will be most closely related to IMPLAN Sector 6 – Greenhouse, nursery, and floriculture production.
Create an Industry Spending Pattern Event for $100M in Sector 6. If we know more details about the spending of cannabis growers as compared to other greenhouse products, we can edit the spending pattern to further reflect this new Industry. Remember in this example we know that $5M will be spent on legal fees specifically. To model this, we click the Advanced button to open the details of the Industry Spending Pattern and scroll down to Commodity 3447 – Legal Services. Next, we override the value with 5%; the dark blue color shows the edited Commodity. If any further information is known including Sectors that could be deleted entirely from the Spending Pattern, that can be done at this point as well. More details on this can be found in the articles Editing Industry Spending Pattern Events or Editing Institutional Spending Pattern Events.
You’ll notice that the Sum of Percentages at the bottom is now 104.9%.
To fix this and return to 100%, click on the Advanced button and choose Normalize.
Now, a full 5% will be spent on legal fees. Make sure to choose Total Output (instead of Intermediate Expenditures). Remember: Output = Intermediate Expenditures + Value Added.
Next, we create a second Event for our Labor Income (25 employees x $50,000 = $1,125,000). We can then add them to our Group and Run our economic impact.
Notice that there are no Direct Effects in our Results so we will need to add those back in manually. We know our total Output is $100M and our Labor Income is $1,125,000 with 25 employees. Now we need to navigate back to our Regions screen and click
Study Area Data >
Regions Industry Summary
Here we can find IMPLAN’s known totals for Sector 6 – Greenhouse, nursery, and floriculture production. Calculating the ratio of the overall Value Added to the overall Output shows that VA is, on average, 65% of the total Output. Therefore, we multiply $100M in Output by 65% to yield a Direct Value Added for this project of $65,620,927. The template for these calculations is here.
https://implan.com/wp-content/uploads/Market-site-Logo-resized-2-1.jpg00Adam Smithhttps://implan.com/wp-content/uploads/Market-site-Logo-resized-2-1.jpgAdam Smith2019-10-24 15:05:372019-10-24 15:06:36Adding an Industry that Doesn’t Exist Yet


 HOUSEHOLDS:
 INDUSTRIES:
 GOVERNMENT:
 CONSTRUCTION:


 Student Spending
 Tourist Spending
 Business Spending