An Industry Event is appropriate when your goal is estimating the effect of a production change and the industry experiencing the change is known.
There are four types of Industry Events:
Industry Output
Industry Employment
Industry Employee Compensation
Industry Proprietor Income
These four Events Types behave in very similar ways. You should pick from one of these four Events based on which value you have available: Output, Employment, Employee Compensation or Proprietor Income, as this selection determines the appropriate value you should enter as your Event input Value, but the three other Values can be provided additionally through the Event Advanced Menu if they are also known.
Backward linkages are the interconnection of an industry to other industries from which it purchases inputs to produce its output.
Each industry purchases Commodities from Industries to operate their business, which generates the initial round of backward linkages for each industry. Each cell in the matrix below represents a payment from the Sector column to the Commodity row. In other words, the dollars spent by a given Industry to purchase operational Inputs is represented by the columns in the matrix below. These dollars are referred to as Intermediate Expenditures. IMPLAN’s data source on Input purchases by Industry is only available at the National level. IMPLAN is an annual model so the input-output data in the matrices will be based on a given year. Intermediate Expenditures for each Industry can be converted to a Spending Pattern by dividing each expenditure by the total value of all Intermediate Expenditures for the given Industry, producing a percentage for each Intermediate Expenditure or the Gross Aborsportion that sum to 100% for the given Industry.
HOW ARE SECTOR PRODUCTION FUNCTIONS ARE REGIONALIZED:
Industries of course spend money on things other than Intermediate Expenditures. The Production Function of a Sector in IMPLAN determines how a Sector will allocate Output to continue to operate. To complete each Sector’s Production Function, we’ll need to incorporate the other production values. Industries must pay taxes. They also require Labor to create the final good or service. The Production Function also leaves room for profit to be earned and to cover things like the purchase of equipment. These additional factors of a sector’s Production Function are called Value Added. The combination of a Sector’s spending on Value Added and Intermediate Expenditures equals the Sector’s Total Output. IMPLAN collects sub-national data on Valued Added and Total Output by Sector.
Using regional dollar values for Total Output and Value Added for each Sector, a Value Added Coefficient can be calculated (Value Added / Total Output). Knowing the Production Function represents 100% of the distribution of total Output for a Sector, this regional Value Added Coefficient is used to adjust the National Spending Patterns so that the sum of the coefficients allocated to each Commodity purchase, Total Gross Absorption, plus the Value Added Coefficient, equals 100%, while maintaining the ratio of the Commodity purchases to one another.
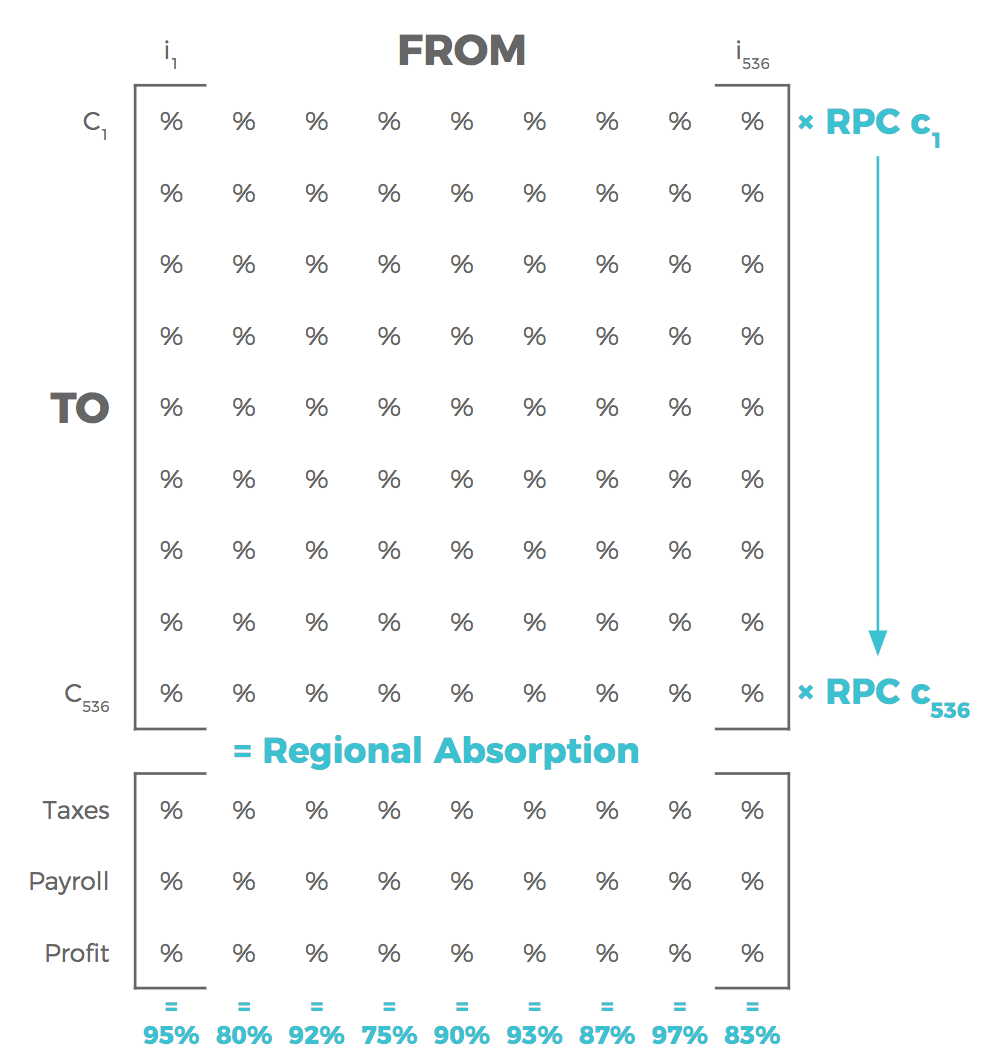
These regionalized Spending Patterns are further regionalized by converting Gross Absorption to Regional Absorption. The Commodities purchased by each Sector cannot all be sourced from within a closed economy; some Commodity purchases are imported from other regions. Therefore, each Commodity has a model-specific Regional Purchasing Coefficient.
Multiplying each Gross Absorption for a Sector by the Commodity’s RPC produces the Regional Absorption for the Sector and Region. The sum of Regional Absorption and the Value Added Coefficient for each Sector will be less than 100%. Because an RPC tells us how much demand is sourced locally, 1 minus the RPC tells us how much demand will be sourced non-locally, according to the model for each Commodity. You can think of this 1-RPC value as the import rate of the Commodity in the Region. The difference between 100% and the sum of Regional Absorption and Value Added for each Sector is the portion of dollars IMPLAN will model as leaving the Region when the effect of production in each Sector is analyzed. Dollars that model does not continue to circulate through the Region’s economy are considered leakages. The import of Commodities is one form of leakage.
CONVERTING COMMODITIES TO INDUSTRIES:
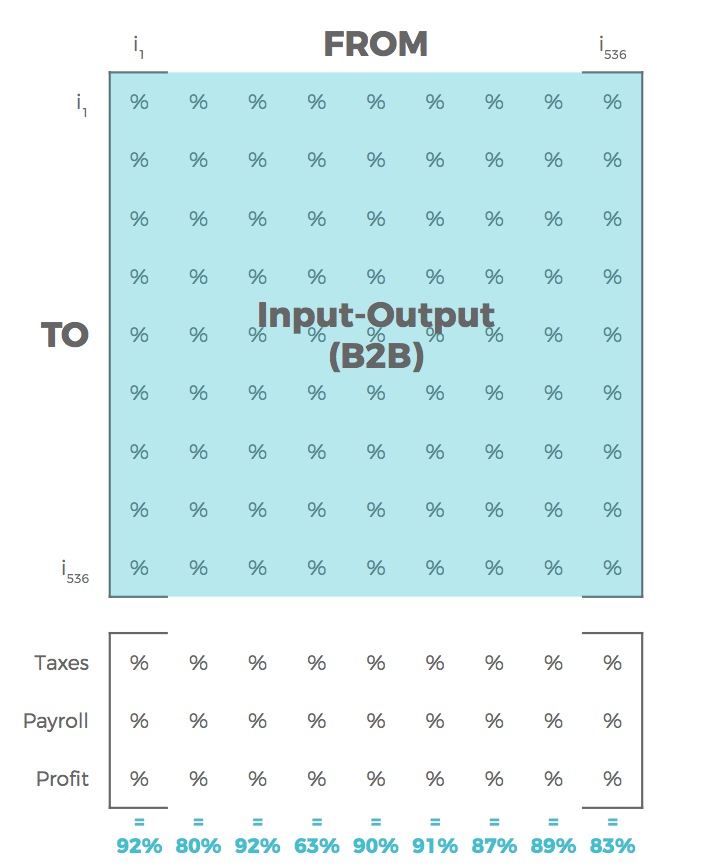
Recalling the definition of backward linkages, these linkages are from Industries to other Industries, but our matrices currently maps Industry’s purchases of Commodities, so IMPLAN converts Commodities to Sectors. This is another way in which regionality is factored. Commodities in IMPLAN are numbered 3001 through 3536 to distinguish them from Sectors. The Sector number for the primary producer of a Commodity can be translated by removing 3000 from the Commodity number, but Commodities can be sold/purchased from multiple sources. For some Commodities there are multiple producers and some Commodities can be stored in inventory and sold in a later year. Therefore, Commodity Output can be tied to production by a Sector or Sectors, and/or sales by an Institution (which includes inventory). The sum of the sources of a Commodity is called Commodity Supply. The portion of Commodity Supply that comes from each of these sources is called a Market Share. These Market Shares are based on the Commodity value from each source divided by the total value of the Commodity Supply. The Commodity value from each source and the Commodity Supply are specific to the Data Year and Region. Therefore, to convert the Regional Absorption for each Commodity to be Sector based, the Regional Absorption is distributed to the suppliers of the Commodity based on the Market Shares (found in Region Details > Social Accounts > Balance Sheets > Commodity Balance Sheet > Industry-Institutional Production). Through this conversion, the y-axis will become Sectors 1 through 536 and a new Sector based Spending Pattern is produced for each Sector. A Sector could be producing more than one Intermediate Expenditure Commodity, meaning they may make up some of the Market Share for more than one Commodity in a given Sector’s Spending Pattern. The portion of production dedicated to producing each commodity in a given Sector is called a Byproduct Coefficient (found in Region Details > Social Accounts > Balance Sheets > Industry Balance Sheet > Commodity Production).
Market Shares allocated to Institutions will not be modeled as continuing to circulate through the Region’s economy, treating these portions as a leakage.
The leakage due to institutional sales further decreases the sum of the Production Function for each Sector. This conversion makes the top matrix a true business to business Input-Output Matrix.
EXPANDING THE MODEL:
The Income earned by individuals working to produce a sector’s output also affects the economy when that Income Is spent. Incorporating these effects classifies the IMPLAN model as a Social Accounting Matrix (SAM) Model.
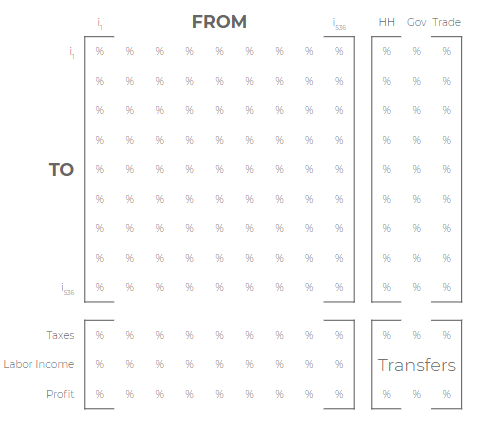
To incorporate Households and Institutions into the model, an additional matrix for Final Demand is added. Final Demanders are, by definition, Institutions. Final Demand is the value of goods and services produced and sold to final users to meet demand, whether it is local demand or an export. Final Demand for the Region can be found in the Region Details > Overview > Final Demand table.
Particularly in the case of government purchases, some of these purchases can be incorporated in creating some other good or service, such as materials purchased to build a new highway.
To determine how payroll transitions from compensation to disposable income, a final fourth matrix is added, completing the larger matrix. Considering the spending of Income allows for further regionalization of the model. The full cost of Labor is called Labor Income in IMPLAN.
Not all dollars earned by an individual or household are spent by the household. There are several ways in which some dollars earned leak out of the model. All Labor Income, regardless of which sector it was earned in, cycles through the model in the same way. The Employee Compensation and Proprietor Income columns, summing together to be Labor Income, make payments to the rows. Converting these column values from dollars to percentages of the column total gives us a pattern for the region and year that reflects the transfer of dollars earned as Labor Income to Household Income dollars.
Labor Income is distributed to the Household Income groups based on the percentage each of type Labor Income paid to each Household Income Group. Labor Income also makes payments to the Federal Government and may make payments to the State and Local Government depending on the Region. These are the payment of Payroll Taxes from Labor Income. Again, since we don’t know how, where, or when the government will use fiscal revenue, taxes paid are treated as a leakage and do not continue to circulate in the Region’s economy in the model.
The region specific in-commuting rate is also applied to Labor Income paid to wage and salary workers to leak income earned by non-residents out of the model. The in-commuting rate is the portion of Employee Compensation that will be estimated to leak out of the Region due to employees earning income within the Region, but commuting home, outside of the Region, where they spend their money (Region Details > Social Accounts > I x C Social Accounting Matrix > I x C Aggregate SAM > EC column, Foreign and Domestic trade rows divided by column total). These columns will always be blank for Proprietor Income as it is assumed to be earned by residents of the Region.
Income earned by Households locally is distributed to IMPLAN’s nine Household Income groups (categorizing ranges of income).
The journey of Household Income, the payment to Household rows from Labor Income, continues in the Household columns. Household Income primarily makes a payment to Commodities. Households also transfer money to other households. Personal taxes are reflected as the payment to government rows from the Household Income Group columns. Savings of household income is reflected as the payment to the Capital row from the Household Income Group columns. Converting these column values of payments to government and capital to percentages of the column totals gives us the effective Personal Tax and Savings rates, respectively.
We can break down the purchase of Commodities for each Household Income Group in Region Details > Study Area Data > Household Commodity Demand. Converting each Household Income group column from dollars to percentages of the column totals give us the Spending Pattern for each Household Income group. Like Sectors’ purchases of Commodities, the amount of each Commodity purchased by households that will be modeled as a local purchase is also determined by the Commodity’s RPC. Applying the average RPC for each Commodity would reflect the local spending per dollar of Household Spending on each Commodity. This information is reflected in dollars in Region Details > Social Accounts > Reports > Household Local Commodity Demand. The Commodities purchased by Households are converted to purchases to Sectors also using the Market Shares.
https://implan.com/wp-content/uploads/Market-site-Logo-resized-2-1.jpg00Adam Smithhttps://implan.com/wp-content/uploads/Market-site-Logo-resized-2-1.jpgAdam Smith2019-10-24 16:17:452019-10-24 16:17:57Sector Production Functions in IMPLAN
Industry Contribution Analysis is a method used to estimate the value of a Sector or group of Sectors in a region, at their current levels of production. For more information, visit the article Introduction to Industry Contribution Analysis.
Induced effects stem from household spending of labor income, after removal of taxes, savings, and commuters. It represents the response by an economy to an initial change (direct effect) that occurs through re-spending of income received by a component of value added. IMPLAN’s default multiplier recognizes that labor income (employee compensation and proprietor income components of value added) is not a leakage to the regional economy. This money is recirculated through the household spending patterns causing further local economic activity.
Note that IMPLAN models account for commuting patterns; thus, induced impacts will only reflect the spending of wages from residents. IMPLAN removes payroll taxes, personal taxes, and savings before allowing the remainder to be spent on goods and services. IMPLAN also accounts for imports and does not assume that all purchases of goods and services are made within the study area.
Ratios that show the production required of an industry and of all other industries to meet that industry’s initial demand for production. The coefficient can be calculated as the total requirements matrix less the identity matrix less the direct requirements matrix. (BEA)
North American Product Classification System. A comprehensive demand-oriented product classification system that is being developed by the United States, Canada, and Mexico. NAPCS is designed to complement NAICS, the supply-oriented industry classification system introduced for 1997. In particular, NAPCS will focus on improving the identification, definition, and classification of the products produced by the services industries. (BEA)
All IMPLAN Value Added data are ultimately controlled to National Income and Product Accounts (NIPA) data published by the Bureau of Economic Analysis (BEA).
Other Property Income (OPI) and Taxes on Production and Imports Net of Subsidy (TOPI)
Initial estimates of national TOPI by IMPLAN sector are generated by applying TOPI/Output ratios from the latest BEA Benchmark I-O table to current Output estimates. Initial estimates of national OPI by IMPLAN sector are generated by subtracting Intermediate Expenditures, Employee Compensation (EC), Proprietor Income, and TOPI from Output. These first estimates of national TOPI and OPI by IMPLAN sector are then controlled to the BEA’s GDP-by-industry data, after projecting to the current data year.
To distribute the national data to the states, we turn to the BEA’s GDP by State data. State-level OPI-to-EC and TOPI-to-Employment ratios are used with each county’s EC and Employment estimates for each IMPLAN sector to calculate county-level first estimates of OPT and TOPI by IMPLAN sector. County-level OPI and TOPI estimates by IMPLAN sector are then forced to sum to the state level OPI and TOPI estimates.
https://implan.com/wp-content/uploads/Market-site-Logo-resized-2-1.jpg00Adam Smithhttps://implan.com/wp-content/uploads/Market-site-Logo-resized-2-1.jpgAdam Smith2019-10-24 16:01:582019-10-24 16:02:13Estimating and Distributing Value Added
Labor Income (Employee Compensation and Proprietor Income)
BLS’ CEW is our primary source of employment and income data; however, CEW data excludes some Sectors1 and does not include proprietors, proprietor income, employer-paid taxes (social insurance, unemployment), or benefits such as health and private retirement. CEW data will have some non-disclosures (i.e., sectors for which wage and employment data are not revealed). To get employment estimates for these, we use the Census Bureau’s County Business Pattern (CBP) employment data. Since CBP does not provide data on wages, we use state-level wage per worker ratios together with the county-level CBP employment data to get county-level wage estimates.
Finally, we turn to the BEA’s REA data series to get estimates for Employee Compensation (i.e., fully loaded payroll), Proprietor Income and Employment, and the sectors missing from CEW. Due to the REA data being lagged one year and in a more aggregate sectoring scheme, the CEW data are used to project the REA data to the current data year and to distribute them to the 536 IMPLAN Sectors.
Other Value Added (Other Property Income and Taxes on Production and Imports Net of Subsidies)
The BEA also releases Taxes On Production and Imports net of subsidy (a change in definition from Indirect Business Taxes in past IMPLAN datasets) and Gross Operating Surplus (GOS) data at the 3-digit NAICS level. Gross Operating Surplus includes Proprietor Income and Other Property Income; thus, Other Property Income, for 3-digit NAICS is derived by subtracting our estimates of Proprietor Income from GOS. These 3-digit control values are distributed to the detailed industries based on the Benchmark I-O characteristics for Other Property Income. However, the BEA data are lagged a year and must be projected first, using growth rates from other data sources.
1. The CEW data provides employment and wage information for workers covered by State Unemployment Insurance (UI) laws and Federal workers covered by the Unemployment Compensation for Federal Employees (UCFE) program. Major exclusions from UI coverage include most agricultural workers on small farms, all members of the Armed Forces, elected officials in most states, most employees of railroads, some domestic workers, most student workers at schools, and employees of certain small nonprofit organizations.
https://implan.com/wp-content/uploads/Market-site-Logo-resized-2-1.jpg00Adam Smithhttps://implan.com/wp-content/uploads/Market-site-Logo-resized-2-1.jpgAdam Smith2019-10-24 16:00:352019-10-24 16:00:50Overview of Value Added Data