Labor Income Events
INTRODUCTION
Labor Income Events are appropriate to model a change in labor payments which are isolated from Industry production. An example would be a wage increase for current employees. There won’t be any new production, but the workers will earn more.
IMPLAN will automatically deduct in-commuting income, payroll tax, personal tax, and savings from Labor Income Events. All payroll taxes stay in the location of the employment. That is, only commuters’ post-payroll-taxes-income is deducted. Household spending of income on imported goods and services will also be treated as leakage.
|
Event Type |
Labor Income Events |
|
Event Use |
Analyzing a change in Labor Income separately from production |
|
Event Specification ”WHO” |
Employee Compensation or Proprietor Income |
|
Event Value “WHAT” |
Employee Compensation or Proprietor Income |
LABOR INCOME EVENTS
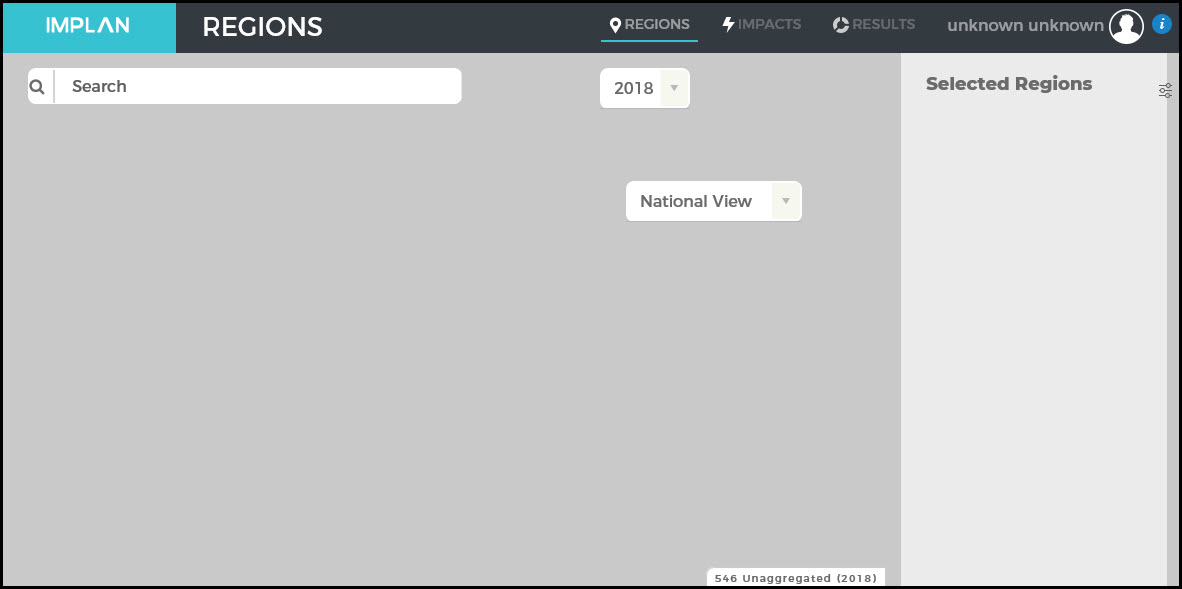
IMPLAN can be accessed via app.IMPLAN.com. Once you are logged in, you will be directed to the IMPLAN dashboard. From the dashboard you can navigate to the Regions, Impacts, or Projects screen.

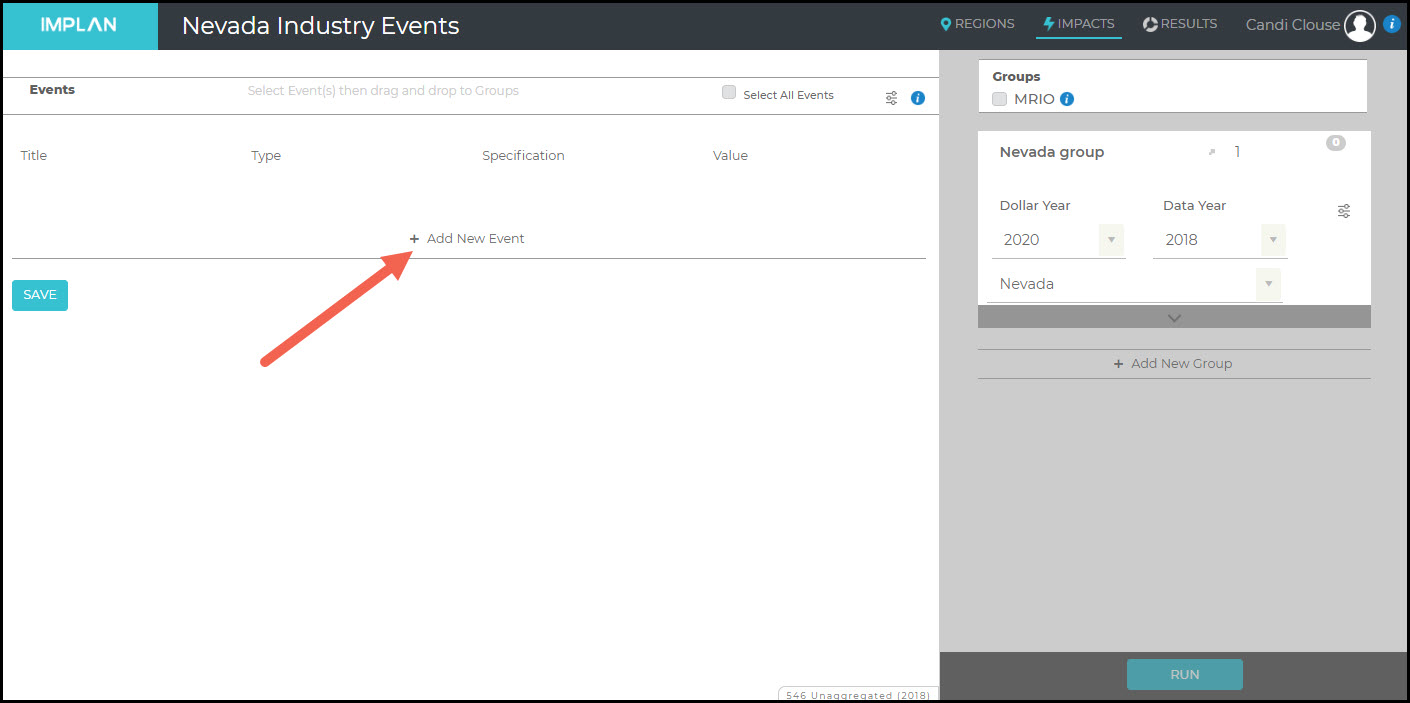
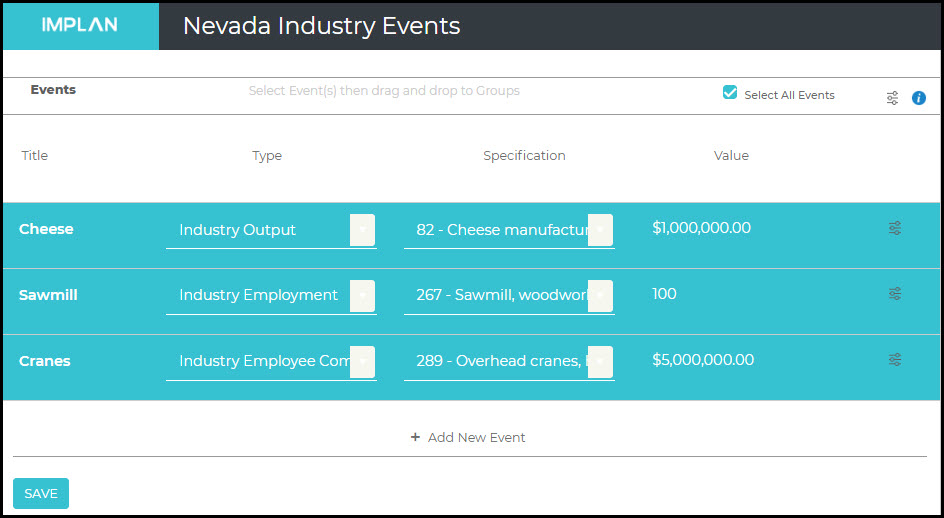
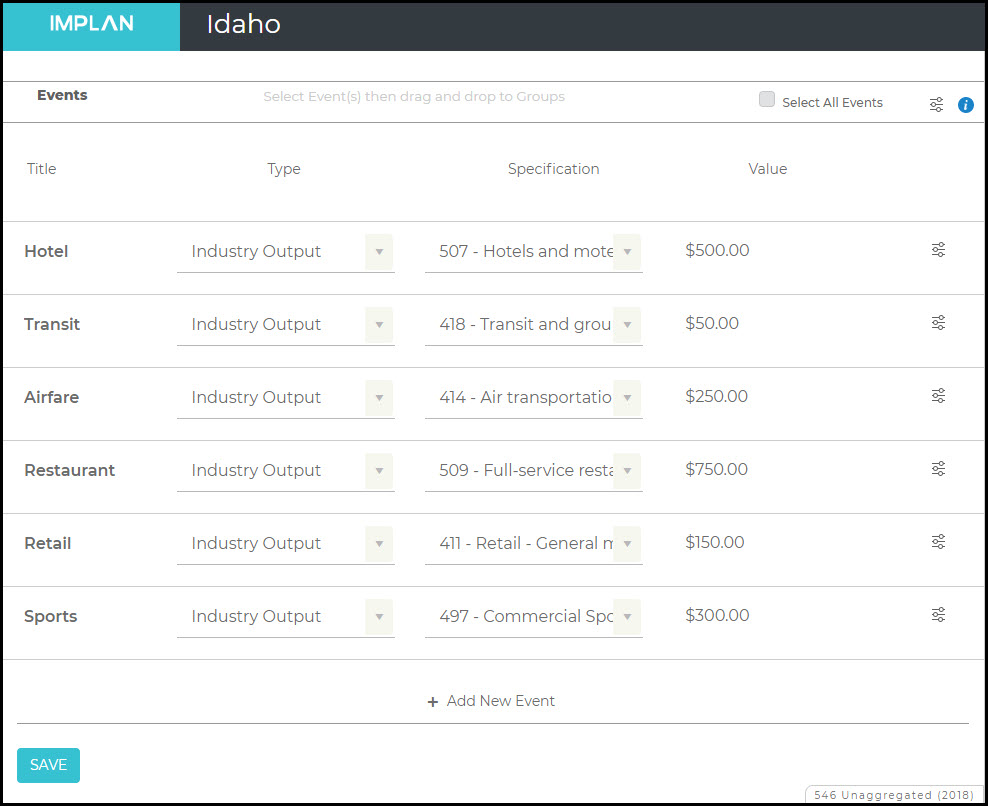
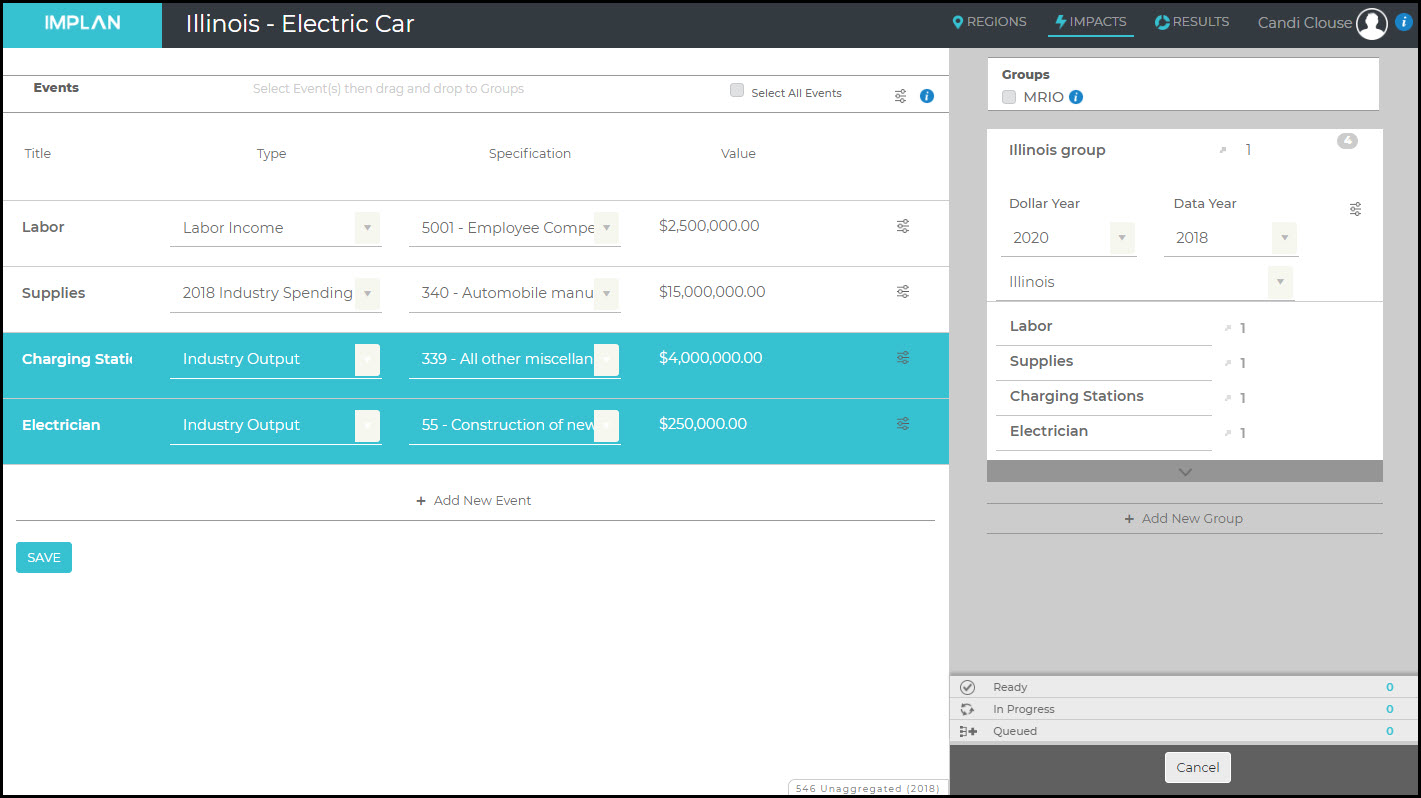
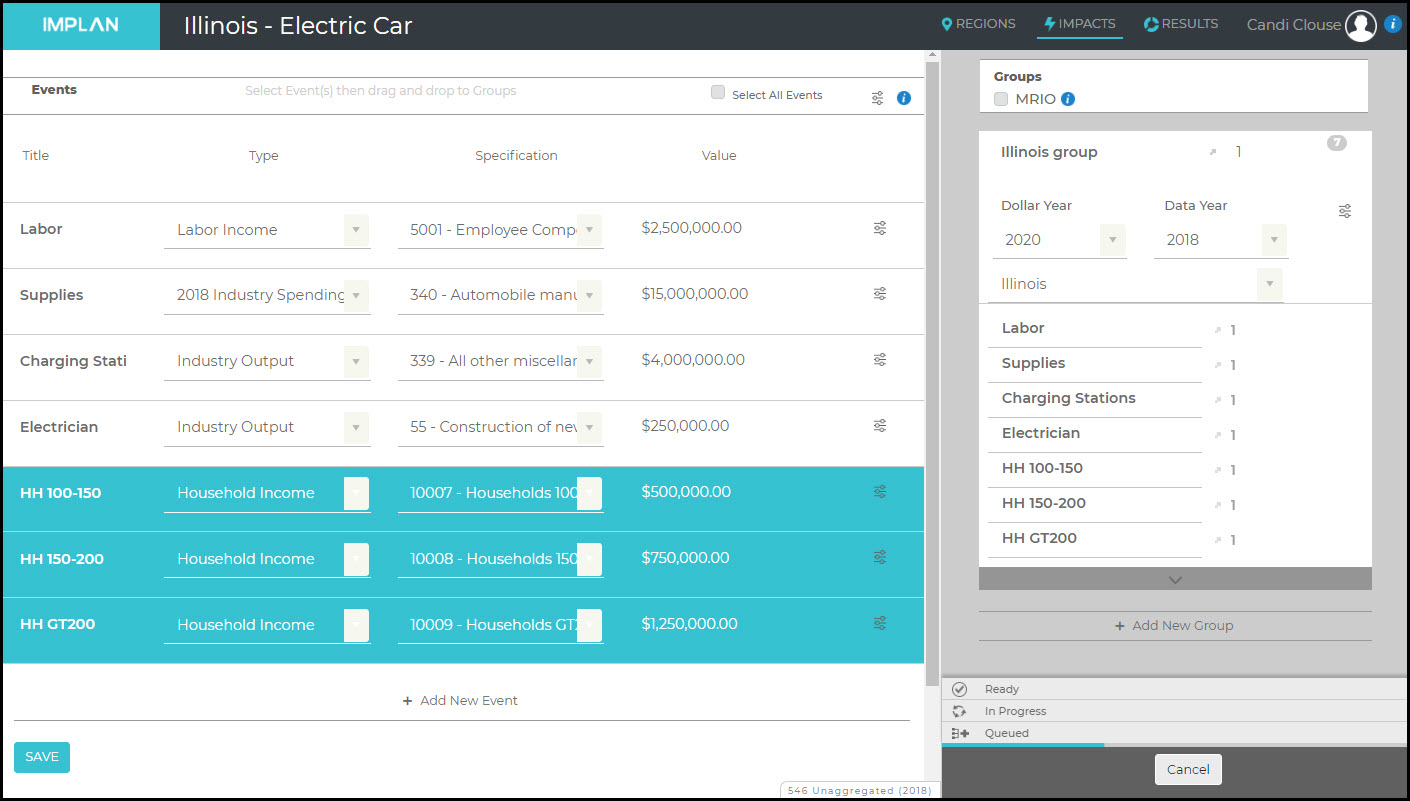
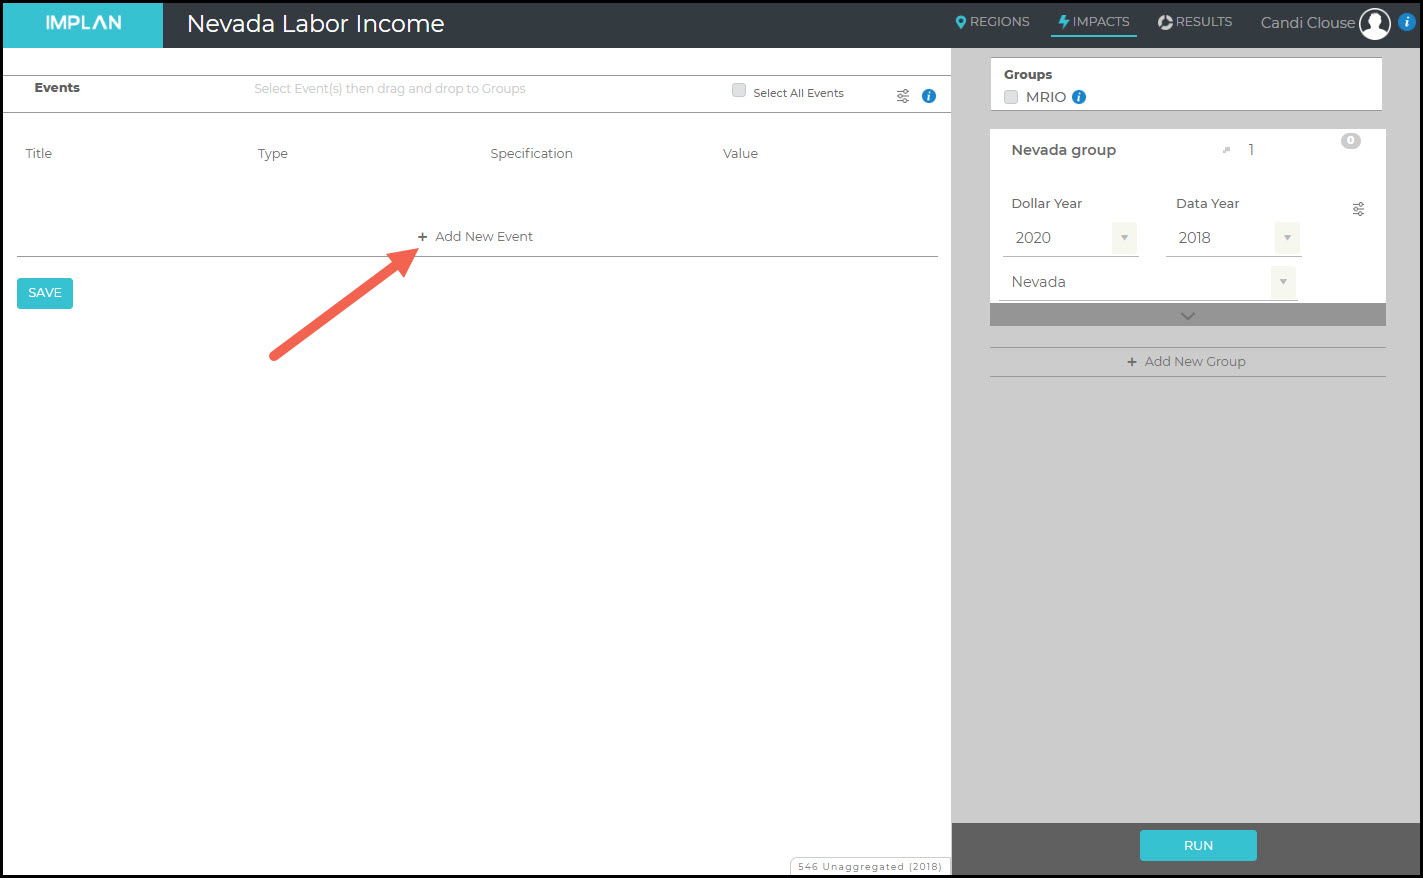
Once you have chosen your Region and named your new Project, you will be directed to the Impacts screen. From here, click on Add New Event to create a Labor Income Event. In this set of examples, 2018 Nevada data is utilized.
Labor Income represents all forms of Employment income, including Employee Compensation (wages, salaries, and benefits) and Proprietor Income. When using a Labor Income Event, there are two Specification options: Employee Compensation and Proprietor Income.
Employee Compensation is the total payroll cost of wage and salary employees to the employer. This includes wages and salaries, all benefits (e.g., health, retirement) and payroll taxes (both sides of social security, unemployment insurance taxes, etc.). It is also referred to as fully-loaded payroll.
Proprietor Income consists of payments received by self-employed individuals and unincorporated business owners. More specifically, it represents the current-production income of sole proprietorships, partnerships, and tax-exempt cooperatives. It excludes dividends, monetary interest received by nonfinancial business, and rental income received by persons not primarily engaged in the real estate business.
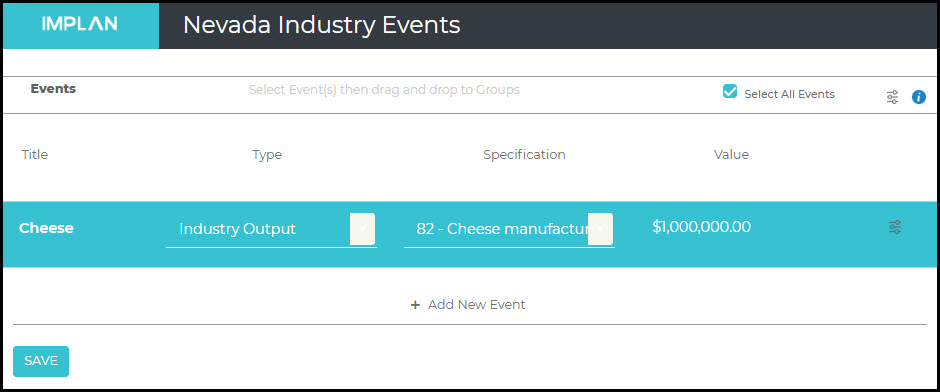
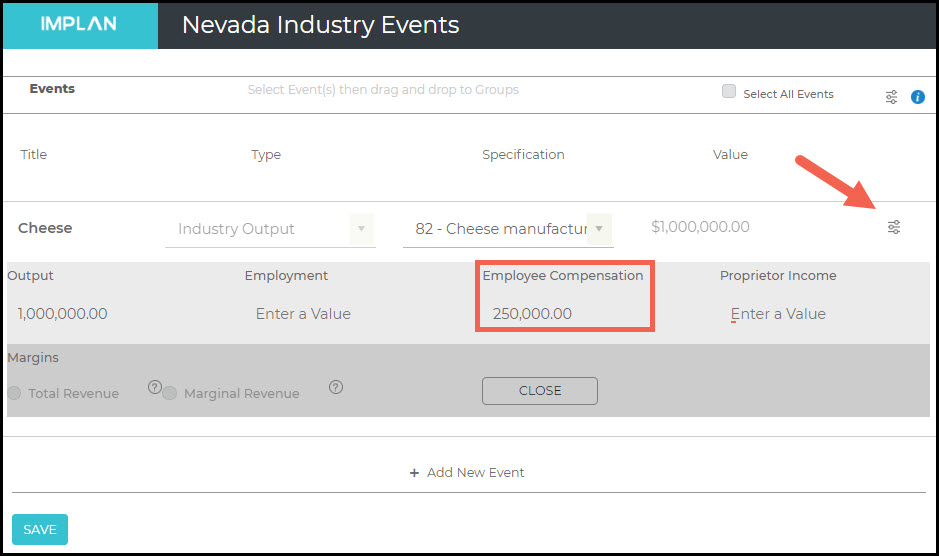
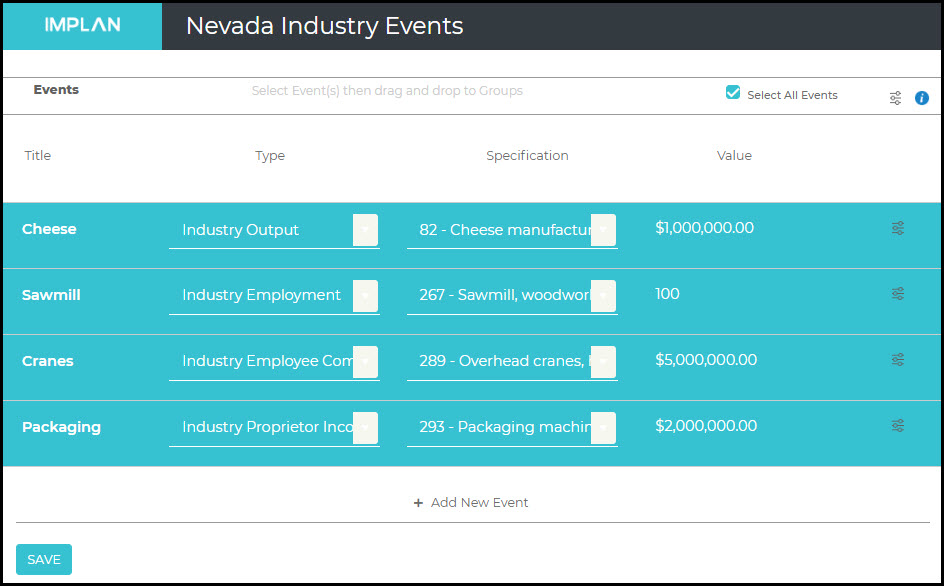
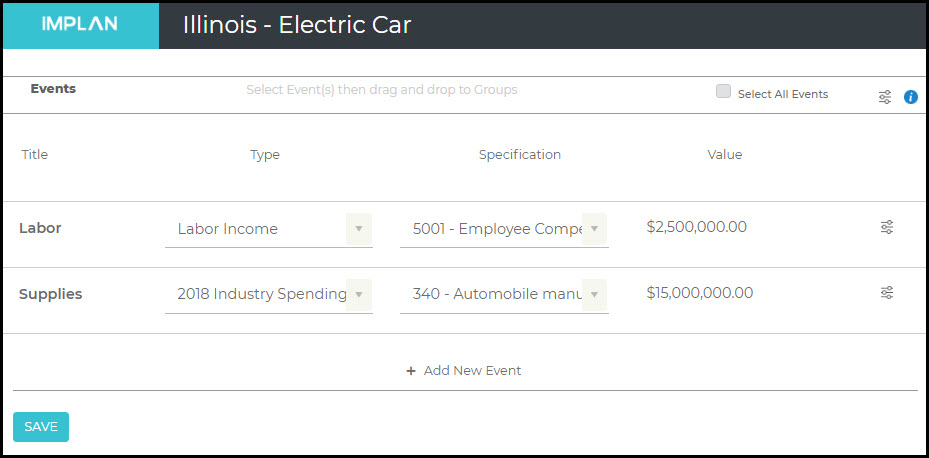
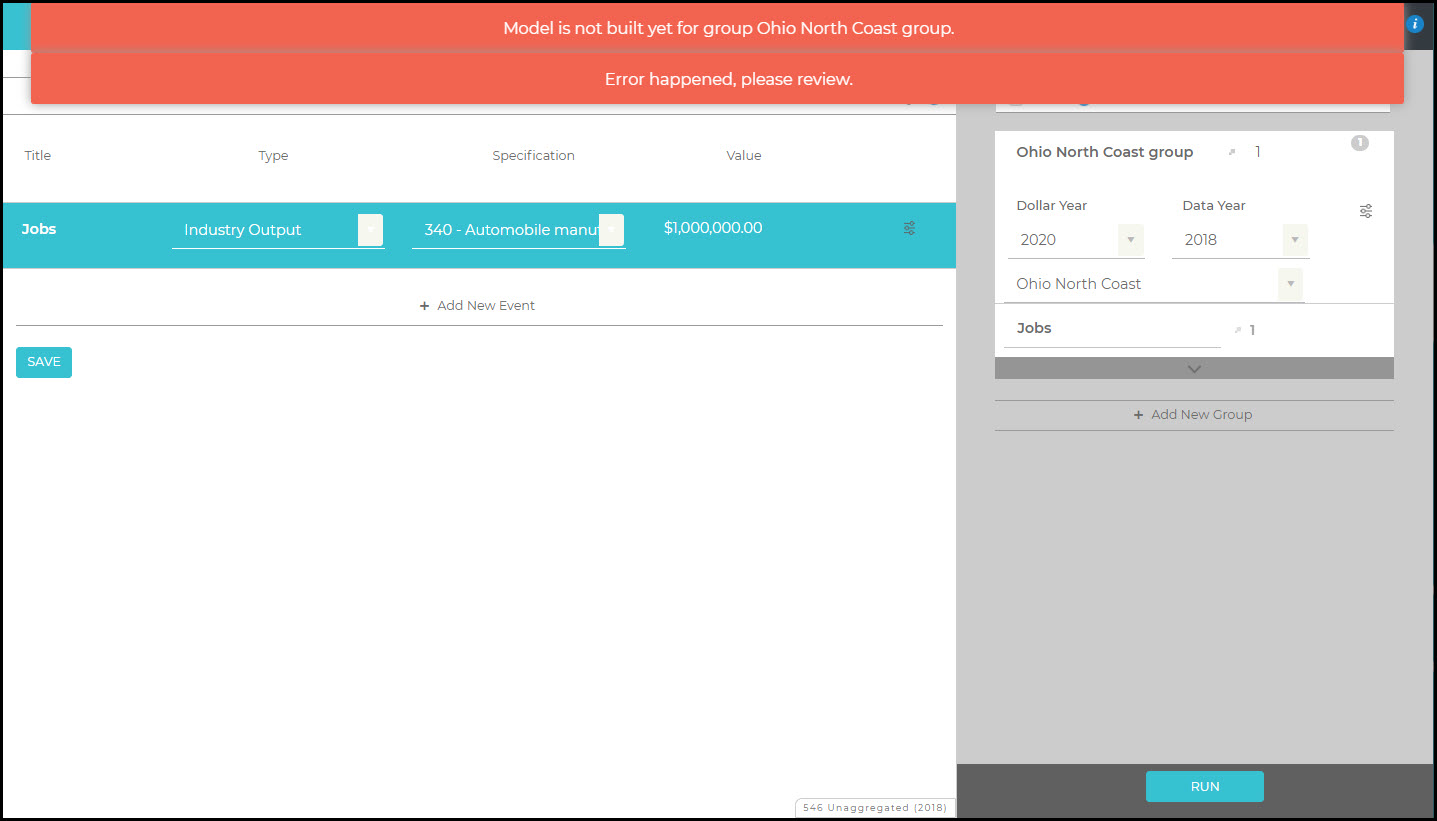
In this example, there will be an additional $1M in Employee Compensation and an additional $250K in Proprietor Income. The Industry or Industries in which employees are earning new income is irrelevant in this example because there is no change in production, just an increase in earnings by existing employees. One Event will be set up for each type of Labor Income.
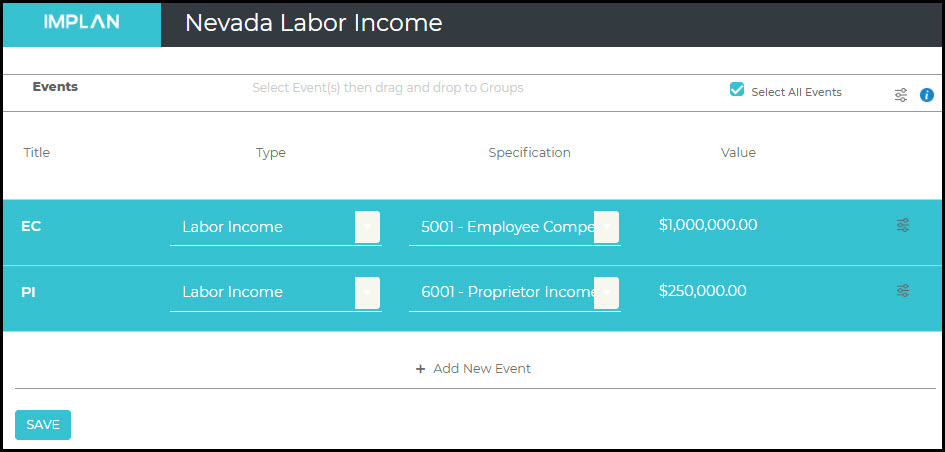
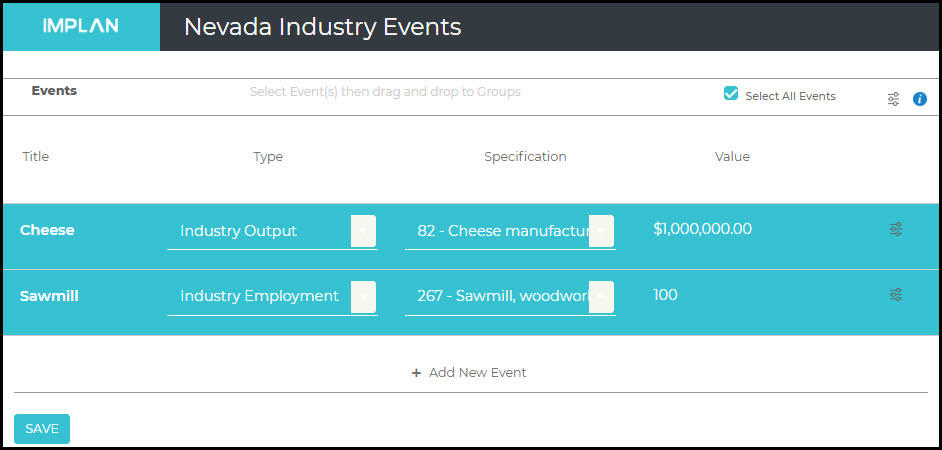
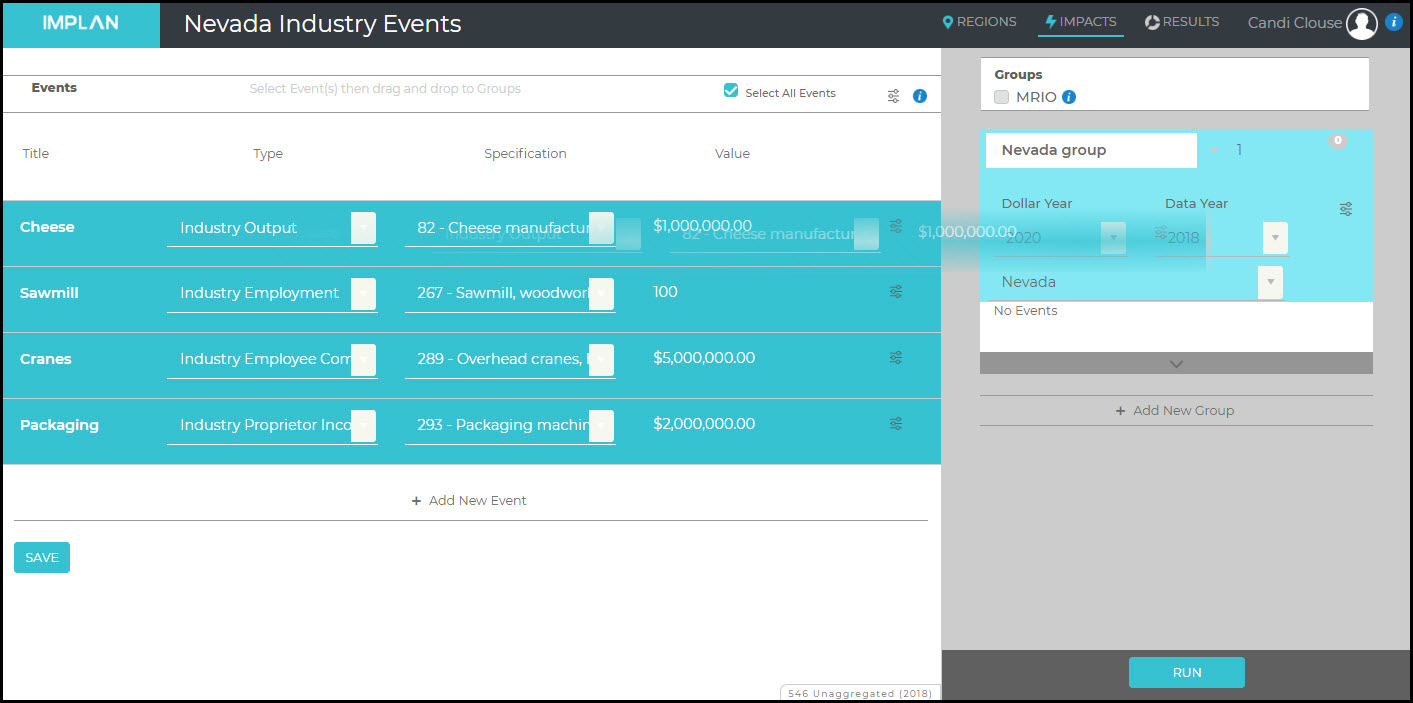
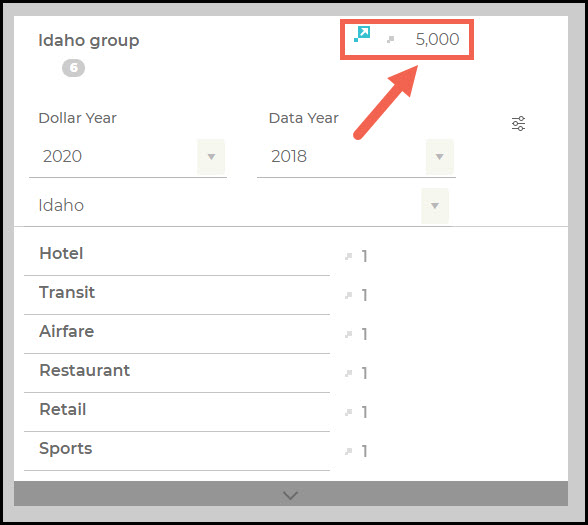
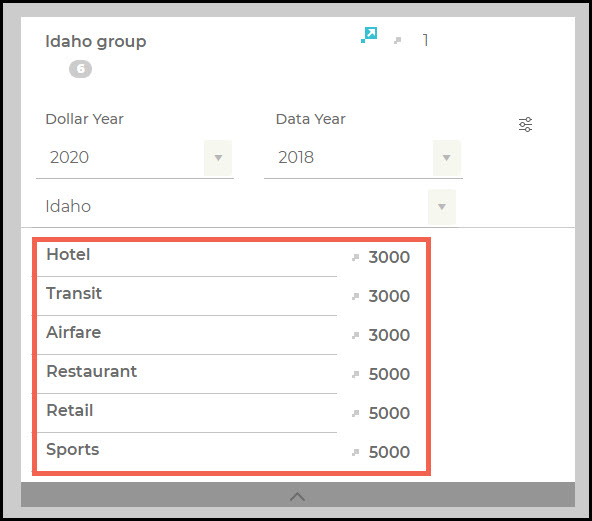
Now that you have your Events, ensure that all are highlighted in teal by clicking on them individually or checking Select All Events at the top of the screen. Now the Events can be dragged into your Group on the right.
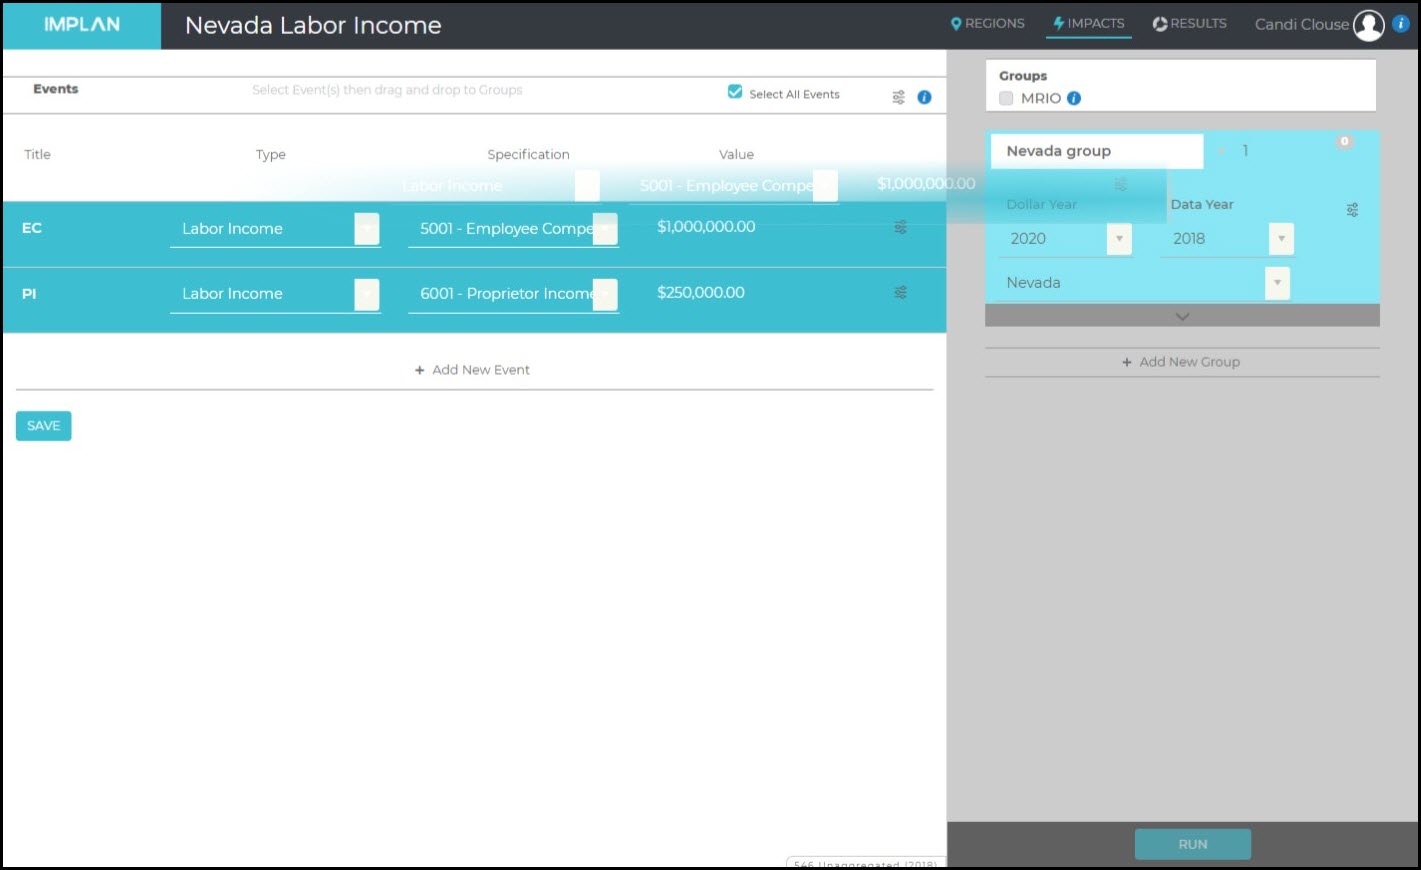
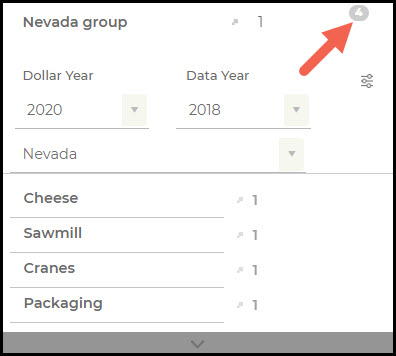
You will know when the Events have populated in the Group when the number in the upper right of the Group box equals the number of Events.
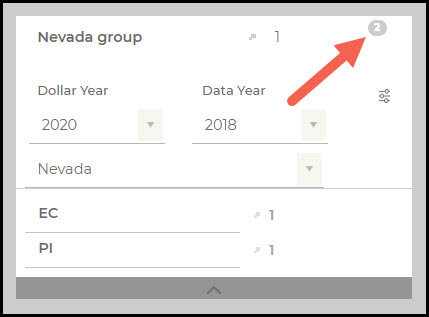
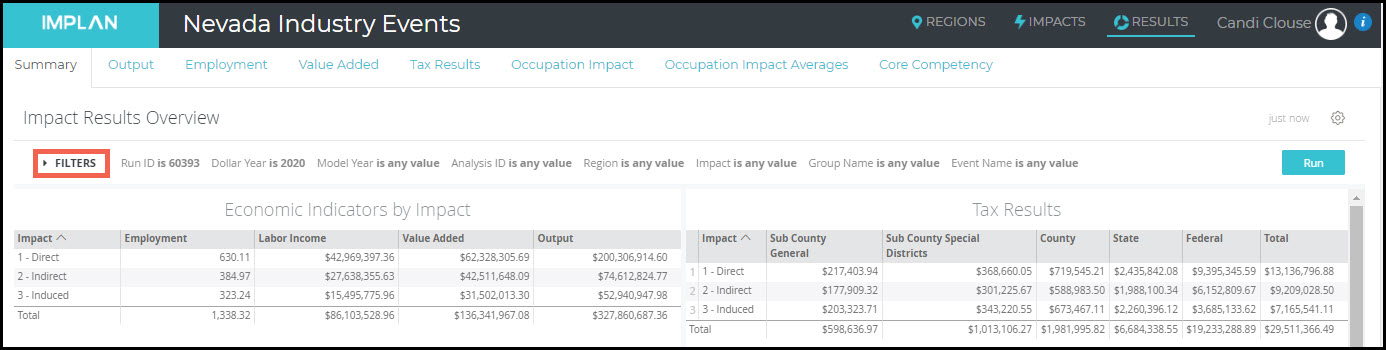
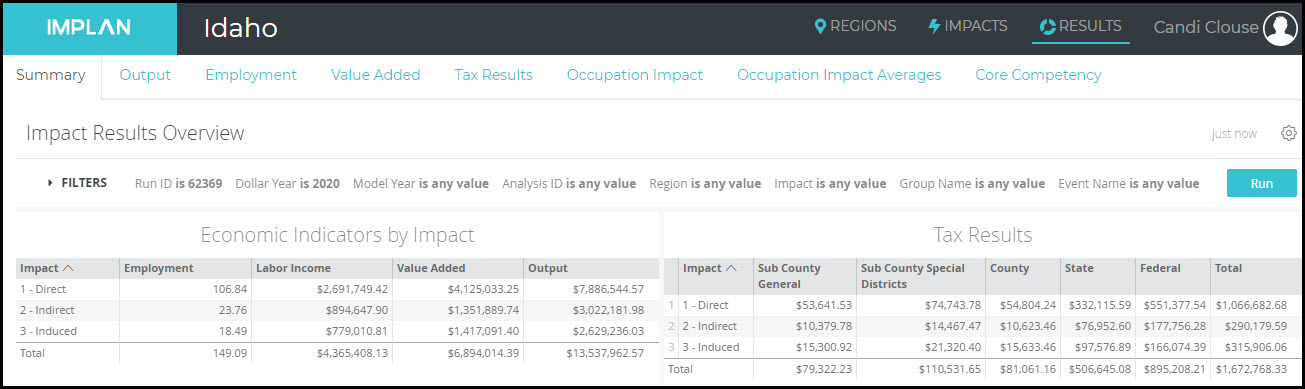
Now click Run in the bottom right of the Impacts Screen.
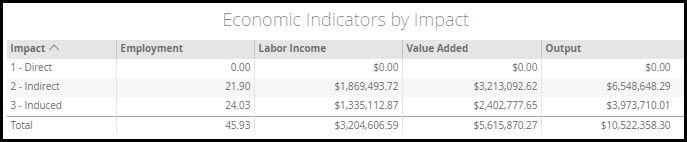
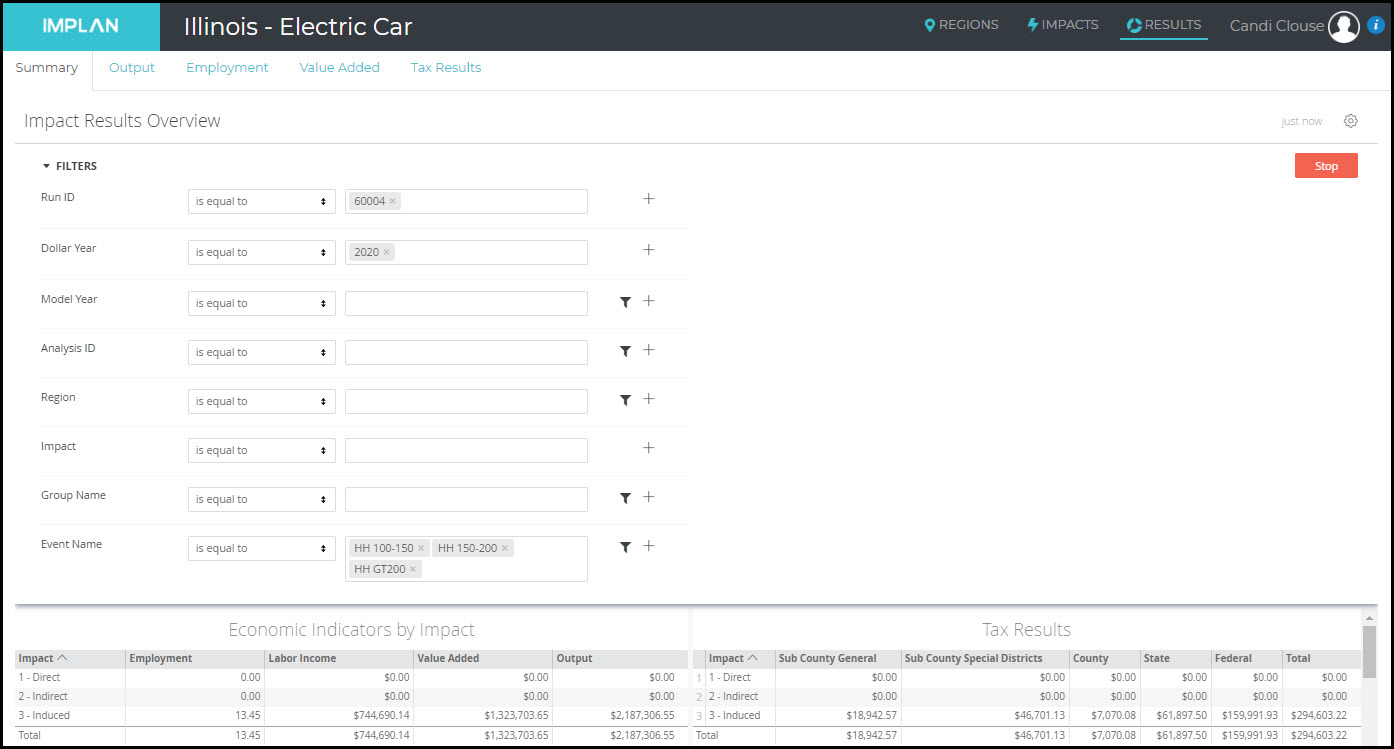
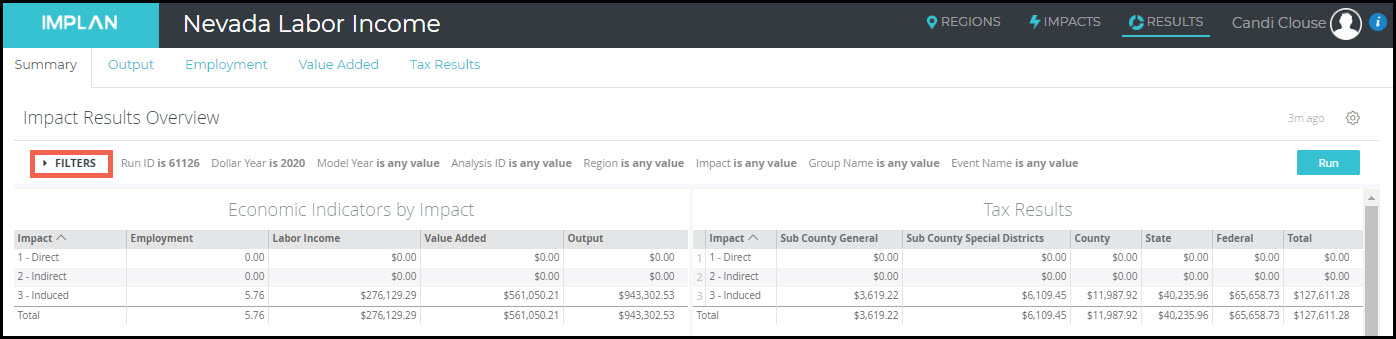
The first thing you will notice is that there are no Direct or Indirect Effects. Labor Income Events only affect household spending, so there will only be Induced Effects. Learn more in the article Explaining Event Types.
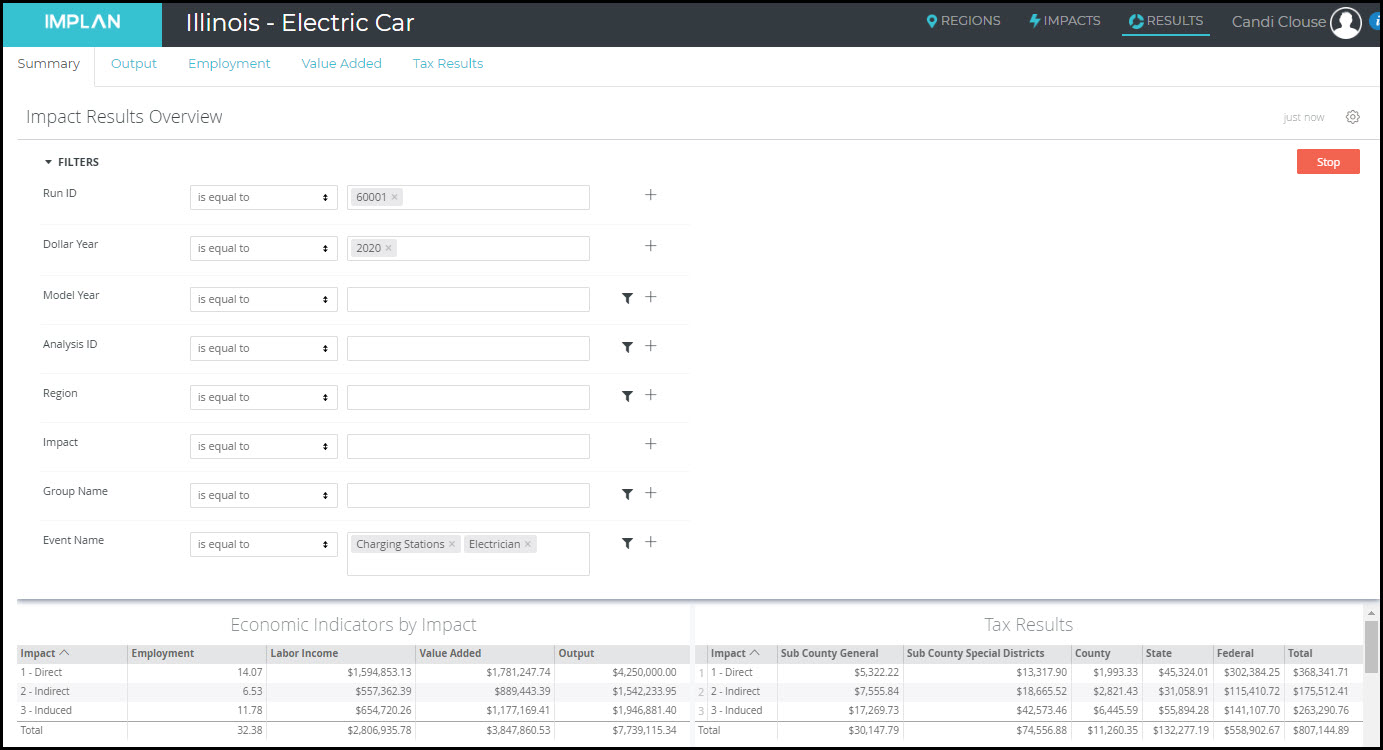
In this example, we included two Events, so the default on the Results screen will include both. If you want to look at the impacts for just one Event, click on Filters and search for the Event Name that you want to see.
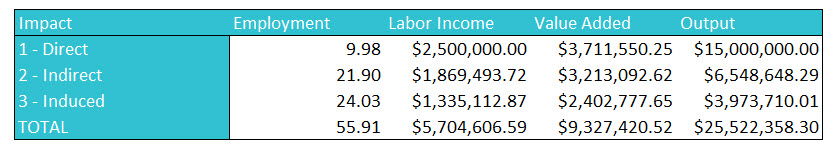
Labor Income Events are often used as part of Analysis-by-Parts (ABP). ABP allows you to examine a specialized Industry or a firm that is not
reflected by an IMPLAN Industry due to differences in the structure of the
Leontief Production Function and/or Spending Pattern that cannot be edited via a single Industry Event. This type of analysis is typically used to split the stemming ripple effects of an Industry Impact into its individual impact components – budgetary Spending Pattern (Intermediate Inputs) and payroll.
RELATED ARTICLES
ABP: Introduction to Analysis-By-Parts
Running Your First New Business Impact
Understanding Labor Income (LI), Employee Compensation (EC), and Proprietor Income (PI)