Combining Regions in IMPLAN allows you to create Regions of grouped geographies to analyze. The great part is once you create a Combined Region, it will always be available for you to use.
DETAILS
You can create a custom Combined Region in IMPLAN with just a few simple clicks. From the Regions screen, select all of the Regions you want to combine. Click the Menu Button in the Selected Regions field.
A popup will appear asking you to name your new Combined Region. Remember to give it a name that makes sense as this will now be searchable in from your Regions or Impacts screen.
IMPLAN is now building your Combined Region. You will know it is complete when the teal icon appears next to the i as shown below.
You can now proceed with your analysis by clicking Create Impact in the bottom right corner of your screen.
HINTS
You can always start a new Project using this Combined Region by searching for the title you gave it on the Regions screen.
Note that there is a limit of 200 geographies in Combined Regions.
MRIO
Combining Regions is very useful when you are using MRIO. For example, you may want to compare your county to the remainder of the state. To ensure that your Project runs efficiently, you can create a Combined Region for all of the other counties in your state. You can then MRIO your county to the Combined Region of the remaining counties. So instead of having to use MRIO with Brewster County, TX and the other 253 counties, you can use MRIO with Brewster County and a Combined Region of the 253 other Texas counties.
https://implan.com/wp-content/uploads/Market-site-Logo-resized-2-1.jpg00Joe Demskihttps://implan.com/wp-content/uploads/Market-site-Logo-resized-2-1.jpgJoe Demski2020-08-12 10:18:552020-08-12 10:18:55Combining Regions
Your answers to the questions you should ask yourself when preparing your analysis: Who, What, Where, When and Why can range in level of detail widely. The more information you bring to IMPLAN, the more detailed your analysis can be defined. IMPLAN is based on Input-Output Analysis which quantifies the secondary demands supported across industries within a given Regional economy due to some primary economic effect. The primary, initial change or effect is entered into IMPLAN using Events by the analyst, you! Therefore you need some information about the level of production, spending, or income/revenue generated from the economic Event you are analyzing.
This article specifically speaks to defining the What element of your analysis, which corresponds to your Event Values and other Event Settings when entering your analysis into the application.
The “What” element of your analysis simply refers to the quantified size of the economic Event you are analyzing. Who answers the Industry, Commodity, Institution or Income type responsible for the initial effect being analyzed.
The more data brought into the application from outside of IMPLAN the more IMPLAN data points and averages are being replaced with the analyst’s known values or assumptions. More specificity is added to the analysis when more data is known about the effect and is incorporated in the setup of the analysis in the application. Doing so takes time, effort and attention to detail to prevent any unintended errors. Taking the time to add extra specificity to your analysis is recommended when the data to do so is available and that data is reliable, the “Who” of your analysis spends differently than the norm for this actor in the economy or how IMPLAN says they do, or the details of your analysis will be heavily criticized by your audience.
INDUSTRY CONTRIBUTION ANALYSIS
Industry Contribution Analysis (ICA) is appropriate when you’d like to estimate how existing production supports demand to other Industries in the economy. As a rule of thumb, we recommend using ICA especially when the existing production you are analyzing makes up more than half of its Industry. ICA allows you to quantify the extent to which that Industry is connected to the Regional economy and on the other side what an economy stands to lose in the hypothetical scenario that the Industry leaves the Region.
ICA Events in IMPLAN differ from other Event Types, used to analyze Impacts, as they restrict any purchases back to the Industry such that the Indirect and Induced Effects for the specified Industry will always be zero in the Results.
The Event Value of an ICA Event can either be an Output ($) or a percentage (%) of the Output in the Industry according to the Region Details behind the “i” in the Study Area Data. No other data points can be used in ICA. If you’d like to estimate the contribution of an Industry based on an Employment number, you’ll need to first convert the value to Output using the data in:
Study Area Data
> Industry Summary
Find the row for the Industry you are analyzing and find the intersecting column for Output per Worker. Multiply your number of employees by Output per Worker for the given Industry.
CONTRIBUTIONS: USING IMPLAN DATA
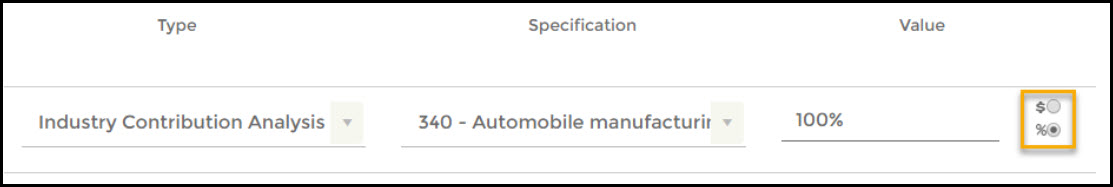
Using 100% as the Event Value in an Industry Contribution Analysis is the one situation in which you don’t need to bring your own value to IMPLAN.
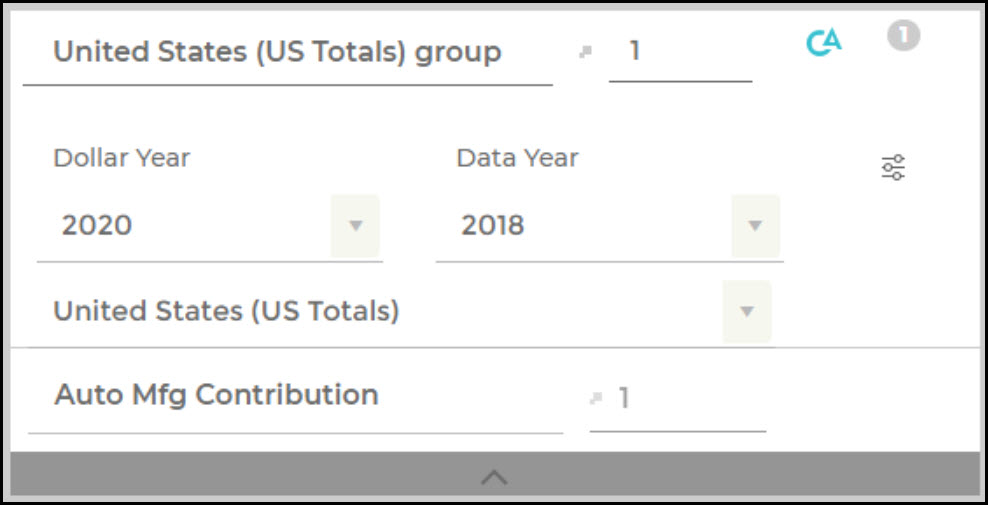
For example, above is an ICA Event setup to analyze the effect of 100% of the Automobile manufacturing Industry. The value of the 100% depends on the Region and Data Year of the Group in which this Event is analyzed.
Dragging and dropping the Event into a Group with Region: United States, Data Year: 2018 will analyze the effect of the entire Automobile Manufacturing Industry in 2018 across the whole country. Dollar Year is ignored when using a percentage as the Value. Because the analysis will use the Region Details data, the Value analyzed will always be in the same Dollar Year as the Data Year. You can choose what Dollar Year to report in by using the Dollar Year Filter in the Results.
CONTRIBUTIONS: USING YOUR OWN % OR OUTPUT VALUE
You may want to analyze the contribution of just a segment of an IMPLAN Industry. For example, in 2018, the Output of the U.S. Automobile Manufacturing Industry was $217,100,880,875.11. If the specific manufacturer you want to analyze produced $115B worth of cars in 2018, or about 53% of the value of all cars produced in 2018, I could either us $1115B or 53% as the Event Value.
IMPACT ANALYSIS
The most common types of Impacts analyzed in IMPLAN are:
New construction
New business operations
New final demand spending:
Tourism/Visitors
Population growth
Fiscal spending policy changes
When there is new activity (such as the possible impacts above) in an economy due to a change in demand, there are additional secondary demands that ripple throughout the Region’s economy. These secondary demands stem from impacted Industry’s need for inputs. The chain of transactions that are supported by the impact in the Region are quantified by IMPLAN as Indirect and and Induced Effects. Unlike in ICA, the specified Industry can experience Indirect and Induced Effects.
To analyze some new activity, remeber you need to identify in IMPLAN Where and When the Impact occurs by defining the Region, Data Year and Dollar Year. Each of these indicators are captured in a Group. Events specify the economic transactions occurring in the local economy in terms of Type, Specification, and Value. The Who and What of the new activity should be captured by the Event Specification and Value. The Who and What of the economic transaction are paired with Where and When by dragging and dropping an Event into a Group.
For standard Industry Events, the Event Specification can be defined as the IMPLAN Industry impacted by the initial change. There are four different Industry Event Types: Industry Output, Industry Employment, Industry Employee Compensation, Industry Proprietor Income. Choosing between these Event Types should be based on the known Event Value. In some cases, information about new activity may not be known from a production standpoint, but rather from a consumption standpoint. The Industry vs. Commodity Output article provides a questionnaire to help guide you to the appropriate approach for analyzing your data.
IMPACTS: SINGLE VALUE
For construction impacts its common to only know total cost of construction, for operations impacts its common to only known number employees and for new final demand spending, total spend (by Industry or Commodity) is typically all that is known. To analyze any impact, you need to know, at least, either Output, Employment, Total Employee Compensation or Total Proprietor Income.
Output is equal to the total value of production. Industry Output in IMPLAN is the value of the Industry’s production, including production that is added to inventory, in the given Data Year. Commodity Output in IMPLAN is the value of the total supply of the Commodity, including from inventory, in the given Data Year. Output is equivalent to the Producer Price of a good or service.
Employment in IMPLAN follows the same definition as Bureau of Economic Analysis Regional Economic Accounts (BEA REA) and Bureau of Labor Statistics Quarterly Census of Employment and Wages (BLS QCEW) data, which is full-time/part-time annual average. Thus, it adjusts for seasonality, but does not indicate the number of hours worked per day. Thus, if you have a full-time equivalent (FTE) value you will want to first convert the FTE value to IMPLAN employment prior to using it as an Event Value IMPLAN. Conversely, if you need to report FTEs you will want to convert the IMPLAN employment to reflect those. FTE and wage and salary to Employment Compensation conversions can be found in the article “546 Industries, Conversions, Bridges, & Construction – 2018 Data.”
Employee Compensation is the total payroll cost of the wage and salary employee paid by the employer. This includes wage and salary, all benefits (e.g., health, retirement), and payroll taxes (both sides of social security, unemployment taxes, etc.). IMPLAN also provides a conversion between Employee Compensation and Wage and Salary data in the article “546 Industries, Conversions, Bridges, & Construction – 2018 Data.”
Proprietor Income is the current-production income of sole proprietorships, partnerships, and tax-exempt cooperatives. Excludes dividends, monetary interest received by nonfinancial business, and rental income received by persons not primarily engaged in the real estate business (BEA).
Typically, information about retail and wholesale Industry impacts are in the form of consumer spending, whether the consumer is a business or household. As discussed in the Output section, Output is in Producer Prices. Therefore when you enter Total Revenue into an Retail or Wholesale Industry Event, IMPLAN calculates the Marginal Revenue, a portion of Total Revenue to the specified Industry as the Direct Effect. Read on in the linked articles to learn more about Industry Margins and Commodity Margins.
IMPACTS: MULTI-VALUE
When only one Event Value is provided, IMPLAN estimates all effects based on this one number and the Industry’s average Leontief Production Function. If more than one Event Value is known it is always best to use this known information as opposed to IMPLAN’s estimate to reflect the more unique characteristics of what you are analyzing.
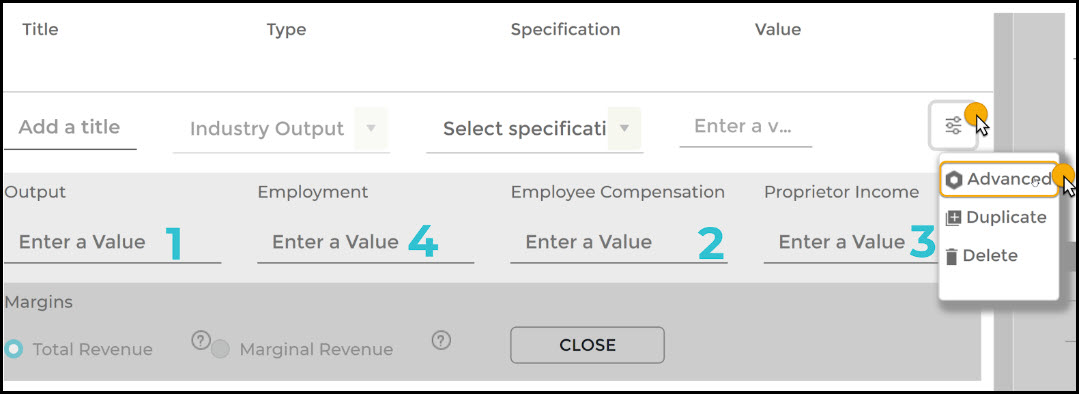
When multiple Event Values are provided in an Industry Event via the Advanced Menu fields shown below, Output will be determined by the Event Values in the following priority, regardless of the selected Event Type:
Output
Employee Compensation
Proprietor Income
Employment
All secondary Event Values will be a customization to IMPLAN’s estimation for the Event Value.
Other data adjustments can be applied to standard Industry Events for some further customization.
IMPACTS: DOING MORE WITH ABP
Do you have more information beyond the values that can be entered in an Industry Event: Output, Employment, Employee Compensation and Proprietor Income? Analysis-by-Parts or ABP is a technique for that allows you to define the spending associated with Industry as you’d like, giving the option to:
Specify the purchase amount of all Intermediate Inputs (all commodities purchased from operating the businesses)
Specify the Local Purchase Percentage of all Intermediate Inputs
Adjust allocations of Output to TOPI and OPI (essentially tax and profit)
https://implan.com/wp-content/uploads/Market-site-Logo-resized-2-1.jpg00Joe Demskihttps://implan.com/wp-content/uploads/Market-site-Logo-resized-2-1.jpgJoe Demski2020-08-12 10:13:142020-08-12 10:13:14What Kind of Data Can I Bring to IMPLAN?
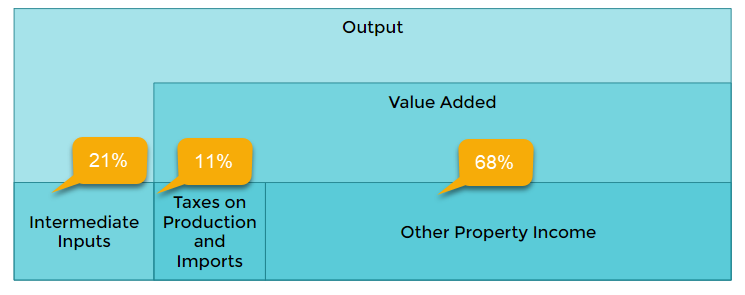
Owner-occupied dwellings is a Special Sector developed by the BEA to ensure consistency in the flow of funds.
Owner-occupied dwellings is necessary to include as an Industry in IMPLAN because home-ownership generates wealth (the home can be rented out to others or saves the owner from having to pay rent); the Value Added portion of this Industry is counted as part of GDP along with the Value Added of every other Industry in the country. Owning and maintaining a home is also a major area of spending for homeowners; this Industry captures the economic effect.
The Owner-occupied dwelling Industry Production Function only contains:
Taxes on Production and Imports (TOPI) = largely made up of Property Tax
Other Property Income (OPI) = difference between the rental value of the home and the non-mortgage costs of home ownership (Output – Intermediate Inputs – TOPI); Mortgage Interest is included in OPI
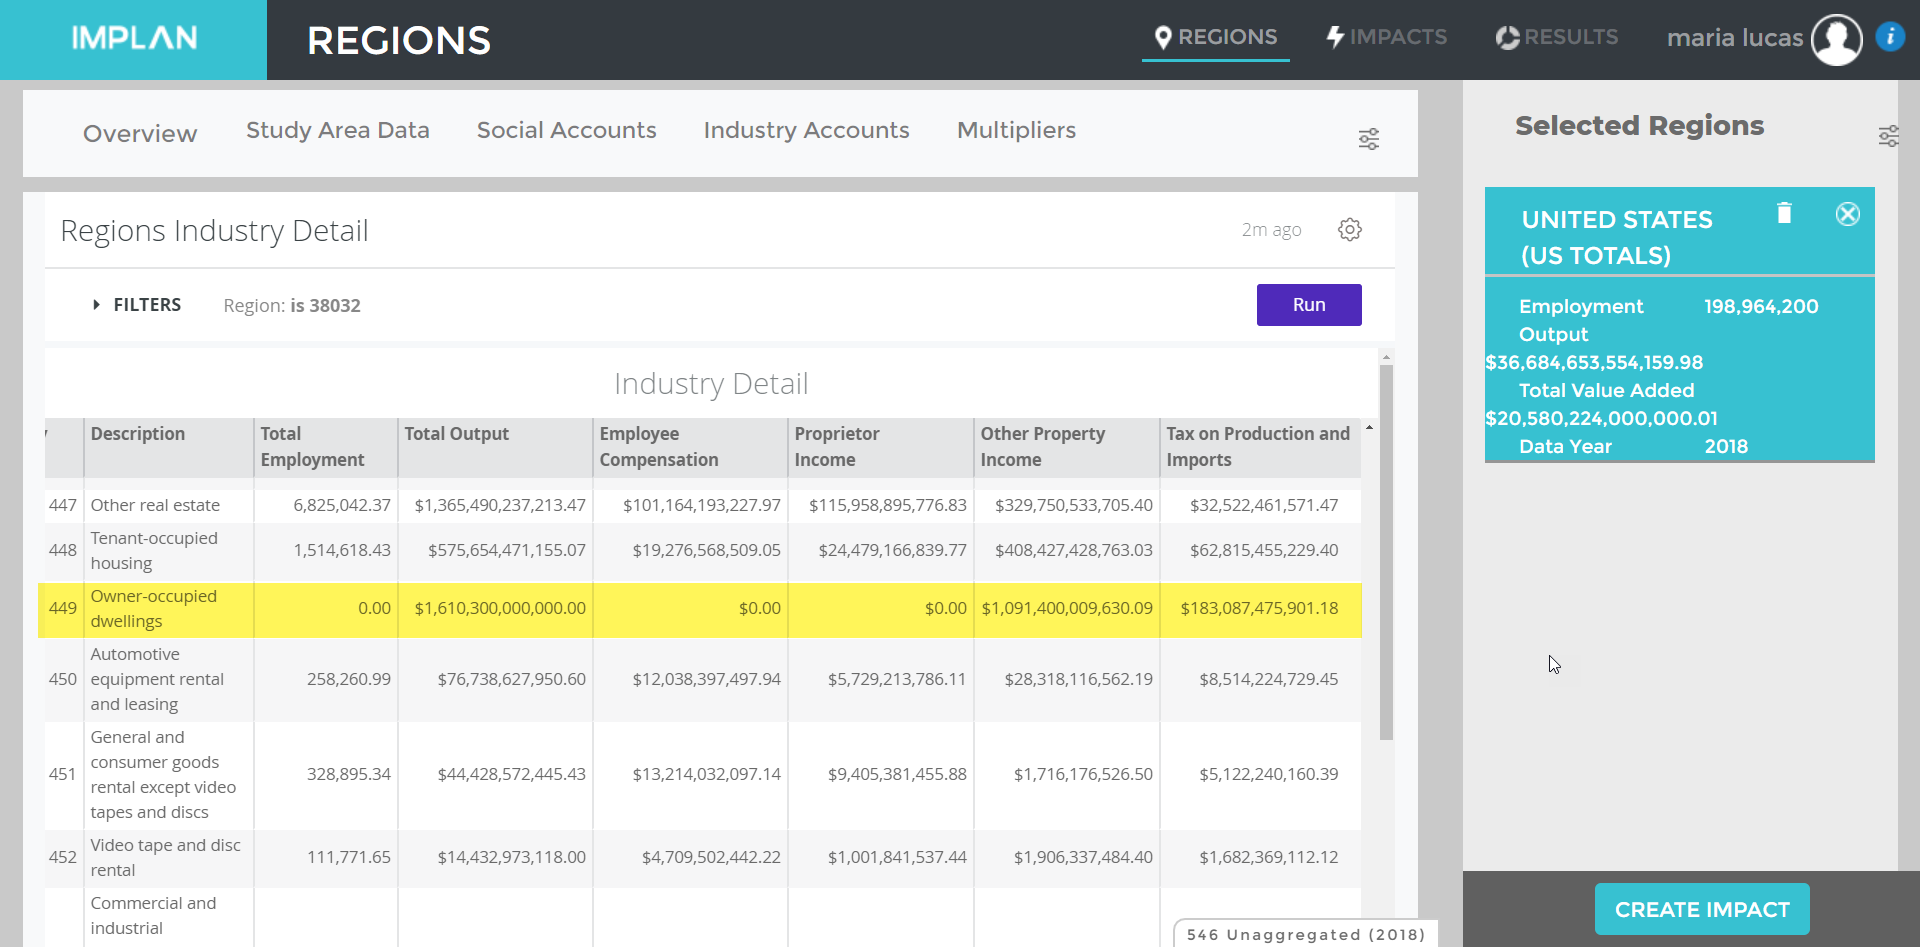
Here’s the Industry Detail for the U.S. 2018 Economy:
Note there is no Employment or Labor Income generated in this Industry. Below, the components of production have been converted to percentages of Output for the Industry as a whole in the U.S. 2018 Economy:
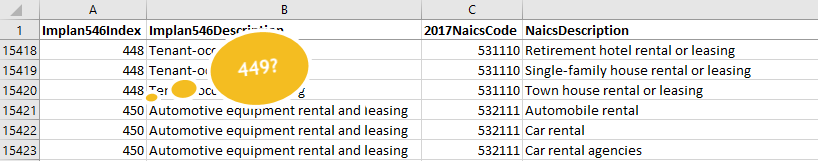
Notice in the screenshot below, Industry 449 does not exist in the NAICS Bridge (546 Industry Scheme) because the industry does not correspond to a NAICS Code. NAICS Codes are used to classify business establishments. The Owner-occupied dwellings Industry is not a business establishment and therefore does not have a NAICS Code.
The owner-occupied dwelling Industry is different from the other two real estate related Industries in IMPLAN; Industry 448 Tenant-occupied housing and Industry 447 Other Real estate.
Tenant-occupied housing (448) includes the value of operations for lessors of residential rentals.
Other Real estate (447) includes the value of operations for residential property managers, lessors of nonresidential buildings, and offices of real estate agents and brokers (offering services other than residential leasing).
Owner-occupied dwelling and Tenant-occupied housing are the number one and three Industries (in the U.S. 2018 Economy) in terms of Total Household Demand. Logically this seems very appropriate as they respectively represent the value of home-ownership and home renting/leasing.
RENT PAYMENT IMPACTS
The economic effect of rent payments associated with some Event is accounted for in the Induced Effects in the Results of the given Event when analyzed in IMPLAN.
If you’d like to directly analyze rent payments (made to a leasing establishment as opposed to a home-owner), the total value of rent payments can be analyzed via an Industry Output Event in the Industry 448 – Tenant-occupied housing. When analyzing this Industry, the necessary service of renting out the property via a property manager will be captured as an Indirect Effect to IMPLAN Industry 447 – Other real estate. This is because property management service is an Intermediate Input that Tenant-occupied housing purchases from Other real estate.
HOME OWNERSHIP IMPACTS
The economic effect of home-ownership costs associated with some Event is accounted for in the Induced Effects estimated in the Results of the given Event when analyzed in IMPLAN.
MORTGAGE PAYMENTS ARE NOT INCLUDED IN ANY INDUSTRY
The exchange of cash for principal is essentially an asset swap. Input-Output models do not account for existing assets – only annual change (e.g., net savings, new construction, equipment purchases). This means mortgage payments are an asset swap and are not part of the current accounts, and are therefore not included in any Industry. An Industry’s production function only includes current accounts; it does not include investment.
Households make a payment to the capital institution in IMPLAN. This payment is accounted for when analyzing Household Income Events. The payment is net savings, which includes paying down debt (i.e., principle). Mortgage payments are included in this payment to capital by Households.
HOMEOWNERS RENTING OUT THEIR HOME
When a homeowner rents out their home, either to a vacationer or a resident, the income they earn is often used to pay their mortgage and maintain the home. The surplus income they earn can be spent in a variety of ways.
Rent income earned by a homeowner can be analyzed via a Household Income Event. The Event Value should not include any fees for the paid service of property management. This approach assumes the homeowner will distribute the income like any other income earned. As mentioned in the previous section, Household Income Events accounts for the Household Income groups average net savings (net payments to capital). The portion of total Household Income for the income group that is allocated to net savings in the Region and Data Year is assumed to be the portion of every dollar entered in a Household Income Event that will be allocated to net savings. Because the capital institution in IMPLAN is not internalized in the Multipliers, there will be no effect in the Results from income allocated to capital. In other words, IMPLAN does not assume how capital payments will be spent, so these payments are treated as leakage. Another portion, accounting for income taxes, is also treated as a leakage.
The remaining Household Income is distributed across the average makeup of Commodities purchased by the given income group. Commodities purchased with this Household Income that are produced by Industries within the Region generate Induced Effects.
The allocation of Household Income includes a payment to IMPLAN Industry 449 – Owner-occupied dwellings which represents the value of the house as if it was rented. Owner-occupied dwellings pay for repair and maintenance services, real estate fees, and bank financing fees (such as refinancing a mortgage). These payments generate the iterations of Induced Effects from owning, repairing, and maintaining the home. Owner-occupied dwellings also pay taxes (largely property taxes). Once again, tax revenue is treated as a leakage. The residual going to Other Property Income is considered “imputed income” for households and includes mortgage interest. OPI is another leakage in IMPLAN.
Analyzing rent income to a homeowner via a Household Income Event is not perfect because the allocation of Household Income, after accounting for leakages, is an average for all households in that income group, not just the homeowners. Because spending by households that do pay rent are included in these averages, Tenant-occupied housing will also receive a payment.
BUYING AND SELLING A HOME
The cost associated with buying a constructed home is included in the cost of owning a home. The net income gained when a home is sold can be analyzed only if where, when, and on what the income will be spent is known. If the seller of the home uses the income to buy another house in the Region you may have real estate and financing fees for the new mortgage that can be analyzed accordingly. If the seller of the home is moving out of the Region, which is often the case, there is no impact to the Selected Region.
BUILDING A HOME
Constructing a new home does of course create an impact due to the need for materials and labor. The cost of constructing a home can be analyzed via an Industry Output Event in the Construction of new single-family residential structures Industry. More information on considerations when analyzing construction are found in the article Construction: Building the Analysis.
QUANTIFYING HOMEOWNERS’ PROPERTY TAX
TOTAL REGIONAL HOMEOWNERS’ PROPERTY TAX
The Taxes on Production and Imports (TOPI) for IMPLAN Industry 449 – Owner-occupied dwellings is made up largely of property taxes, therefore you can identify the total property taxes paid on homes as approximately the value of TOPI for IMPLAN Industry 449 – Owner-occupied dwellings. This value can be found in the Region Details: Behind the i in
Study Area Data
> Industry Detail (shown for U.S. in screenshot above)
> Find the row for the Owner-occupied dwellings Industry and the intersecting column for TOPI.
HOMEOWNER PROPERTY TAX EFFECTS
The ratio of total TOPI to total Output in a given Region for a given Industry is called the TOPI coefficient. This coefficient can be found Behind the i in
Social Accounts
> Balance Sheets
> Industry Balance Sheet
> Value Added tab
> Filter by Owner-occupied dwellings Industry, find the TOPI coefficient.
The TOPI coefficient for IMPLAN Industry 449 – Owner-occupied dwellings can be multiplied by the value of Owner-occupied dwelling Output generated in your IMPLAN Results to calculate the associated approximate value of Property Taxes paid by homeowners on their homes.
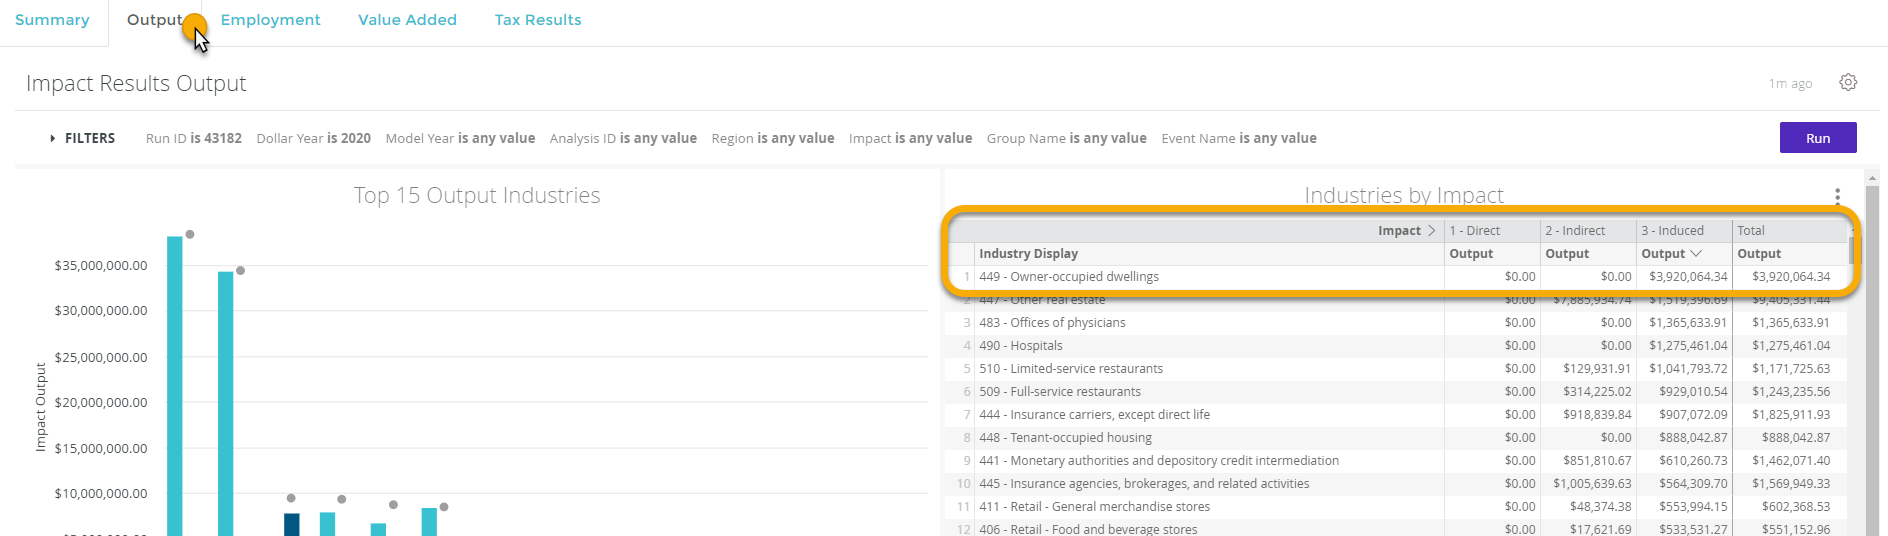
You can find the Owner-occupied dwelling Output effects generated in your IMPLAN Results by navigating to the Output tab of your Results. Find the Owner-occupied dwelling row in the Industries by Impact table (sort by Induced Effects). Here you’ll see the Output Effects to the industry. Unless you analyzed an Event in the Owner-occupied dwelling Industry, you will only see Induced Output to this Industry.
https://implan.com/wp-content/uploads/Market-site-Logo-resized-2-1.jpg00Joe Demskihttps://implan.com/wp-content/uploads/Market-site-Logo-resized-2-1.jpgJoe Demski2020-08-12 10:09:042020-08-12 10:09:04Housing: Owning, Buying, Selling and Renting
INTRODUCTION:
It is important to be able to distinguish between the concepts of a Value Chain and a Supply Chain. Supply Chains describe the chain of Intermediate Input purchases, or backward linkages, that are included in an Industry’s Spending Pattern and the Spending Patterns of its supplier, and so on. These purchases are incorporated into a new product that is then sold either to another Industry or to final demand.
A simplified Supply Chain of t-shirt may look like:
Cotton → Fabric → T-shirt
On the other hand, Value Chains describe how a good changes in value, after its produced, through the process of selling the good via a wholesaler or retailer. Throughout the Value Chain, Commodities increase in value, but unlike through a Supply Chain, do not change physically from the factory door to the final sale. A Value Chain provides a breakdown of the Total Revenue of a good into the Marginal Revenues of each Value Chain component (which sum to Total Revenue).
The Value Chain of the t-shirt includes each element of value of the t-shirt at time of purchase at the retailer:
tshirt_value_chain.png
DETAILED INFORMATION:
WHERE TO FIND AN INDUSTRY’S SUPPLY CHAIN
In IMPLAN, you can explore an Industry’s Supply Chain from Behind the “i” in
Social Accounts >
Balance Sheets >
Industry Balance Sheet >
Commodity Demand, Filtering by the Industry of interest
Here you will find a list of all of the Industry’s Intermediate Inputs. Gross Absorption and Gross Inputs reflect all demand. Regional Absorption and Regional Inputs reflect local demand. Filtering by the Industries that produce the Regional Inputs allows you to explore the next round of the Supply Chain. Exploring the Supply Chain will exponentially widen in each round of suppliers purchasing from their suppliers.
WHERE TO FIND A PRODUCT’S VALUE CHAIN
The Value Chain of a good cannot be found Behind the “i” in IMPLAN. Instead you’ll need to explore the Excel file of the IMPLAN Margins. The full value of good is available in the Commodity tab of this excel file. These Margins are not regionally specific.
For example, let’s look at the Value Chain for Mens and boys cut and sew apparel, which includes T-shirts:
tshirt_value_chain_excel.png
The chart below displays all non-zero values in the Value Chain:
Commodity
Commodity Name
Margin Commodity
Margin Commodity Name
MarginValue
3125
Men’s and boys’ cut and sew apparel
3125
Men’s and boys’ cut and sew apparel
0.372592838
3125
Men’s and boys’ cut and sew apparel
3400
Wholesale services – Other nondurable goods merchant wholesalers
0.123361792
3125
Men’s and boys’ cut and sew apparel
3401
Wholesale services – Wholesale electronic markets and agents and brokers
0.009337612
3125
Men’s and boys’ cut and sew apparel
3409
Retail services – Clothing and clothing accessories stores
0.477160698
3125
Men’s and boys’ cut and sew apparel
3414
Air transportation services
0.001306514
3125
Men’s and boys’ cut and sew apparel
3415
Rail transportation services
9.04E-05
3125
Men’s and boys’ cut and sew apparel
3417
Truck transportation services
0.01615018
This shows that 37% of the value of a t-shirt sold at a retailer is the Marginal Revenue/Producer Price of the t-shirt. 12.3% of the Purchaser Price of a retail t-shirt is the Marginal Revenue for the merchant wholesaler and 47.7% is the Marginal Revenue for the retailer, and so on.
ANALYZING A SUPPLY CHAIN VS. IMPACTING A VALUE CHAIN
The Supply Chain of the affected Industries are being analyzed In every IMPLAN analysis. This is the foundation of Input-Output analysis and is how IMPLAN calculates backward linkages.
The full Value Chain of a good is only analyzed when Total Revenue has been entered into a Commodity Event.
Only the retail portion of Total Revenue is analyzed when Total Revenue has been entered into an Industry Event with a retailer or wholesaler specified.
SUPPLY CHAIN LEAKAGES
Remember, Supply Chains describe the chain of Intermediate Input purchases, or backward linkages, that are included in an Industry’s Spending Pattern and the Spending Patterns of its supplier, and so on. When Intermediate Input purchases are bought from Industries in the Selected Region this supports an economic effect in that Region. In the case of the Direct Industry’s Supply Chain, local industry purchases of Intermediate Inputs specifically support Indirect Effects. All of an Industry’s purchases cannot be sourced from Industries within the Region even at the U.S. level. The purchases of imports and institutional production (other than srap produced by households) are exogenous to a Region’s multipliers in IMPLAN. This simply means these purchases are leakages and do not generate effects.
IMPLAN calculates the Supply Chain leakages for you by setting the Local Purchase Percentage (LPP) on Commodity purchases in an Industry’s Supply Chain to the Regional Purchasing Coefficient (RPC) for the given Commodity unless you specify otherwise. The only time IMPLAN will default the LPP of a Commodity purchase to 100% is in a Commodity Event.
IMPLAN determines the industry and institution producers of a Commodity in a Region based on the Market Share for the Commodity.
VALUE CHAIN LEAKAGES
As mentioned, only the retail portion of Total Revenue is analyzed when Total Revenue has been entered into an Industry Event with a retailer or wholesaler specified. The other portions of Total Revenue are leakages because without knowing what was purchased at the retailer or wholesaler, the full Value Chain cannot be identified.
Because the components of a Value Chain for a good are made up of Commodities, some portion of the Commodities in the Value Chain may be produced by institutions in the Region, in which case these portions are leakages.
When LPP is set to a value less than 100% in a Commodity Event evaluating a Value Chain there will also be leakages. When LPP to is set to “SAM” in this situation, the leakage of each Commodity in the Value Chain is based on the RPC for each Commodity.
https://implan.com/wp-content/uploads/Market-site-Logo-resized-2-1.jpg00Joe Demskihttps://implan.com/wp-content/uploads/Market-site-Logo-resized-2-1.jpgJoe Demski2020-03-06 11:17:362020-03-06 11:17:49Supply Chain versus Value Chain
Industries, households and government all make capital purchases. In IMPLAN, Capital simply refers to durable assets and devices that can be thought of as an investment for the purchaser. For Industries, this includes purchases that are used but not consumed in production like Intermediate Expenditures. For households, this includes all purchases that are used but not consumed in household daily life (consumables include things like food, electricity, water and clothes). Capital purchases are things that will be used on an ongoing basis and depreciate and degrade over time until it needs to be repaired or replaced (through an expenditure of capital).
Capital Expenditures are not assumed and analyzed for you when using IMPLAN’s most common Event Types. For example, when analyzing an Industry Event, IMPLAN estimates the impact of Intermediate Expenditures and Labor Income spending by the Industry. IMPLAN also estimates how much the Industry will spend on Taxes on Production and Imports, Less Subsidies (TOPI) and Other Property Income (OPI). However, IMPLAN will not estimate the impact of the TOPI and OPI being spent. This is because this would require assumptions to be made about where, when, and how these dollars would be reinvested. For this reason, IMPLAN leaves it up to each analyst to separately analyze how the government may use tax revenue via TOPI or how the Industry and their stakeholders will invest OPI. Perhaps you know the government will be using the property taxes gained within TOPI towards building a new highway, or perhaps you know the Industry will be using some of their Direct OPI to buy a new piece of equipment. These are capital expenditures that can be analyzed independently from an the businesses operations as these are one-time purchases.
There are three Institutional Spending Pattern Event Types in IMPLAN designed to analyze capital expenditures: Federal Government Investment, State/Local Government Investment, and Capital. These Events are recommended when little to no information is available about the specific capital expenditure. This article details additional options and when each is most appropriate to use.
DETAILED INFORMATION:
CONSTRUCTION
Capital expenditures may be invested in new construction. In this case, the capital expenditure going towards cost of construction should be entered in one of the IMPLAN Construction Industries via an Industry Output Event. Note that new construction is different than repair and maintenance of facilities and needs to be analyzed appropriately. Learn more about analyzing construction impacts here.
Only the cost of a structure itself should be analyzed through an IMPLAN construction Industry. The Furnishings, Fixtures and Equipment (FF&E) that will be added to the structure to make it fully operational are not captured in construction spending.
MACHINERY, TECHNOLOGY, & FF&E
Non-construction capital investments include durable tools and appliances purchased and used again and again over time by businesses, households, or government. They can include technology, equipment, or machinery. The first consideration with this is whether or not the capital purchase can be made in your Region. Often times, these large items are not produced locally and therefore should be excluded from your analysis (as they are considered leakages).
Furniture, Fixtures, and Equipment (FF&E) are large, movable investments that businesses make. Like any purchase, choosing the right Event Type & Event settings for your analysis can be confusing. Follow the questionnaire and corresponding chart in the Industry vs. Commodity article to better understand how to enter an FF&E purchase as an Event in IMPLAN.
If you do not have enough information to categorize your capital purchase using the questionnaire, either do not analyze the purchase or skip to the next section of this article to explore a couple more options.
INVESTMENT AND INSTITUTIONAL SPENDING PATTERNS
When little is known about the purchase being made you could consider using an Investment Spending Pattern to model the FF&E expenditures. This file has the general capital investment spending patterns for FF&E alone and for FF&E and construction for consolidated Industries. These spending patterns can be put into IMPLAN by analyzing a list of the associated Commodity Events (these can be copied about pasted into a the Commodity Event tab of the Event Template).
If you have no idea where the investment will be spent, there is one final option. You can use an Institutional Spending Pattern Event. The Federal Government Investment and State/Local Government Investment Spending Patterns are appropriate for analyzing general government investment in capital. Although not typically recommended, a general capital investment could be analyzed with the Capital Spending Pattern Specification. The Institutional Spending Pattern Event Type represents a general spending distribution for measuring broad Institutional activity in your Region. The Capital Institutional Spending Pattern reflects the distribution of Commodity purchases for capital investments by all Industries in the Region and Data Year. In an Institutional Spending Pattern Event, enter the total investment amount Value. That Value is then split across a list of Commodities (which can be viewed in the Menu under Advanced). This Event Type will analyze the purchases of local Commodities based on the rate in which each Commodity is purchased in your Region in that Data Year.
https://implan.com/wp-content/uploads/Market-site-Logo-resized-2-1.jpg00Joe Demskihttps://implan.com/wp-content/uploads/Market-site-Logo-resized-2-1.jpgJoe Demski2020-02-27 17:10:152020-02-27 17:15:18Analyzing Capital Investments
INTRODUCTION:
Whether you are analyzing a capital investment, an Industry’s bill of goods, results of a visitor survey, or some other collection of spending data the question often arises, should I analyze this purchase as an Industry Output Event or a Commodity Output Event? Should the analysis be framed from the perspective of the product or the producer?
Because there are several considerations when making this selection appropriately this article is designed to assist you in making a well informed choice.
IDENTIFYING THE PURCHASE SCENARIO:
The questionnaire and table below outlines all of the potential possibilities when analyzing a purchase. For example, if you know there is a purchase from a local manufacturer, you can simply use an Industry Output Event and specify the appropriate manufacturing Industry. We start with where the item was purchased. By following the outline below, you can find the correct corresponding Event Type & Event settings numbered in the table.
If you do not have enough information to categorize your purchase into one of the scenarios below, the purchase should be omitted from your analysis. Without the necessary information to define the purchase as an Event, IMPLAN has no way of estimating how the purchase affects the Region you’ve selected. In the case of specifically capital purchases, there are a couple other options to consider here.
FROM WHOM WAS THE PURCHASE MADE:
A. Manufacturer
B. Local retailer or wholesaler
C. Non-local retailer or wholesaler
A: Purchase made through manufacturer
Was the product produced locally?
Yes: move on to question A2
No: Purchase Scenario #7
Not sure: Purchase Scenario #5
Do you know what they bought or who they bought it from?
What they bought: Purchase Scenario #3
Who they bought it from: Purchase Scenario #1
Note: Making this choice is most relevant for consideration when the supply of the good or service may be distributed across multiple Industries or Institutions such as government and inventory, which differ by Region. Check the Market Share of a good or service in your Region.
B: Purchase made through local retailer or wholesaler
Do you know what they bought?
No: Purchase Scenario #2
Yes: move on to question B2
Was the product produced locally?
No: Purchase Scenario #2
Yes: Purchase Scenario #4
Not sure: Purchase Scenario #6
C: Purchase made through non-local retailer or wholesaler
Do you know what they bought:
No: Purchase Scenario #7
Yes: move on to question C2
Was the product produced locally:
No: Purchase Scenario #7
Not sure: Remove margins, calculate Producer Marginal Revenue then proceed to Purchase Scenario #5
Yes: Remove margins, calculate Producer Marginal Revenue then proceed to Purchase Scenario #3
PURCHASE SCENARIOS
#
Event Type
Event Specification
Event Value
Margins Selection
LPP Setting
1
Industry Output
Manufacturer
Price paid at place of purchase
N/A
N/A
2
Industry Output
Retailer or Wholesaler
Price paid at place of purchase
Total Revenue
N/A
3
Commodity Output
Product
Price paid at place of purchase
Marginal Revenue
LPP = 100%
4
Commodity Output
Product
Price paid at place of purchase
Total Revenue
LPP = 100%
5
Commodity Output
Product
Price paid at place of purchase
Marginal Revenue
LPP = “SAM” (Region’s Commodity RPC)
6
Commodity Output
Product
Price paid at place of purchase
Total Revenue
LPP = “SAM” (Region’s Commodity RPC)
7
The purchase cannot be analyzed as an Event in the Region
Learn more in the following articles where these purchase scenarios are further explained and exemplified:
Retail and Wholesale: Industry Margins
Retail and Wholesale: Commodity Margins
Analyzing Capital Investments
Manually Marginning Bill of Goods (see example 2 to understand how to manually margin a Commodity and find the Producers’ Marginal Revenue)
ABP Bill of Goods Using Commodity or Industry Events
https://implan.com/wp-content/uploads/Market-site-Logo-resized-2-1.jpg00Joe Demskihttps://implan.com/wp-content/uploads/Market-site-Logo-resized-2-1.jpgJoe Demski2020-02-27 17:06:522020-02-27 17:07:01Industry vs. Commodity Output
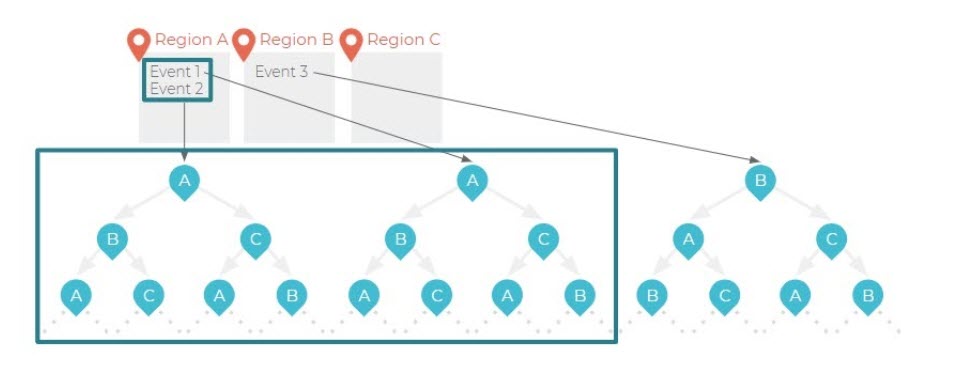
When using Multi-Regional Input-Output (MRIO), with a few Events in a few Regions, it can become cumbersome to understand how the Filters will display your Results. Here’s a guide on how to use the Filters to see the Results you want to report.
REGIONS & EVENTS:
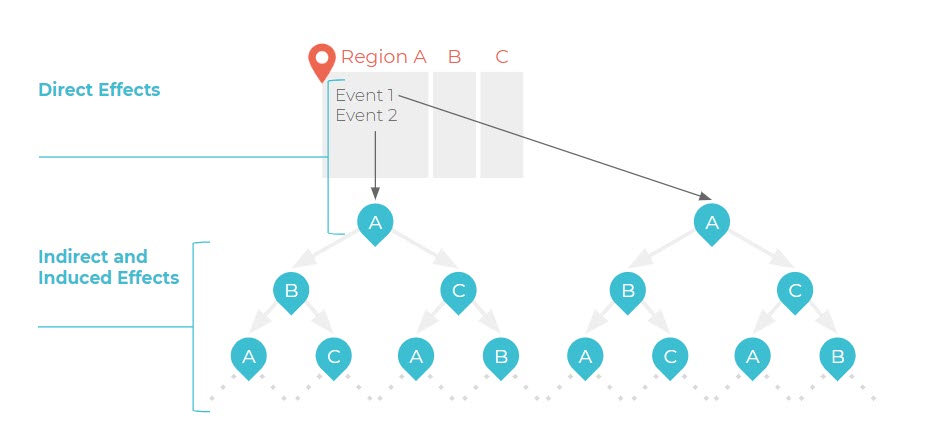
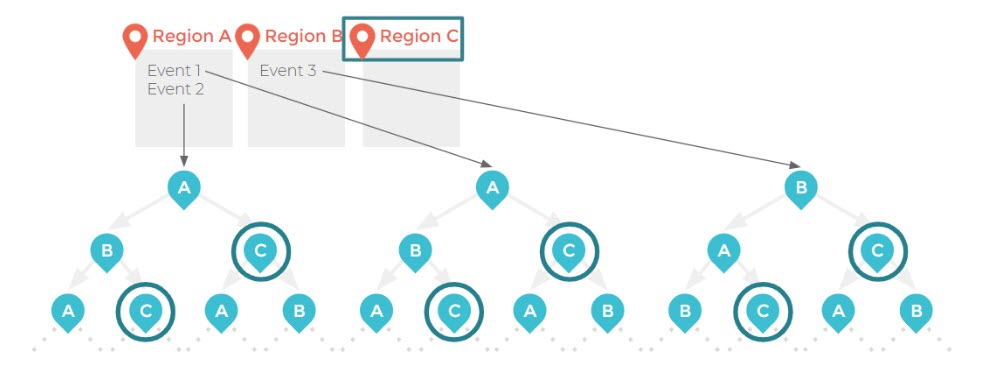
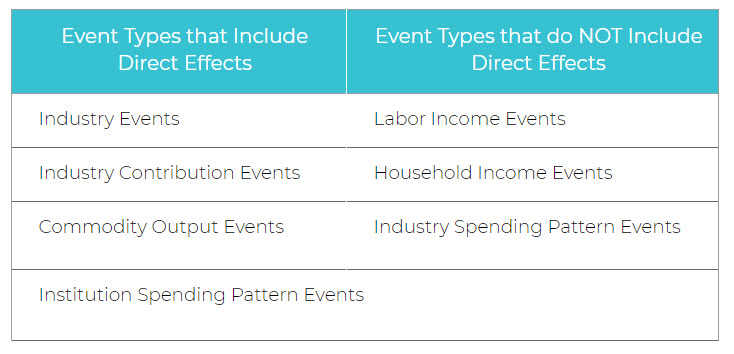
Let’s walk through an example with three Regions: A, B, and C. Here we have two Events generating Direct Effects to start; both in Region A. These Direct Effects in Region A created Indirect and Induced Effects in all three Regions as illustrated below.
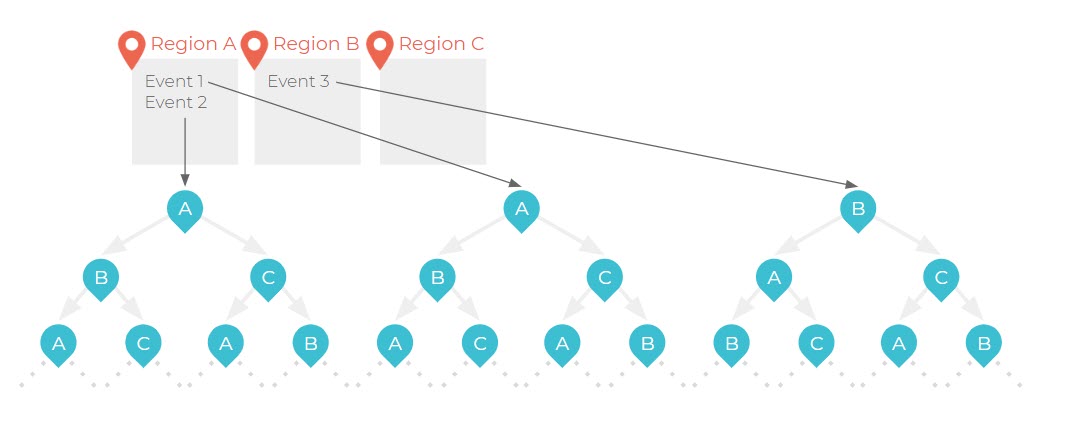
Using MRIO, you can have Events in more than one Region. This example shows how we have Direct Effects now in Region A (Event 1 and Event 2) and Region B (Event 3). Each of these three Events now yields Indirect and Induced Effects in all three Regions.
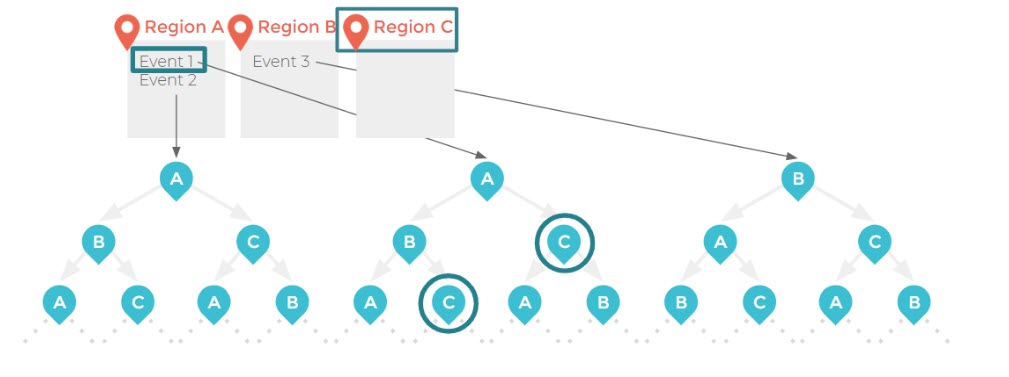
FILTERING YOUR RESULTS:
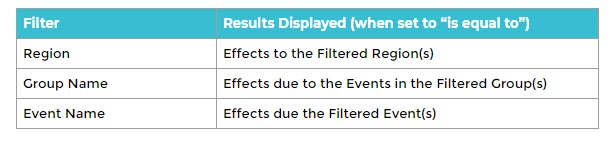
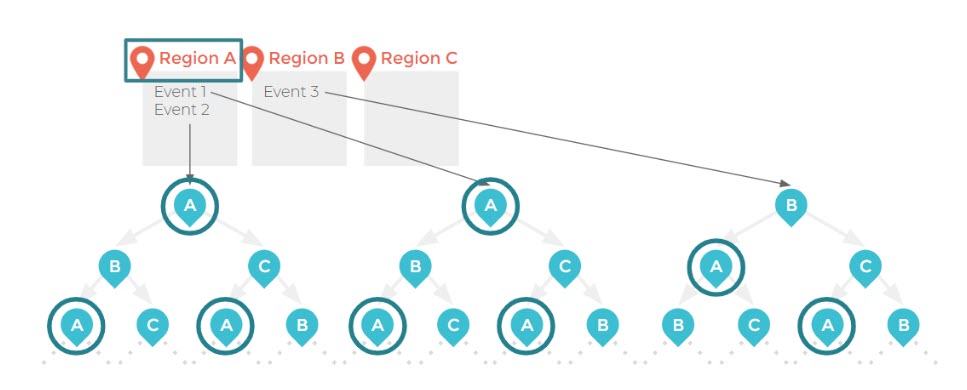
The Results screen will default with no Filters applied and in the current Dollar Year. If you apply a Region Filter for Region A, your Results will display the total Effects to Region A as a Result of the analysis. In this analysis there are three Events, two of which occur in Region A. Filtering by Region A in this analysis will display the resulting Effects to Region A due to all three Events in the analysis.
FILTER REGION A
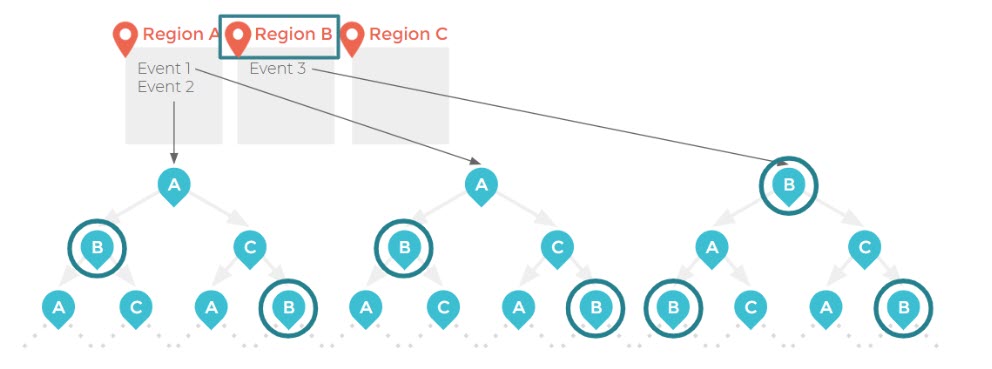
If you remove the Region Filter for Region A and replace it with a Filter for Region B, you will see total Effects to Region B due to all three Events in the analysis.
FILTER REGION B
Changing the Region Filter to only include Region C will not yield a Direct Effect, as there was no Event that occurred in Region C. You will, however, see Indirect and Induced effects in Region C because of the three events.
FILTER REGION C
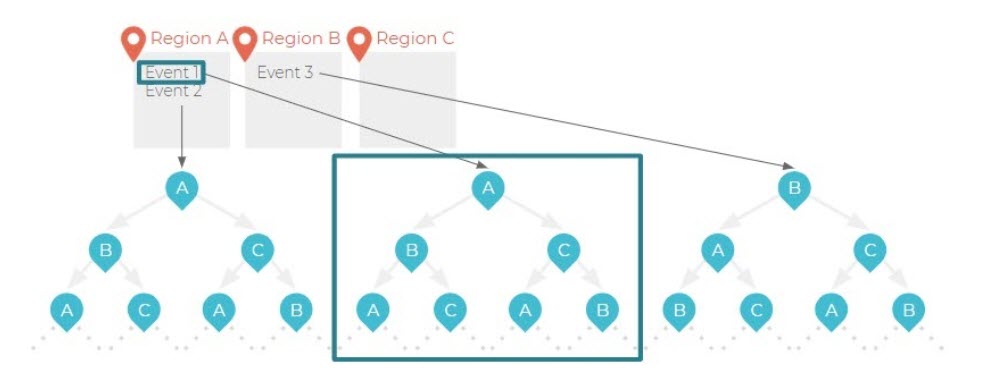
If you remove the Region Filter completely and choose Event 1 from the Event Filter, your Results will display the total Effects of Event 1, in all three Regions.
FILTER EVENT 1
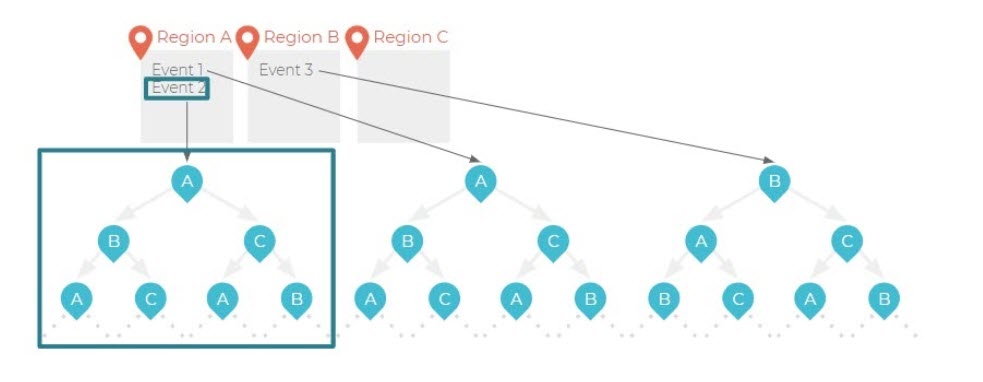
Applying the Event Filter for only Event 2 will show the effects of only this Event in all three Regions.
FILTER EVENT 2
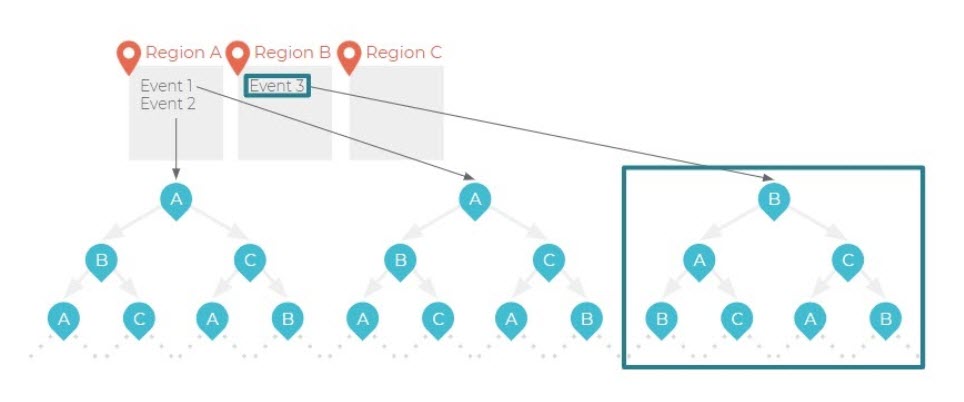
Applying the Event Filter for only Event 3 will show the effects of only this Event in all three Regions.
FILTER EVENT 3
If you remove all Event Name and Region Filters and instead Filter your Group Name for Group 1, you will see the impact of every Event in this Group (in this example Group 1 includes Event 1 and Event 2) across all three Regions.
FILTER GROUP 1
Where things start to get complicated is when you add multiple Filters at the same time. You can Filter for any number of Event Names, Group Names, or Regions at the same time. Just be careful to ensure you know what you are seeing when you do so. In the example below, the Filter was set for Event 1 and Region C. Therefore, we are only seeing the Effects of Event 1 on Region C.
As with all Industries in IMPLAN, there are certain considerations to make when examining the complicated world of banking and lending. Generally speaking, to model the operations of a bank, IMPLAN Industry 441 – Monetary authorities and depository credit intermediation would be the correct choice. This Industry includes commercial banks, savings and loans, and credit unions. Total Employment, Employee Compensation, Proprietor Income, and/or Output can be run through this Industry. But what if you want to examine the economic impact of the loans that were made? Well, that depends on how the money will be spent.
CONSIDERATIONS ON LOANS:
Analyzing the economic impact of loans is tricky. The first consideration is that of time. A loan may be spread across multiple years and how it is spent may also cross years. In IMPLAN, each year of spending should be modeled separately.
Also, if this bank didn’t give the loan, there is a possibility that another bank would give the loan. Be careful in attributing the entirety of the investment solely to the existence of this one bank and loans it provides.
The biggest matter, however, is how the loan will be spent by the borrower. There are no lack of possibilities as to how the money could be used, each having drastically different economic impacts. In order to measure the economic impact of the loans, you have to first know how the loan will be spent. Keep in mind that the loan may be spent across a few categories.
OPERATIONS
If the loan will be spent on operations for the business, this can be analyzed using a standard Industry Output Event. Choose the appropriate IMPLAN Industry and enter the loan amount Value. Note that the operations spending may not just be across the board, it may specifically be for new hires or employee raises.
If the entirety of the loan is modeled through operations, you are assuming that none of the money will be spent on construction or capital. This means that increasing Output doesn’t require any capital purchases.
CAPITAL
Construction
The loan may be used to fund new construction. If this is the case, the loan amount should be entered in one of the IMPLAN construction Industries via an Industry Output Event. Note that new construction is different than repair and maintenance of facilities and needs to be analyzed appropriately.
Machinery, Equipment, & FF&E
Perhaps the loan will be used for a large capital purchase. This could include an investment in real estate, technology, or machinery, for example. The first consideration with this is whether or not the capital purchase can be made in your Region. Often times, these large items are not produced locally and therefore should be excluded from your analysis.
OTHER USES
Perhaps the loan will actually be used to pay off property taxes. They might also use it to pay off another loan or creditor. If the borrowing is to avert a short term crisis, you may be able to argue that the entire operations of the company was dependent on that loan in order to avoid closing completely.
HOUSEHOLDS:
Banks lend money to households for various purposes, as well. It may be for the purchase of a home, student loan, car, or debt consolidation. Just with corporate lending, in order to analyze these loans in IMPLAN, you must decide how the money will be spent and enter the values in the appropriate Industry.
INTEREST:
A full debt repayment amount should not be run through the banking Industry in IMPLAN. The payment of principle is considered an asset transfer which has no economic impact. However, if the bank that is receiving the payment is within your Region, the interest portion of the debt can be run through the banking Industry. If the bank that is being repaid is out of Region, the entirety of the debt repayment is considered leakage and should not be included.
Interest payments can be thought of as being separated into two parts: interest payments for lending of assets (like cash) and interest payments that are for the value of services provided by financial institutions. Interest for the value of services are not directly measurable and must be estimated as these are included in the Intermediate Expenditure of the bank. The value of the imputed interest would be the difference between the interest income the business could earn were it to lend that money and the interest paid by the bank on the balance of the account. That difference functionally represents a service charge for maintaining the account, providing credit cards, processing information, etc.
As another example, a business might borrow money from a bank and pay an interest rate of 5%. The bank would give the business various services like loan processing. In this case, the imputed interest would be the difference between 5% and the amount of money the bank could earn were it to lend the same amount of money without providing any services. The remaining type of interest income, much like interest income that is solely based on returns to lending, is measured on a net basis and is included as a part of Other Property Income (OPI).
FINAL CONSIDERATIONS:
In IMPLAN, an Industry’s Leontief Production Function represents operational spending only. It does not include investment in capital goods and therefore
So, we have looked at what the bank did with all that loan money. It’s important, however, to consider the alternatives. If the bank didn’t invest in that million dollar loan to a software company, they might have invested in a multi-family housing structure or personal loans for used car purchases. Perhaps the bank could keep the money in reserves. These examples would obviously have very different effects on the local economy. By investing in the software company, the bank no longer has the capital to fund apartment construction or personal loans. The bank foregoes the potential gain from the alternatives and this is the opportunity cost.
https://implan.com/wp-content/uploads/Market-site-Logo-resized-2-1.jpg00Joe Demskihttps://implan.com/wp-content/uploads/Market-site-Logo-resized-2-1.jpgJoe Demski2020-02-21 14:10:112020-02-21 14:10:24Loans: Banking on It
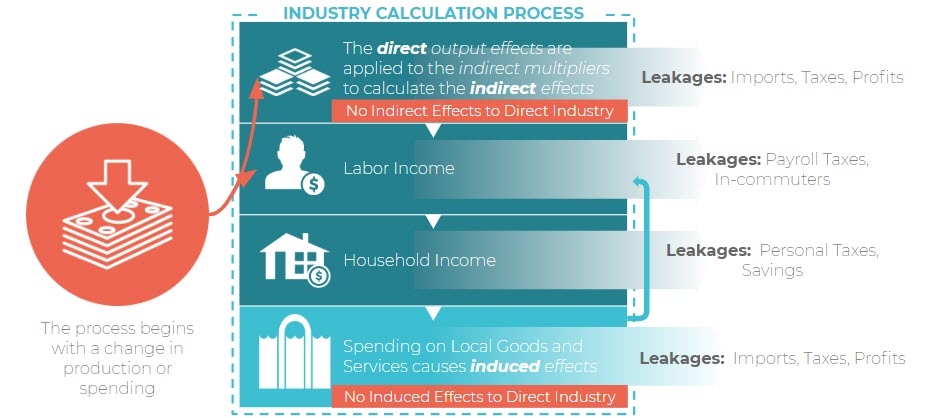
Industry Events indicate that you know what Industry or Industries are experiencing the change in production and you are interested in targeting those specific Industries.
There are four different types of Industry Events:
Industry Output
Industry Employment
Industry Employee Compensation
Industry Proprietor Income
These four Industry Event Types represent each value that can be entered into a single Industry Event. Picking among the 4 types should be determined by which value you have available about the industry.
When more than 1 value is known, those additional values can be entered in the Advanced Menu.
Total vs Marginal Revenue selection is available for Retail and Wholesale Industries in the Advanced Menu, and will default to Total Revenue.
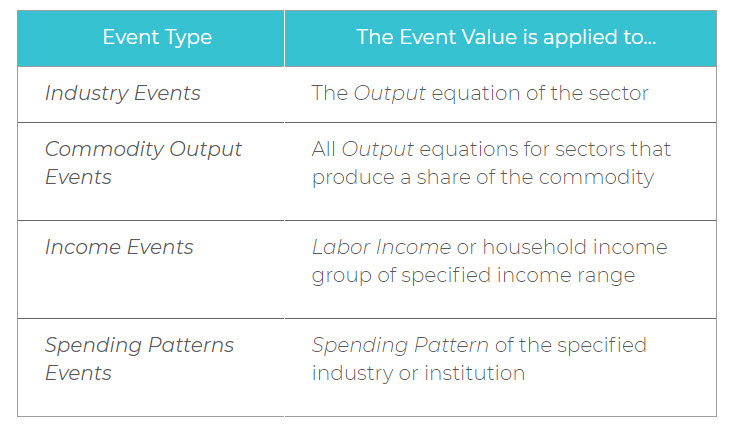
COMMODITY EVENTS
You would use if you knew there was a change in Commodity demand or production but didn’t know what Industry or Institution (e.g., government) would meet the demand. For example, you know there will be an increased need for nursing home-care in the Region because of an aging population, but you don’t know what the mix of private hospitals, nursing homes, and government hospitals will provide this need.
Total vs Marginal Revenue selection is available for Commodities that can be purchased via a wholesaler or retailer in the Advanced Menu, and will default to Total Revenue.
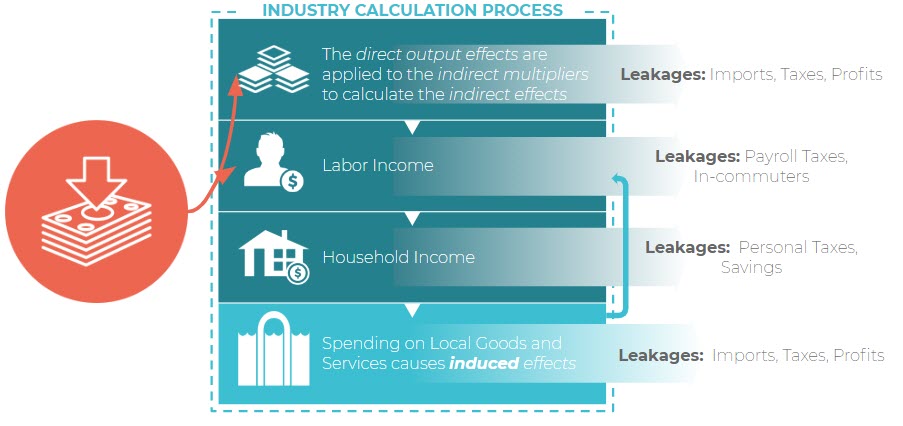
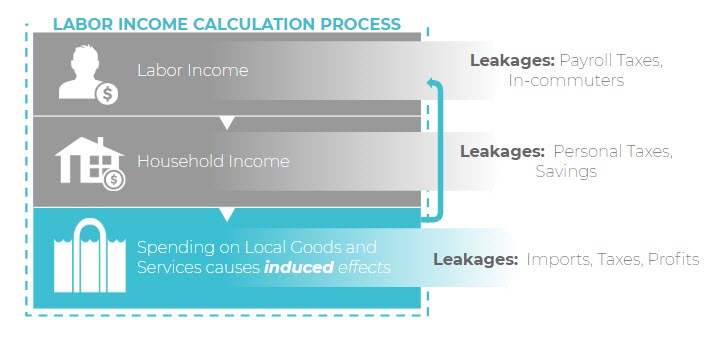
LABOR INCOME EVENTS
This Event type is appropriate if you’d like to model a change in labor payments isolated from Industry production- e.g. examining the impacts of a wage increase for current employees.
Total Labor Income should include all new labor payments in the Study Area- New income for all workers in the region even if they don’t live there (local workers and in-commuters), including their –
i. Payroll tax
ii. Personal tax
iii. Savings
Note: the model will automatically deduct in-commuting income, payroll tax, personal tax, savings, and imported goods and services. All payroll taxes stay in the location of the employment. That is, only commuters’ post-payroll-taxes-income is deducted.
With a Labor Income Event, you can specify whether the income is earned by wage and salary employees or sole proprietors (or some combination of the two) but you cannot specify the specific household income categories receiving the income— after deductions, the remaining income is distributed across all household income groups according to the household column totals in the SAM. At this point the income is applied to the income group specific multipliers.
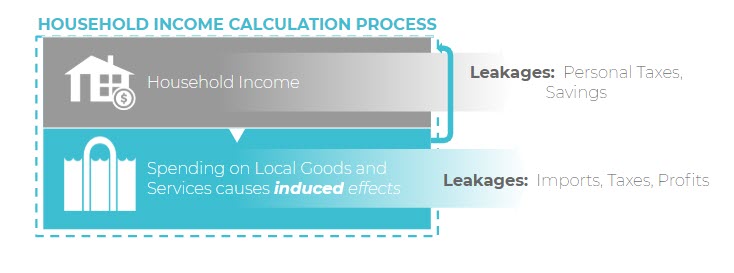
HOUSEHOLD INCOME EVENTS
This Event type is appropriate if you’d like to model changes in Household Income that are independent of production and payroll.
Total Income should include all new household income in the Study Area- New income for all residents in the region, including their –
i. Personal tax
ii. Savings
Note: the model will automatically deduct personal tax, savings, and imported goods and services. The model assumes payroll tax and in-commuting income has been excluded from your total income entry. Benefits should be included as household income in your entry.
The leftover amount after deductions is then applied to the multipliers. In this case, you can specify the particular household income group(s) receiving the income.
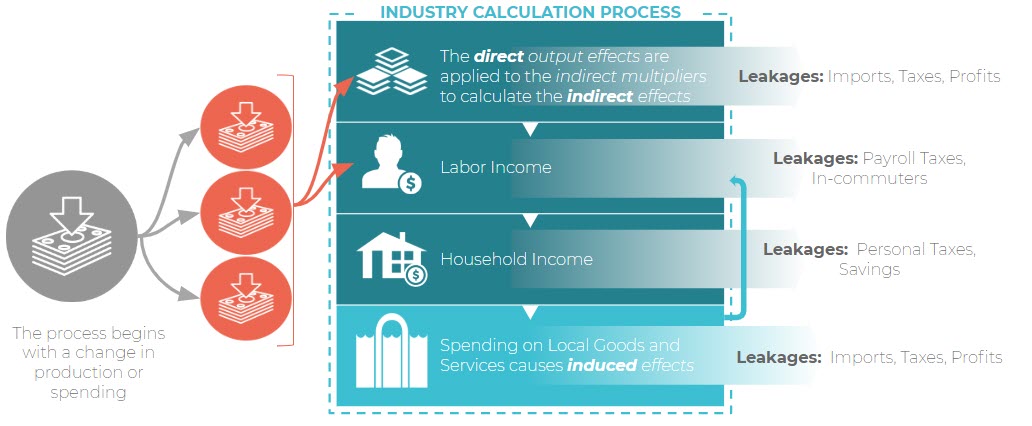
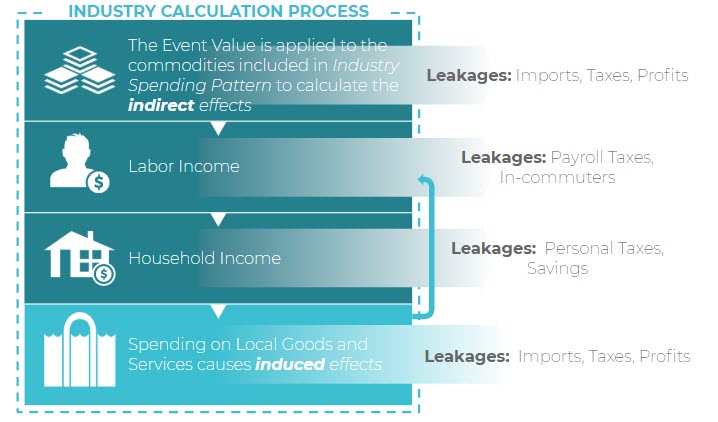
SPENDING PATTERN EVENTS
Industry Spending Pattern Events are appropriate if you have the data required to build your own spending pattern based on what your specific Industry purchases. They are also useful when an Industry needs to be modified beyond the Event customization available in an Industry Event. This is highly useful for making an IMPLAN Industry more specific to your business/impact using Analysis-by-Parts.
INDUSTRY CONTRIBUTION ANALYSIS EVENTS
Industry Contribution Analysis is a method used to estimate the value of a Industry or group of Industries in a region, at their current levels of production, rather than estimating the value of a change. While the focus of the analysis still looks at backward linkages, the purpose of this analysis differs. When considering the Indirect and Induced Effects of an impact analysis, we are looking at how Industries in our Region will respond to a change in the key Industry or Industries being modeled in our Events. Industry Contribution Analysis shifts this framework to see what Industries and what level of production in these Industries is being supported by the current activity of the target Industry or Industries in the Region. Contribution Analysis is a unique method which affects a constraint upon the Model by removing feedback linkages or buy backs to the Industry being analyzed.
Find more information about Industry Contribution Analysis here to learn more and determine if an Industry Contribution Analysis Event is right for your study.