Construction: Building the Right Model

INTRODUCTION:

There are a few special considerations for modeling construction impacts. Not only are all projects different, they need to be carefully considered in IMPLAN.

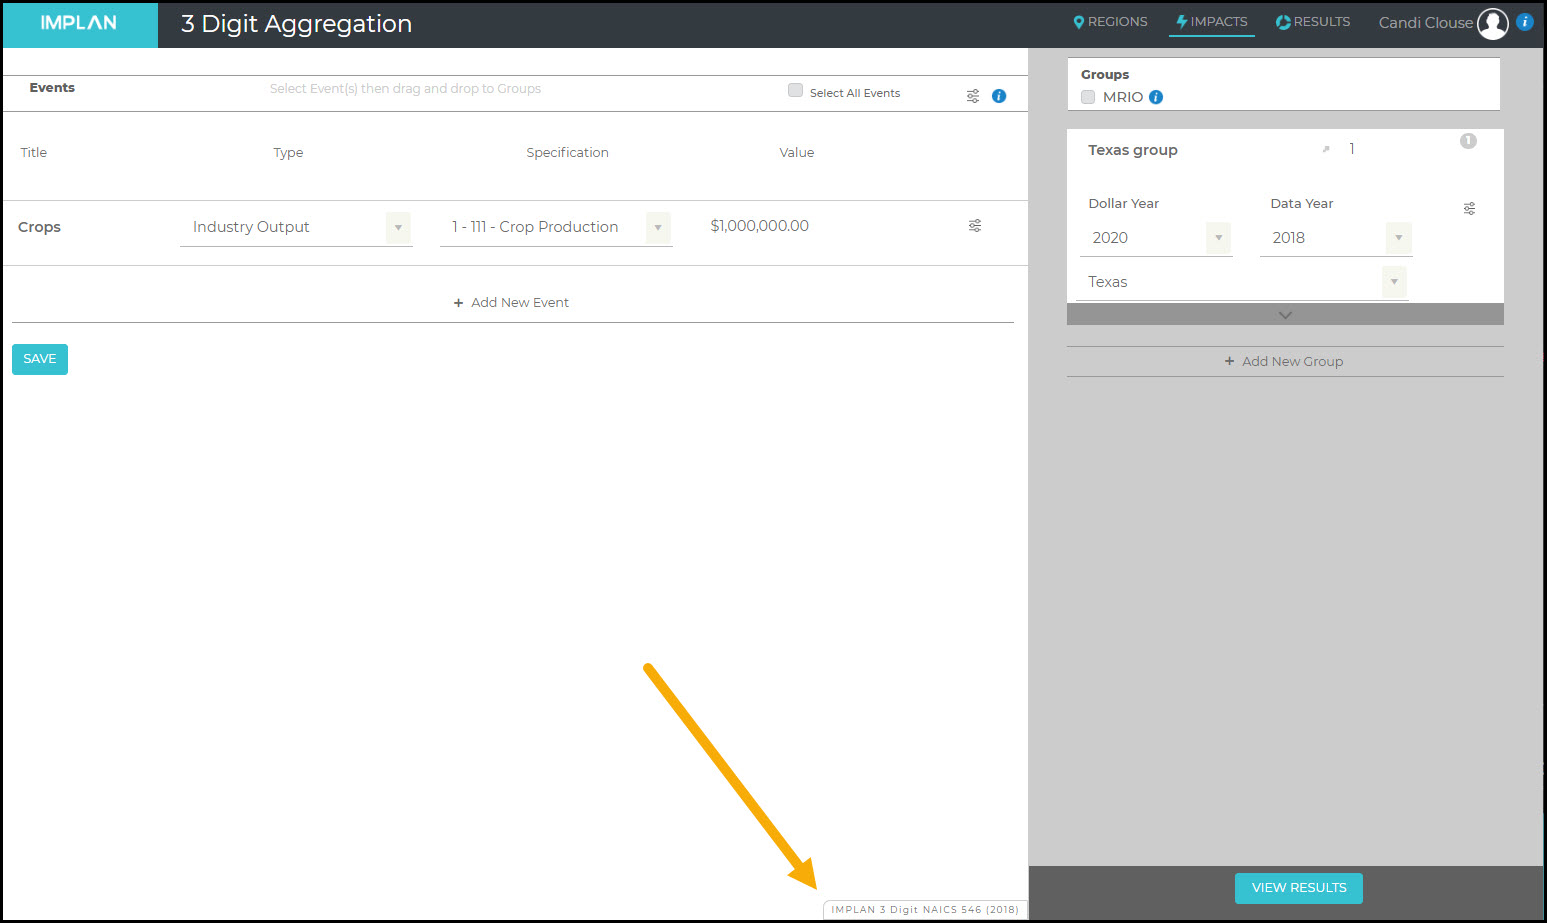
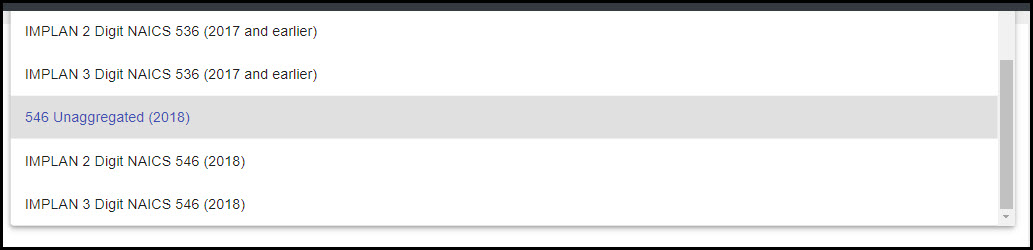
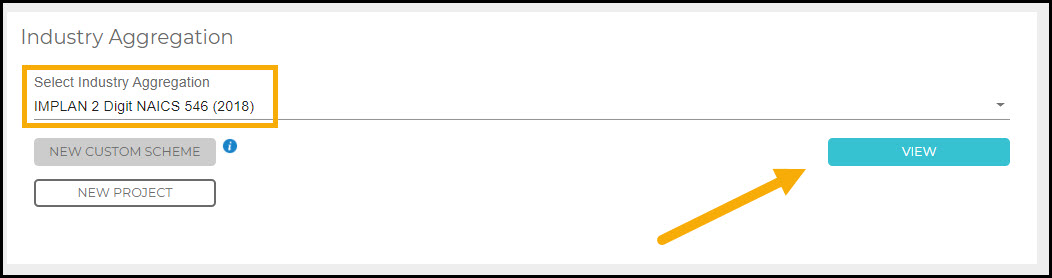
Construction Industries don’t have a perfect NAICS crosswalk as the other Industries do.  Instead, there is the file Definitions of IMPLAN’s 546 Construction Industries found on our 546 Industries, Conversions, Bridges, & Construction – 2018 Data page. This is where you can find which Industry will be best to use whether you are modeling the construction of a power plant, office, or even a museum.

The value entered in Industry Output for construction should be the full cost of the structure, and only the structure. This includes hard costs and soft costs.  Because Employment, by definition, is based on where the job is located not where an individual resides, Employment should include the full value full-time, part-time and temporary Employment on the job site during the year. Additional considerations of costs attributed to construction are considered below.


SQUARE FOOTAGE:

Sometimes rather than construction cost or Employment, only the square footage of the project is known. Calculators to convert square footage to construction costs, by building type, can be found online.


EMPLOYMENT & SPECIALIZED SKILLS: 

While all Industries are likely to source some Employment from outside the region, construction Industries are among a group that may be more likely to do so, because in many cases either:

  • The needed skills for a project may not be available in the region
  • Contractors may be sourced from outside the region

In these cases, it is important to remember that Employment is site based in IMPLAN, so even if a worker is brought in from outside the region they still count as “local” employment during the period of their work.

It is sort of unreasonable to assume that these outside workers will spend their income in the same way as residents. Thus, what we will modify is the Labor Income values for the construction Industry. The Employee Compensation and Proprietor Income should be reduced by the amount of payroll that is going to workers outside the region, less the regional commuting rate. But do these outside workers then have no local impacts? That also is unlikely if they are in the region for any period. The best way to capture these impacts is by using per diem spending patterns, ideally from the company’s budget or allowances, but when these are not available government per diems can be used as an estimate. This not only captures a more reflective amount of local spending by these temporary residents, but it also prevents their income from being spent on common resident household expenditures like utilities and the costs of owning a home.

An in-commuting rate is gross regional rates in which local workers commute out of the region to go home. In the calculation of the Induced Effects the in-commuting regional rate reduces the total income before it’s distributed to local households. To avoid underestimating the effects of Labor Income you will want to be sure to account for the commuting rate from the Social Accounting Matrix.


CONTRACTORS:

Construction employment differs between new construction and maintenance/repair. New construction is considered a capital purchase, which is a final demand (not an intermediate demand). Therefore, new construction contractors and subcontractors do not appear in any Industry’s production function. So, in new construction the contractors and subcontractors are found in the Direct Effect as proprietors. Maintenance and repair, however, is not considered a final demand, therefore it can be purchased by Industries. So for maintenance and repair, contractors and subcontractors are found in the Indirect Effect.


LAND VALUES:

When construction impacts are being considered, a question that often arises is: “What is the impact of the sale of the land?” The truth is, the sale of the land has very little impact on the economy. The purchase of the land necessary for a construction activity should not be included as Industry Output for the construction Industries. Why? Land sales are considered asset transfers, where one person receives money while the other receives tangible property. Thus, the land sale itself has no value in IMPLAN. Some small impact may be captured however, by creating an Event for real estate fees, and for large commercial projects, legal fees.


HARD & SOFT COSTS:

Construction spending patterns in IMPLAN include architectural engineering, legal fees and other common soft costs, so these should be included into the Industry Output value. However, if you want to specify these values or have soft costs that are significantly different than a typical construction project in your selected Industry, these can be modeled separately.

A common question we hear is how to handle interest payments for pre-development or construction loans. If these are to be included in your model, ensure that it is only the interest portion of the loan, not any principle, as that is considered an asset transfer and has no impact. Interest can be input in Industry 441 – Monetary authorities and depository credit intermediation.


FURNITURE, FIXTURES, & EQUIPMENT:

Furniture, Fixtures, and Equipment (FF&E) are large, movable investments that businesses make.  FF&E consists of movable furniture, fixtures, and other equipment that is not directly attached to a building.  FF&E should not be modeled through the construction Industry.

Often times, the specialized FF&E will not be produced in your region of study. If you know that everything is being brought in, it is considered leakage and you can omit the spending from your model. Investments like these can be captured but must be modeled separately. You may know that it was purchased through a local retailer or wholesaler, so then you can model the purchases through the appropriate Industry. Maybe you know that some of the purchases will be sourced locally. Then you can again choose the appropriate Industry, like 370 – Wood office furniture manufacturing, and enter the spending.  

You could also consider using an Investment Spending Pattern to model the FF&E expenditures. This file has the general capital investment spending patterns for FF&E alone and for FF&E and construction for consolidated Industries. These spending patterns can be input into IMPLAN by modeling the associated Commodity Events.


HOUSING CONSTRUCTION & NEW HOUSEHOLD INCOME:

When new housing developments or multi-family apartments are built, there is obviously an economic impact due to the construction. Just because it is built, however, doesn’t necessarily mean that there will be new income in the area. If the residents of the new development are moving from other locations within the region, there is really no impact due to their spending just because the new houses were built. If you can make the argument that a portion of the buyers are coming from outside of your region and that they will be employed, then you can make the assumption that their spending is new and run it through the appropriate Household Income category.  Remember that Household Income needs to be Employee Compensation less payroll taxes.


TEMPORARY AND LONG-TERM IMPACTS:

It is important to distinguish between temporary impacts and long-term impacts. For construction projects, the impact is limited to one time frame. This is unlike the continued operations of a college or a casino that will have yearly impacts.

People love job numbers. It is not uncommon for studies to overstate construction jobs by assuming they are recreated each year. Also, it is not advisable to report rolled-up construction and operational impacts to have job numbers that mix both temporary and ongoing Employment. This is one popular way that input-output analyses overestimate impacts.

The same principles apply to other economic factors as well. The Labor Income, Value Added, and Output of the construction are occurring only over a short period of time and thus have a more limited impact than operational changes. This is best reflected when the two types of impacts are handled separately.


CREATED VERSUS SUPPORTED:

Are the construction jobs created or supported? In most impact scenarios, the Direct Employment impact is considered to be created the first year of the project, but with construction this typically not the case. The reason is that construction jobs are usually supported job to job. Thus new construction projects are keeping construction workers employed rather than genuinely creating new jobs in the economy. Of course, there are some cases where construction jobs clearly are created, such as the real estate boom that occurred in North Dakota because of drilling.

Industry Aggregation

INTRODUCTION:

Did you ever wish you could combine two or more IMPLAN Industries together to run an analysis? Ever wanted to model 2 or 3 digit NAICS? Industry Aggregation is the answer.

Industry Aggregation allows you to combine Industries together. You can create your own aggregation scheme, for example if you wanted to examine the supply chain of all manufacturers producing vehicles, vehicle parts, aircrafts, spacecrafts, boats, railway vehicles, and any other form of transportation manufacturing as one combined Industry. You can also work with Projects using pre-built Industry Aggregation schemes based on North American Industry Classification System (NAICS) Codes, either by NAICS Sector (2-digit) or Subsector (3-digit).


BEFORE GETTING STARTED:

Here are a few things to note before starting work with aggregated Industry schemes. With aggregated schemes, you can model Industry Events, Commodity Events, Labor Income Events, Household Income Events, and Industry Contribution Analysis Events. Spending Pattern Events are not enabled using aggregated schemes.

If you want to use an aggregation scheme, you must start with the aggregation. You cannot aggregate Impacts or Results after the model is built. Also, Regional customization is not allowed in aggregated scheme Projects.

When you aggregate Industries, not only will you create Events using those Industries, but the Results will also be reported in the aggregated scheme. Basically, the aggregation scheme will follow your entire Project. 

While the aggregation happens at the Industry level, Commodities are aggregated on a 1:1 basis with them. When you aggregate Industries, you are also aggregating the associated Commodities.

You will know that you are using an aggregated scheme on the Regions and Impacts screens by looking at the bottom of the screen as shown here.

Aggregation_-_Display_at_bottom.jpg

NAICS AGGREGATION:

IMPLAN has 546 Industries in its more recent Industry scheme which largely corresponds with the North American Industrial Classification System (NAICS) codes. The most detailed NAICS Codes are 6 digits. The fewer the digits (ie 2 digit), the more broad a NAICS Code becomes, including more Industries. IMPLAN Industries vary in the number of NAICS Codes they each include. Most IMPLAN Industries bridge to 3 to 6 digit NAICS Codes. Projects based on 2 or 3 digit NAICS Codes allow you to work with Industries that are broader than IMPLAN’s 546 Industries, as they will include just 22 (2 digit) and 88 (3 digit) Industries respectively. Learn more about the 546 Industries and how they are defined in the Picking an Industry article. In IMPLAN, you can create a Project using a pre-built Industry Aggregation scheme to run your analysis by NAICS Sector (2-digit) or Subsector (3-digit)


QUICK AGGREGATION

To aggregate IMPLAN Industries into either the NAICS Sector (2-digit) or Subsector (3-digit), begin on the Projects screen. Click on NEW PROJECT in the upper right corner of the screen.

Give your New Project a Title and Choose the Aggregation Scheme you wish to use. Next, click CREATE PROJECT.

Aggregation_-_New_Project.jpg

This will take you to the Regions screen and you can proceed as you normally would. The difference is that Behind the i and on the Impacts and Results screens, the Industries that you see will be those by aggregated NAICS codes, instead of the 546 IMPLAN Industries.

Aggregation_-_3_Digit.jpg

LOOKING AT THE DETAILS IN NAICS AGGREGATION

If you want to look at what Industries are included in the 2 digit or 3 digit NAICS aggregation schemes, follow these steps. 

As always, start on the IMPLAN dashboard. Upon clicking on the avatar icon next to your user profile in the upper right, a call out box will open. Choose Preferences. 

Aggregation_-_Preferences.jpg

This will take you to the Industry Aggregation screen.

Aggregation_-_Dashboard.jpg

The default in Select Industry Aggregation is 546 Unaggregated (2018). Using the drop down under the heading Select Industry Aggregation, you can choose IMPLAN 2 Digit NAICS 546 (2018) and IMPLAN 3 Digit NAICS 546 (2018) for the current Industry Scheme. You can also choose 2 and 3 digit aggregation for the 536 scheme (2017 and earlier datasets).

Aggregation_-_Select_Ind_Agg.jpg

In this example, IMPLAN 2 Digit NAICS 546 (2018) was selected. Clicking on VIEW will open up the aggregated scheme.

Aggregation_-_Select_Ind_Agg_2_Digit.jpg

The screen will then display the aggregated scheme. 

Aggregation_-_2_Digit_Display.jpg

Clicking on one of the down arrows below the NAICS Sector (aggregated name) will open up the description to show what IMPLAN Industries are included. Clicking on the NAICS Sector again will close the details.

Aggregation_-_2_Digit_Display_Arrown_Down.jpg

To return to the Preferences screen, click Close. 

Aggregation_-_2_Digit_Close.jpg


CREATING A PROJECT FROM PREFERENCES

You can also start a New Project using a aggregation scheme from Preferences. At the Preferences screen, click New Project.

Aggregation_-_2_Digit_New_Project.jpg

A box will pop up that will prompt you to Create a New Project, exactly as if you started from the Projects screen. Name the New Project and ensure that the Aggregation Scheme represents the desired selection. Then, click CREATE PROJECT.

Aggregation_-_2_Digit_Name.jpg

Now, IMPLAN will direct you to the Regions screen. Choose your Region and continue to model as you would normally. The 546 Industries are now aggregated into the selected scheme. On the Impacts screen, you can see the aggregated Industries under the Specification. 

Aggregation_-_2_Digit_Impacts.jpg

Entering a Value using the aggregated scheme will affect all of the Industries included in that Group, in this case, the 2 digit NAICS Sector. Remember, your Event Specifications and your Results will all be in the aggregated scheme.

Aggregation_-_2_Digit_Results.jpg

USER DEFINED AGGREGATION:

CREATING YOUR OWN SCHEME

Sometimes, you just want to look at a certain group of IMPLAN Industries aggregated in a way that doesn’t follow the standard NAICS 2 and 3 digit breakdown.  Maybe your client wants to look at transportation manufacturing versus all other manufacturing. 

Note this is only available for the current 546 Industry Scheme (2018). You cannot create a customized aggregation scheme for older Industry Schemes

To create your own Industry Aggregation scheme, begin on the IMPLAN dashboard. Upon clicking on the avatar icon in the upper right, a call out box will open. Choose Preferences. 


Aggregation_-_Preferences.jpg

This will take you to the Industry Aggregation screen. Click on the box labeled NEW CUSTOM SCHEME. 

Aggregation_-_New_Custom_Scheme.jpg

This will take you to the New Industry Scheme page. The box on the left side of the screen contains all 546 IMPLAN Industries. To begin your scheme, click on + Add New Industry.

Aggregation_-_Add_New_Industry.jpg

A popup will appear asking you to name your New Industry. For this example, we will create a New Industry for all transportation manufacturing (IMPLAN Industries 340-364. So, we’ll name our New Industry accordingly. Next, hit SAVE.

Aggregation_-_Name_New_Scheme.jpg

The name of the New Industry is now in the box on the right. To add the IMPLAN Industries that we want to include, click on each from the box on the left so that it is highlighted in teal. Next, drag the highlighted set to the New Industry.

Aggregation_-_Custom_Drag_Industries.jpg

The Industries you selected will no longer appear in the box on the left. The box on the right will show the number of Industries included in each New Industry just to the right of the name. In this example, there are 25 Industries in this New Industry. 

To view or edit what Industries are included, click the down arrow and the New Industry will expand to show the list. Here you can also delete and add additional individual Industries. Use the up arrow at the bottom of the list to collapse it.

To change the name of the New Industry, click on the pencil icon. To delete it, click on the trash can icon.

Aggregation_-_Custom_Drag_Number_in_New_Industry.jpg

In this example, we will look at Transportation Manufacturing against all other manufacturing. So, create another New Industry called All Other Manufacturing by following the same process. This group will include IMPLAN Industries 63-339 and 365-391 for a total of 384 included Industries.

To keep the remaining Industries at the individual Industry level, leave them in the box on the left. To create another group that contains the remaining Industries, add another New Industry and include all 217 remaining Industries from the box on the left. You can add all of the Industries that remain on the left to a new Industry on the right by clicking the Select All button.

Aggregation_-_Custom_Drag_Select_All.jpg

Note, there is no undo button, so be careful where you drag your Industries to ensure that they end up in the correct spot. Also, individual Industries will populate in the order you add them in; they will not sort numerically.

Aggregation_-_Custom_Complete.jpg

A popup will remind you that all Industries that are left outside of a New Industry (in the box on the left) will be left as individual Industries in the new aggregation scheme. Click CONFIRM to accept.

Aggregation_-_Custom_Ungrouped_Popup.jpg

A new popup will appear asking for a name for the New Scheme. Once it is built, you can continue to use it across Projects, so give it a logical name to help you find it later.  

Note, once you click on SAVE, your custom aggregation scheme cannot be edited.

Aggregation_-_Name_New_Ind.jpg

IMPLAN is now building the new aggregated scheme. You will see a moving circle spinning on the screen to indicate that it is being created. This will take a few moments as IMPLAN is rebuilding the deflators, margins, and multipliers for the new scheme.

USING A CUSTOM BUILT SCHEME

All of your Custom Industry Aggregation schemes you have built will be saved in IMPLAN. If you want to use one of your Custom Industry Aggregation schemes later, you can start the Project from the Preferences screen or the Project screen. Create a New Project and search for the name of your Custom Industry Aggregation scheme in the Aggregation Scheme drop-down box. 

Aggregation_-_From_Projects.jpg

In Projects using an Industry Aggregation scheme, there are no longer 546 Industries when you look Behind the i at the Region Overview. Instead, there are the three aggregated groups just created.

Aggregation_-_Behind_the_i.jpg

Similarly, the Results are also aggregated.

Aggregation_-_Custom_Results.jpg

Adding an Industry that Doesn’t Exist Yet

INTRODUCTION:

Sometimes the Industry that we want to examine does not exist in our study Region. The Industry might be new to the area.  It also might be a new Industry altogether. It also might be an Industry that only recently became legal. This article outlines the best way to model these new Industries in IMPLAN. 


DETAILS:

The economy is always changing and Industries come and go.  Federal data follows these changes by adjusting the North American Industry Classification System (NAICS) codes.  IMPLAN follows suit, so when the NAICS codes change, so do IMPLAN Sectors.

There are two ways to create a new Industry depending on what you want to accomplish.  Both methods are outlined in this article.  


INDUSTRY THAT EXISTS IN THE US:

If you have a Region that will be gaining an Industry that does exist somewhere in the US, you can follow the steps outlined in the article Adding an Industry by Customizing a Region.


BRAND NEW INDUSTRY:

Federal data lags in categorizing these new Industries, which can pose a problem for researchers.  When the newest widget is invented, it is usually categorized with a similar product or under one of the catch-all codes like “all other…”  One interesting case is that of the legalization of marijuana or cannabis production and sales. The 2017 NAICS do have information on where the pieces of the supply chain fall for marijuana:

  • Marijuana, grown under cover – Industry 6 – Greenhouse, nursery, and floriculture production
  • Marijuana, grown in an open field – Industry 10 – All other crop farming
  • Marijuana merchant wholesalers – Industry 400 – Wholesale – Other nondurable goods merchant wholesalers
  • Marijuana stores, medical or recreational – Industry 412 – Retail – Miscellaneous store retailers

Let’s say we want to examine the effect of a $100M in cannabis agricultural production in Ohio and we know that a full $5M of that will be spent on legal fees. We also know there will be 25 employees each making $50,000.

First we have to decide what Industry we want to use.  In this case knowing the climate in Ohio, we make the assumption that the agriculture will be most closely related to IMPLAN Industry 6 – Greenhouse, nursery, and floriculture production. 

Create an Industry Spending Pattern Event for $100M in Industry 6.  If we know more details about the spending of cannabis growers as compared to other greenhouse products, we can edit the spending pattern to further reflect this new Industry.  Remember in this example we know that $5M will be spent on legal fees specifically. To model this, we click the Advanced button to open the details of the Industry Spending Pattern and scroll down to Commodity 3455 – Legal Services.  Next, we override the value with 5%; the dark blue color shows the edited Commodity. If any further information is known including Industries that could be deleted entirely from the Spending Pattern, that can be done at this point as well. More details on this can be found in the articles Editing Industry Spending Pattern Events or Editing Institutional Spending Pattern Events.  

You’ll notice that the Sum of Percentages at the bottom is now 104.94%.  


Adding_an_Industry_-_Sum_of_Percentages_2018.jpg


To fix this and return to 100%, click on the Advanced button and choose Normalize.


New_Industry_-_Normalize.jpg


Now, a full 5% will be spent on legal fees.  Make sure to choose Total Output (instead of Intermediate Expenditures). Remember: Output = Intermediate Expenditures + Value Added.


Adding_an_Industry_-_Sum_of_Percentages_100_2018.jpg


Next, we create a second Event for our Labor Income (25 employees x $50,000 = $1,125,000).  We can then add them to our Group and Run our economic impact.


Adding_an_Industry_-_2_Events.jpg


Notice that there are no Direct Effects in our Results so we will need to add those back in manually.  We know our total Output is $100M and our Labor Income is $1,125,000 with 25 employees. Now we need to navigate back to our Regions screen and click 

Study Area Data > 
     Industry Summary

Here we can find IMPLAN’s known totals for Sector 6 – Greenhouse, nursery, and floriculture production. Calculating the ratio of the overall Value Added to the overall Output shows that VA is, on average for this Industry, 37% of the total Output.  Therefore, we multiply $100M in Output by 37% to yield a Direct Value Added for this project of $36,727,998.33. The template for these calculations is here.


Adding_an_Industry_-_Excel_Calcs.jpg


Taxes: Industrial Breaks

INTRODUCTION:
Examining tax breaks, tax credits, tax exemptions, and tax incentives for firms and Industries is common in IMPLAN. This article outlines the basics on how you can use IMPLAN to examine the changes in your regional economy when tax policy affects Industries.

TAX BREAKS:
Tax breaks for certain Industries are common across the U.S. Municipalities offer huge tax incentives for site selection decisions or to encourage growth in basic Industries. Most times, these are in the form of foregone taxes; reducing the amount of future payments that would be required.

Even if the Direct taxes aren’t collected because of the incentive, there are still Indirect and Induced taxes generated because of the new activity. Showing the ripple effect of the government investment helps bolster support from taxpayers and justify the spending (or lack of tax collection). The return on investment (ROI) can be estimated using IMPLAN.

Let’s say for example, the state of North Carolina is going to give a complete Tax Exemption for 5 years to a new banking enterprise of the McDuck family. Their business plan estimates sales of $20M each year. We can run an Industry Output Event for $20M in Industry 441 – Monetary authorities and depository credit intermediation. Taking a look at the Tax Impact Results for the state, we see that Direct Taxes are reported. Now we know that they won’t be paying any Direct Taxes, so we can set our Filter to only show us Indirect and Induced Tax Results.

Tax_Breaks_-_Filtering_Indirect_and_Induced.jpg

Scanning down the screen, we see that because of the state investment which allowed for the resulting business to open in the state, North Carolina will see an additional $316,038 in Indirect and Induced Taxes in 2020. The state would not see the $325,106 of Direct Taxes in the first five years, but in year six, they would start seeing those revenues as well. If the argument can be made that but for the exemption, the McDuck family would have chosen another state for their bank, then it seems like it would have a positive effect on the state coffers; not to mention all of the sub-state level governments that will be collecting taxes.

Sometimes, however, businesses are given direct payments from the government to increase production, hiring, etc. These can be modeled through standard Industry Events in IMPLAN as new Output to the Industry.

Keep in mind that the distribution of the TOPI is based on the average of all Industries for you Region. If there is nothing unique about the tax structure of the business you are studying, then the resulting estimates are appropriate. However, if you are modeling a change in an Industry that will pay a higher share of a certain type of tax, it is best to edit your Direct Results to show that higher rate; IMPLAN will only show an average across all Industries. So if you are modeling Andrew’s Bootleg, a new distillery, and you know they will pay an additional sin tax or excise tax based on your local laws, it is best to use your estimate of the Direct Tax, and then use the Indirect and Induced tax results from IMPLAN.

TAX CHANGES:
Tax changes that affect an Industry vary widely; perhaps a new tax on production or inventory, new licensing requirements, etc. Analyzing these tax changes in IMPLAN depends on what the market reaction of the businesses will be. Will the business close, layoff employees, cut production, or see smaller profits? This determination is up to the analyst. Generally with a corporate tax increase, the first thing you will see is a reduction in corporate profit (OPI). In Input-Output models, corporate profit is treated as leakage as there is no way to know exactly how and where those profits are used as they could be reinvested in production, used for capital purchases, pay for additional hiring, distributed to shareholders, etc.

If the tax burden is so great as to force some businesses to reduce production, relocate, or close, this is an impact that could be modeled in IMPLAN. A simple Industry Output Event in the affected Industry could show the losses to the economy because of the new tax forcing out a local business.

OPPORTUNITY COSTS:
Another way IMPLAN can be used in examining tax issues is by looking at the Opportunity Costs – the benefit that is gained when one choice is made over another. Perhaps incentivizing the banking Industry would yield a smaller tax impact than the same dollar amount invested in automobile manufacturing. Not only can comparing these two potential scenarios show you the differences in how each affects the Regional economy of study but it will also show the differences in potential tax revenue.

EDITING TAX RESULTS:
You may have more specific knowledge about specific Direct Taxes that you want to adjust with the IMPLAN Results. Here’s how to do it.

Let’s say we have a plastics manufacturing firm that has chosen to remain in New Jersey due to the state’s offer to exempt them from Property Tax. We can run an Industry Output Event for their $5B in sales in 2020 in Industry 193 – Other plastics product manufacturing. On the Tax Results screen, Filter for the Direct Tax as the tax exemption is only being offered to the Direct business, and therefore Direct Tax is the only piece that will not be fully paid. Click on the ellipses to download the State Tax Impacts. Then click the download button and open up your Excel file.

Tax_Breaks_-_State_Tax_in_IMPLAN.jpg

Zooming in on the Property Tax, we see that there was a payment from Tax on Production and Imports (column) to TOPI: Property Tax (row) in the amount of $6,379.05. This would be the amount the state of NJ is giving up in Property Taxes.

When this data is in Excel, you can delete the $6,379.05 TOPI: Property Tax value from cell E7. You will need to recalculate the sum for Column E to show the new total as well as the sum of the Property Tax row in Column P and the sum of Column P itself to reflect the change. The new total for all of the Direct Taxes in NJ is $55,507,169. You can replace the original Direct Tax Figure with this new, lowered amount that will be collected by the State of New Jersey.

Tax_Breaks_-_Zero_Prop_Tax_in_Excel.jpg

You can Filter for the Indirect and then the Induced Taxes to see the amounts paid at the state level in order to calculate the total state taxes.

Tax_Breaks_-_New_State_Total_Tax_in_Excel.jpg

This process can be used to zero out or change any of the Direct Taxes on the IMPLAN results. For instance, you may know exactly how much a certain business will pay in a certain tax. Or perhaps you’d like to use your Industry-specific tax knowledge to shift around the distributions of TOPI or OPI in your Direct Tax results to compensate for the limitation in IMPLAN’s data on industry-specific tax distributions as mentioned in the Taxes: The Basics of the Breaks article. Use your bona fide knowledge of your subject to override the estimated Direct tax results in IMPLAN.

Taxes: Individual Breaks

INTRODUCTION:
If you haven’t already, check out the introductory article Taxes: The Basics of the Breaks to give you some general knowledge on tax breaks. Now let’s dive into some common tax breaks that individuals and households see and how to examine these in IMPLAN.

LABOR INCOME VS HOUSEHOLD INCOME:
There are two choices to model changes going straight to taxpayers in IMPLAN: Labor Income and Household Income. Let’s first look at the difference between Labor Income Household Income as illustrated below.

Tax_Breaks_-_LI___HI.jpg

Labor Income Events include all new labor payments including payroll tax, personal tax, and savings, as well as any labor payments to in-commuters who are local workers to the Region, but are not residents.

Household Income differs from Labor Income as it does not include the payroll tax paid on Labor Income nor does it include payment to workers that don’t live in the Region. Household Income does include personal taxes and savings. For Household Income Events, IMPLAN will not remove payroll taxes, social insurance taxes, or commuter spending, but will still remove personal taxes and savings.

When a Labor Income or Household Income Event is used, IMPLAN will calculate the leakages of income and the portion of income that is Household Spending based on the SAM. For further information check out the article on the Summary Description of Elements of the SAM.

ASSISTANCE PROGRAMS:
There are many government programs aimed at helping people from housing vouchers to encouraging the use of energy efficient appliances. As the analyst, you will have to decide which income categories will receive the benefit when using a Household Income Event and model them accordingly. For example, child care assistance is likely alloted to lower income earning categories.

For some tax breaks income level is not relevant; for example a tax refund for all taxpayers across the board. These kinds of tax rebates are not taxable, so they should be modeled through a Household Income Event. One caution when modeling these, however, is that while some of those receiving the benefit will likely spend all of it, some may put the refund into savings (and therefore should be omitted from the model). You can find the average savings rate by looking Behind the i in

Social Accounts >

IxC Social Accounting Matrix >

Detail IxC SAM

Then scroll to line 180 – Capital – Borrowing or Saving. You can divide the amount shown for each Household Income group by the total for that Household Income groups column to get an effective savings rate for each group. Note you will usually only see savings at higher earning levels.

To model the impact of a change in a specific program like Supplemental Nutrition Assistance Program (SNAP) benefits, there are two routes. The first option is to run increased spending through the main affected Industry; in this case 406 – Retail – Food and beverage stores. This assumes that this money will only stimulate the economy in terms of food purchases. However, you could also assume that the assistance allows families to have more money across various spending categories now that their food costs are being covered. In this case use a Household Income Event and analyze increases to only the income levels that will receive the benefit. Note that this method will still include spending on food.

CAPITAL INVESTMENTS:
Many municipalities offer tax breaks for the purchase of items like solar panels or energy efficient appliances. The reduction in the price of the item can be modeled with appropriate assumptions noted. The lowered price for the capital purchase could mean an increase in disposable income which can be modeled through a Household Income Event. However, the lowered price could just mean more money is moved into savings and has no impact.

You can also consider an increase in demand for capital items if they are manufactured in your study area. Perhaps the lowered price will incentivize more individuals to use the program and therefore purchase the required equipment. If this equipment is produced in your Region, you could model the increased sales of the manufacturing facility.

PROPERTY TAXES:
Property Taxes paid by Households are not displayed as a payment from Households; but rather from the TOPI column because Households pay Property Taxes on their home through Industry 449 – Owner-occupied dwellings. You can find the Property Taxes paid in your Region by looking Behind the i in

Social Accounts >

IxC Social Accounting Matrix >

Detail IxC SAM

Column 8001 – Taxes on Production & Imports makes a payment to line 159 – State/Local Govt Other Services – TOPI: Property Tax. The Property Taxes shown as being paid by Households are for other big-ticket items such as boats and cars.

As with modeling any type of tax break that affects individuals, you will have to make assumptions. For example, what would an increase in Property Taxes look like in your Region? Would that mean less disposable income (negative Household Income Event) or less in savings? Might some people even leave the Region in the face of an egregious rate hike?

SALES TAX:
Examining changes in Sales Tax rates depends again on what assumptions are being made about changes to spending within the Region. For a Sales Tax increase, the most basic level would be a negative Household Income Event showing less disposable income that can be spent due to the higher Sales Tax rate. However, be careful. If the county next door has a significantly lower tax rate, some of the shoppers from your county will likely head into the county with lower Sales Tax for bigger shopping days. This could mean decreased sales across retail Industries in your county. It could potentially mean the loss of some retail establishments in your Region.

If you wanted to look at Sales Tax that would be generated because of new employees in the Region, you can model the new employment through the appropriate Industry and check out your Results. The total tax impacts reported are those generated from the Event you ran. Filtering for the Induced Impact on the Tax Results screen will show the TOPI: Sales Tax stemming the household spending of the new employees and those working in Industries supported by your initial change. You could then estimate a per employee Sales Tax figure for your impact by dividing the Induced Sales Tax by the Direct + Indirect employment.

Taxes: The Basics of the Breaks

INTRODUCTION:
Every analysis in IMPLAN will give you tax results. However, often times analysts wish to to examine the effect of a tax break or tax incentive on their regional economy. Modeling tax changes falls under the category of socio-political impacts; therefore, the spending associated with it needs to be determined by the analyst before it can be modeled in IMPLAN.

DEFINITIONS:
Different tax breaks are offered across varying levels of government. Generally speaking, a tax break or tax incentive is a reduction in how much tax is owed. There are a few different names for these benefits. Investopedia does a great job of outlining these for us.

TAX CREDIT
Tax Credits are a dollar-for-dollar reduction in tax liability. Therefore, they are more favorable than a tax deduction. Examples: Child Tax Credit, Child and Dependent Care Credit, Earned Income Tax Credit, Low-Income Housing Tax Credit

TAX DEDUCTION
Tax Deductions subtract allowed expenses from gross income to reduce taxable income. Examples: Charitable Donation Deduction, Property Tax Deduction, Union Fees

TAX EXEMPTION
Tax Exemptions represent the elimination of a certain type of tax. Examples: Homestead Exemption, Nonprofit Tax-Exempt Status, Personal Exemption

KEY CONSIDERATIONS:
There are a few things to remember before diving into analyzing a change in taxes. First, IMPLAN data estimates for all components of Value Added (including Taxes on Production and Imports, less subsidies (TOPI) and Other Property Income (OPI)) come from state and county level data sources which are at least at the 3-digit NAICS level of detail. However, the distributions of these Value Added impacts (by component) amongst the types of tax are not Industry-specific. This means that portion of Output IMPLAN estimates an Industry spends on TOPI and OPI will be specific to that Industry, but the distribution of TOPI and OPI would be the same whether it was computers, tourism, tobacco, or forest products, regardless of differing tax rates between those industries. Logically, forest products or mining would have a higher proportion of severance taxes compared to computers or tobacco, but that level of detail does not show up in IMPLAN. It is up to the analyst to make adjustments as necessary.

Second, the tax impact report values are based on the existing relationships of the data found in the IMPLAN database. Taxes in IMPLAN are based on the collected and reported taxes by various units of government in the Data Year you are using. For example, if the Data Year you are using didn’t have a subsidy in the Industry you are analyzing and you know that there is now a subsidy, you will need to account for this.

Lastly, TOPI includes all direct government subsidies. If the subsidy in a particular industry is greater than the total taxes paid, the direct TOPI will be negative. For further information on this, please read The Curious Case of the Negative Tax.

If you want to learn more about tax breaks for individuals and households, visit the article Taxes: Individual Breaks. To learn more about tax breaks for Industries visit the article Taxes: Industrial Breaks.

Taxes: Where’s the Tax?

INTRODUCTION:
As any CPA will tell you, understanding taxes is a big job. Taxes vary by locality, special district, and state. There are also differences by Industry as some businesses are required to pay taxes specific to their work. This article outlines the basics of how taxes work in IMPLAN and what is included in each type of tax.

If you want to know where a specific tax exists in the IMPLAN data, choose a keyword and then use control + F and search for its name. Under each type you may see an entry for both “alcohol” and “liquor” to aid in searching. Note that a few types of taxes show up more than one area. For example, business motor vehicle taxes are located in TOPI while personal motor vehicle taxes are located in Personal Income Tax.

MODELING TAX CHANGES:
Every analysis in IMPLAN will give you tax results, however, specifically modeling tax impacts falls under the heading of socio-political impacts. Therefore in order to model a tax impact or change, the analyst needs to determine what the change to the economy would look like because of the tax impact/change. For more information, visit the article Taxes: The Basics of the Breaks.

KEY CONSIDERATIONS:
Tax Impact results are based on the collected and reported taxes within the region for the given data year. The categories within the Tax Impact Report correspond to the categories in the SAM. So, when you go Behind the i, you can look them all up.

The Tax Impact Report information simply provides more detail to IMPLAN’s economic impact estimates. Remember, tax results cannot be added to any summary or detailed results as they are already included as a portion of Output.

The data you have may just be more specific to your Industry than the estimates in IMPLAN. If you have exact information on your Direct Taxes, these should be used to replace IMPLAN’s Direct tax estimate. Then use IMPLAN’s Indirect and Induced tax estimates.

Taxes are levied at different levels of government. In IMPLAN, we can see the results at the following levels; State + Local, Federal, County, Sub County General, Sub County Special Districts, and State. Sub County General includes city and township governments. Sub County Special includes fire and public school districts.

TAXES ON PRODUCTION & IMPORTS NET OF SUBSIDIES (TOPI):
Taxes on Production & Imports net of Subsidies (TOPI) is one of the four components of Value Added. Because TOPI is net of subsidies, it can be negative for a given Industry in a given year if that Industry received more subsidies from the government than it paid out in these taxes in that year. I-O models by default treat TOPI as a leakage, meaning that any TOPI generated as part of an analysis will not generate any additional effects.

Taxes are Industry and geographically specific. However, the breakout by tax category (e.g., sales tax, property tax, etc.) is not Industry specific, due to raw data limitations. Also, there is no way within IMPLAN to know the break out of the components of each subset of tax (ie Sales Tax) into additional detail; the raw data we use do not have this level of detail.

The tax impact report splits the TOPI tax impacts into subcategories based on the picture of each region’s economy. IMPLAN does not have industry-specific taxes paid (other than total TOPI, which is industry-specific) so the distribution will be an all industry average.

Even if the tax is treated as an excise tax, rather than a traditional sales tax in a certain state, it will still show up in IMPLAN as a sales tax. You’ll notice that there is no excise tax category for State/Local Government in the tax impact report. For example, if a resort tax is charged on a per-unit basis (i.e., $ per hotel room) then it is technically an excise tax; however, in our data source, state and local excise taxes are lumped in with sales tax and will therefore show up as sales tax in the IMPLAN tax report.

TOPI does not include all taxes paid by an industry. For example, social insurance taxes are a part of Employee Compensation and profits taxes are part of OPI.

Property Taxes paid by Households on their primary residences are not displayed as a payment from Households but rather from the TOPI column. This is because Households pay these Property Taxes through Sector 449 – Owner-occupied dwellings. The property taxes shown as being paid by Households are for other big-ticket items such as boats and cars. Direct property taxes on construction impacts are not property taxes on the built structure itself – just on the construction companies’ properties. To get the building’s property taxes you have to run the operations phase.

TAXES INCLUDED IN TOPI
Type of Tax

Specific Taxes Included

Where Levied

Sales Tax

Alcohol, amusement, bed, cigarettes, consumption, cosmetic medical procedures, fuel, gallonage, gasoline, general sales, gross receipts, hotel, insurance premium, internet, local general, lodging, liquor, luxury, meals, occupancy, other selective, parimutuels, plastic surgery, public utilities, recycling, state general, sewer, ticket, tobacco, transfer, occupancy, resort, sin, turnover, use, utilities, waste management, value added (VAT), vanity tax, water

State, County, Sub County General, Sub County Special

Property Tax

Boats, business personal property, intangible property, machinery and equipment, property, real estate, school

State, County, Sub County General, Sub County Special

Motor Vehicle License

License fees – business, license plates, operators license – business, registration fees – business, vehicle license – business

State, County, Sub County General, Sub County Special

Severance Tax

Carbon dioxide, crude oil, natural gas, methane, severance, timber, uranium

State, County, Sub County General

Other Taxes

Alcoholic beverage license, amusements license, business license, business registration renewal, concession license, corporation license, documentary fee, documentary and stock transfer, fishing license, franchise tax, food and beverage license fees, hunting license, gun license, mortgage recording, Nonemployee Compensation (NEC), occupation and business license, other license, permit, public utility license, tourism license, stamp tax

State, Sub County General, Sub County Special

Special Assessments

Fee, fine, special assessment, toll

State, Sub County General, Sub County Special

Excise Tax

Air transportation, alcohol, biodiesel, cable, “Cadillac” tax (high-cost employer-sponsored health insurance), charitable hospitals for failure to meet the community health needs, cigarettes, cell phone, coal, crude oil windfall profit, development impact, diesel, fuel, environmental, gas-guzzler, gasoline, hazardous materials, health insurance, indoor tanning, inspection fee, insurance receipts, jewelry, liquor, medical devices, nuclear fuel, ozone-depleting chemicals, pharmaceutical, public utilities (electric, gas, phone), refunds (other than for alcohol and tobacco), satellite, tires, storage fee, soda, telephone, tobacco, trucks, windfall profit, wireless

Federal

Custom Duty

Custom duties, export tax, import tax, tariff

Federal

OTHER PROPERTY INCOME (OPI):
Other Property Income (OPI) represents gross operating surplus minus Proprietor Income. OPI includes consumption of fixed capital (CFC), corporate profits, and net business current transfer payments. It includes income derived from dividends, royalties, corporate profits, and interest income. Thus, OPI provides a source of income for households, businesses, and governments. The other key component of OPI is corporate profits tax.

Just like TOPI, I-O models by default treat OPI as a leakage, meaning that any OPI generated as part of an analysis will not generate any additional effects. This is because there is no assumption built into the model as to how, when, and where OPI will be spent.

TAXES INCLUDED IN OPI
Type of Tax

Specific Taxes Included

Where Levied

Corporate Profits

Corporate profits tax, corporate income tax, private enterprise tax, profits tax

Federal, State,
County, Sub
County General

SOCIAL INSURANCE TAXES:
Social Insurance taxes (commonly referred to as payroll taxes) are paid under Employee Compensation. Remember this is always a fully-loaded number so it should include all wages and benefits. They include both employee-paid and employer-paid portions and show up in the SAM and tax impact report as payments from the Employee Compensation column. All payroll taxes are paid at the place of employment; this is in contrast to personal taxes, which are discussed in the next section

TAXES INCLUDED IN SOCIAL INSURANCE
Type of Tax

Specific Taxes Included

Where Levied

Employee Contribution

Disability, Children’s Health Insurance Program (CHIP), estimated payments, Federal Insurance Contributions Act (FICA), IRA rollover, Medicare, Medicaid, non-qualified health savings account distributions, Old Age Survivors and Disability Insurance (OASDI), pay-as-you earn (PAYE), pay-as-you-go (PAYG), penalty for underpayment of estimated tax, retirement early withdrawal penalty, surtax, Social Security, survivors, State Government Retirement

Federal, State, County

Employer Contribution

Disability, hospital, Children’s Health Insurance Program (CHIP), Federal Insurance Contributions Act (FICA), Federal Unemployment Tax Act (FUTA), Medicaid, Medicare, Military medical, Old Age, Survivors and Disability Insurance (OASDI), payroll, pension, Social Security, State Government Retirement, Federal Insurance Contributions Act (FICA), State Unemployment Tax Act (SUTA), survivors, retirement, Unemployment, Workers’ Compensation

Federal, State, County

PERSONAL INCOME TAX:
Employees pay payroll tax on their Labor Income (EC + PI) and then pay personal income tax on their Household Income, which may include more than just employment-based income. Personal income taxes are also paid on other types of income (e.g., rental income, dividend income, interest income, capital gains, retirement income). The effective personal income tax rate in IMPLAN is basically a weighted average of the individual rates of all these types, depending on the amount of each paid in a given region in a given year.

In IMPLAN, all personal income tax is assumed to be paid at the place of residence; however, in the real world, the personal tax paid on wage income (which is part of what is withheld from an employee’s paycheck) is paid to the place of employment. This is true of state and local personal taxes on wage and salary income, which are levied based on where people work. 

TAXES INCLUDED IN PERSONAL INCOME TAX
Type of Tax

Specific Taxes Included

Where Levied

Motor Vehicle License

Cars – personal, motor vehicle – personal

State, County, Sub County General, Sub County Special

Other tax

Dog license, fishing license, hunting license, other personal license, pet license

State

Income Tax

Alternative Minimum, capital gain, dividend, income, individual income, interest income, Kiddie Tax (Tax on a Child’s Investment and Other Unearned Income), personal income, rental income, wage income, withholding

Federal, State, County, Sub County General, Sub County Special

Estate and Gift Tax

Death, estate, gift, inheritance

Federal

Airports: Preparing for Takeoff

DETAILS:
Economic impact analyses of airports are very popular. Venckus and Vaidas (2011) state the main reasons as to prevent an airport closing or relocation, to highlight the ramifications of service additions or cancellations, and to justify spatial expansion. [1]

OPERATIONS
There are two main IMPLAN Industries associated with airports. The first is Industry 414 – Air transportation. This Industry includes both passenger and cargo flights; even space travel. This Industry is the operations of the airlines and would be used for both current services and potential new services (like a new route being added). The second is Industry 420 – Scenic and sightseeing transportation and support activities for transportation. This Industry includes air traffic control, hangar rental, parking, and a few other associated services. Also keep in mind that not all employees working at the airport are employed by the airport. Transportation Security Administration employees are actually paid under the Federal Department of Homeland Security and would fall under Industry 546 – Employment and payroll of federal govt, non-military.

However, nothing is every that cut and dry, right? Along with the operations of the facility and the air transportation itself, there are often many other businesses affiliated with or connected to airports. There are usually retail tenants on-site, and sometimes rental car companies, hotels, flight schools, and military installments. None of these activities would be captured in Industries 414 or 420 so their operations would need to be modeled in addition to the operations of the airport.

The airport you want to examine might even have a large business associated with it like the 1.2M square foot Boeing aircraft assembly plant in Charleston, SC. [2] Again, this would have to be modeled separately from the airport operations.

CONSTRUCTION
As always, capital improvements need to be analyzed separately from operations. While construction projects may span multiple years, their impact is temporary, unlike ongoing airport operations that happen every year. New construction at airports falls under Industry 56 – Construction of other new nonresidential structures; ongoing upkeep falls under Industry 60 -Maintenance and repair construction of nonresidential structures.

VISITORS
It is a hard case to make that spending of visitors that flew into your region can be counted as part of the economic impact of the airport itself. If all visitor spending is included in an analysis, the assumption is that none of their spending would have occurred in the region but for the existence of the airport. If it weren’t for the airport, visitors would either travel via a different airport in the area, via a different means of transportation or not come at all. For individuals that would visit the region regardless of the airports existence, their spending impact on the region cannot be attributed to the airport. At the very least, a discount rate should be applied to the total visitor spending for air travelers into your region.

When analyzing a tourist event, you may want to include the cost that visitors had for their travel. IMPLAN recommends splitting airfare 50/50 between the origin city and destination city. Basically, half of the price of the ticket would be applied to your region of study. Note that dollars going to travel agents and corporate headquarters are included in the production function for Industry 414 so there is no need to model them separately.

Now, please put your tray table up, ensure your seat is in the upright and locked position, and fasten your seatbelt.

RELATED ARTICLES:
Tourism Spending

OTHER RESOURCES:
Federal Aviation Administration Data

South Carolina Aeronautics Commission Economic Impact Technical Report

SOURCES:
[1] Venckus, A., & Vaidas, G. (2011). A Few Remarks on Assessment of Airport’s Economic Impact. Economics & Management, 16, 437-440.

[2] South Carolina Aeronautics Commission. (2017). Economic Impact Technical Report. Retrieved January 2, 2020. Available: http://www.scaeronautics.com/download/2018_Economic_Impact_Technical_FinalReport.pdf.

Framing: When is the Impact Happening?

INTRODUCTION:
Dealing with years in IMPLAN can get tricky. Luckily, we have an article called Dollar Year & Data Year to help with your understanding as one of the first things you do have to answer the question of when your impact is happening – the Dollar Year of your impact.

DETAILS:
The Dollar Year on your impacts screen should be the year represented by the values in your Event. This is usually (but not always) the same as the year in which your Event occurred or is expected to occur. So, if you are modeling construction that will happen in 2021, the Dollar Year should be 2021.

Framing_When_-_Dollar_Year.jpg

Construction projects may take multiple years, so ensure that you spread your spending across years as appropriate. To model this, just create another Group and change the year to be the next one you need.

Framing_When_-_Dollar_Year_x2.jpg

You can model Events that happened in the past by changing your Dollar Year as well. The thing to remember is that the time when the money you are modeling hits the economy should be your Dollar Year.

Framing: Where is the Impact Occurring?

INTRODUCTION:
Where your impact is taking place is a pretty easy question to answer. However, you may want to talk about that impact at the local, regional, or state level as well. You may even want to look at how an Event in one Region impacts another Region.

DETAILS:
The Region you define determines the boundary for which estimated spending is captured as an effect to the Region. The spending that does not affect the Region you’ve defined (according to the model) are called leakages.

GEOGRAPHY LEVELS IN IMPLAN:
Regions can be accessed by clicking Regions via the IMPLAN Dashboard at app.implan.com. Once a Region has been built, it can also be selected via the Region field of a Group in the Impact Screen. Data about a Region can be accessed “behind the i” in the Regions screen once a Region is selected and built.

From the Regions screen, you can select a Region by typing the name of one of the following US geography levels in the Search field:

ZIP Codes
Congressional Districts
Counties
States
Country (United States)
You can also select States and Counties by clicking on them on the map. Toggle the map between State View and County View by using the map view dropdown at the bottom right-hand corner of the map shown below.

Framing_Where_-_Map_View.jpg

SINGLE & COMBINED REGIONS
You may want to look at a change in your county and how that affects your county. Pretty straightforward. In IMPLAN you can also combine smaller geographies to create a custom region. To do this, navigate to your Regions screen and click on or type in the names of all of the geographies you want to combine into one new combined region.

Framing_Where_-_Map_Combo.jpg

Next, click on the Advanced Options in the upper right corner of your screen just above your first listed Region.

Framing_Where_-_Map_Arrow.jpg

A new box will pop up prompting you to give your combined region a name. If you want to use this same combination in the future, give it a logical name that you will remember as IMPLAN will save all of your combined regions for you.

Framing_Where_-_Name_Combo.jpg

Click SAVE and IMPLAN will start building your new combined Region for you. When the teal icon shown below appears, your new Region has been built and you are ready to input your Events.

Framing_Where_-_Combo_Created.jpg

Be aware of aggregation bias – which stems from the loss of detail that occurs when you combine regions together to form a blended larger region.

FUNCTIONAL ECONOMIES
In addition to defining your analysis Region based on where the impact is taking place and where you want to measure the effect, it’s also important to consider the functional economy. A functional economy encompasses the major labor and production shed of the impact or contribution being modeled. This means that the region captures the local supply chain and areas in which employees are living and spending their income.

A functional economy has established economic networks and can support demand for labor as well as goods and services needed by both households and businesses. How long spending will circulate within an economy depends on the functionality of the economy. This is because there will be less leakage of spending in a more functional economy, relatively. Leakages of spending into other Regions occurs primarily due to imports of goods and services into your Region as well as non-resident employees (in-commuters) working in your Region. IMPLAN estimates these leakages for you based on your defined Region. You can adjust your commuting rate if you know specific information that you would like to model.

COMPARING & CONTRASTING
IMPLAN does have the ability to show you how the Event might look different if it were in Indiana or in Illinois. You can create one Event on your Impacts screen and drop it into both counties. Then on the Results screen, use your Filter to flip between the two geographies to see the differences.

Framing_Where_-_Same_Event_in_2_States.jpg

RESULTS ACROSS GEOGRAPHIES
You may want to look at how your event in Mecklenburg County, NC, but also how it will affect nearby Gaston County. This can be done using a feature in IMPLAN called Multi-Regional Input-Output Analysis (MRIO) which links Regions together. Remember, different stakeholders may be interested in the results at different geographies. MRIO will estimate the interregional linkages of trade and commuting effects across these different geographies.

Framing_Where_-_MRIO_Button.jpg