Framing: What is the Value of the Change?

INTRODUCTION:
Selecting the value of the change you want to model is fairly straightforward. It is simply the total dollars or employment you want to model; which will be entered as the Event Value in IMPLAN. Your analysis may have only one value or may be made up of a combination of many values. The what of your analysis will inform the definition of your Event Value(s).

Event Type

Event Specification

Event Value

Industry [Impact] Events

Sector experiencing change in demand/production

1 or more:
Output
Employment
Employee Compensation
Proprietor Income

Industry Contribution Events

Sector for which the contribution is being measured

Output or % of Industry

Commodity Output Events

Commodity experiencing change in demand/production

Output

Labor Income Events

Employee Compensation

Employee Compensation

Proprietor Income

Proprietor Income

Household Income Events

Households LT15K
Households 15-30K
Households 30-40K
Households 40-50K
Households 50-70K
Households 70-100K
Households 100-150K
Households 150-200K
Households GT200K

Total Household Income for specified Income Group

Industry Spending Pattern

Sector making purchases of Intermediate Expenditures

Intermediate Expenditures or Output According to Selection in Advanced Menu

Institution Spending Pattern

Fed. Govt. NonDefense
Fed. Govt. Defense
Fed. Govt. Investment
State/Local Govt. NonEducation
State/Local Govt. Education
State/Local Govt. Investment
Capital
Inventory Additions/Deletions

Total Spending on Goods, Services and Labor

INDUSTRY EVENTS:
When one or more of the following values are known about the change in an industry’s production or expenditures: Output (production value), Employment, Employee Compensation (wages and benefits), or Proprietor Income, these values can all be modeled through the Industry Events. If you want to model an increase of $1 million in Output, the $1 million answers what the value of the change is.

Many times, you will have more than one value for your Event. Perhaps you were given both $500,000 in Employee Compensation for 6 employees. It is best to use all of the detailed data that you have in the model. By choosing an Industry Event, clicking on the Options button and selecting the Advanced Menu, you can input the additional details, in this case 6 employees.

Framing_What_-_Advanced_Menu.jpg

It is important that your what, or the change occurring, is specifically the change occurring in your Region of study (where).

For retail and wholesale sectors, The Margins section will become available for selecting Total Revenue or Marginal Revenue. Its very important to indicate to IMPLAN whether your retail/wholesale Output is the Total or Marginal Revenue of retailer or wholesaler. Read on about Total Revenue vs. Marginal Revenue.

INDUSTRY CONTRIBUTION EVENTS:
In the case of Industry Contribution Events, the what should be defined as the amount of Industry Output for which you’d like to estimate the contribution, or the portion of the Industry for which you’d like to estimate the contribution. An amount of Industry Output can be entered when the radio button on the Industry Contribution Event is set to the dollar sign. An Industry portion can be entered when the radio button is set to the percent sign. When the percent option is used, the entered portion will be taken from the existing production levels (Output, Employment, etc.) for the Industry specified within Region and Data Year which can be found in Region Details > Study Area Data > Industry Details. Be sure to enter portions as a decimal (for example, if you’d like to estimate the contribution of half of an industry enter .5).

Framing_What_-_Contribution.jpg

COMMODITY EVENTS:
Commodity Output Events are more appropriate than Industry Events when the producing Industry, place of production, and time of production are unknown. Commodity Events are also recommended when Margins are applicable and the item purchased is known.

There is only one Event Value that can be provided in a Commodity Event: Commodity Output. In the case of Commodity Events, the what should be defined as the change in demand for the given Commodity. IMPLAN applies the Commodity’s Market Shares to this Commodity Output number.

There is the additional option of defining the Local Purchase Percentage (LPP) of the Commodity in a Commodity Output Event by clicking on the Options button and selecting the Advanced Menu. You have three options for setting your LPP:

Leave LPP at 100% if you know the change in demand for the Commodity is met totally by local production of the Commodity
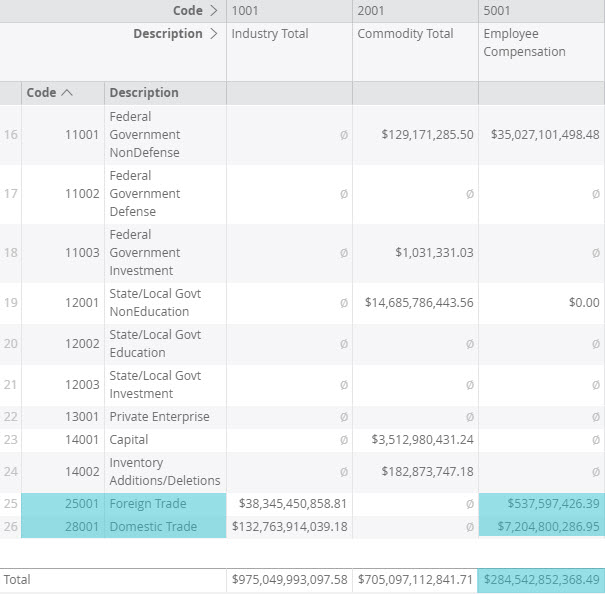
Set LPP to SAM by checking the SAM checkbox if you don’t know where the Commodity demand will be met. For example, you may be using a Commodity Output Event to estimate the impact of new demand for electricity by businesses and households in a developing Region. If the place of production of electricity is unknown, you can set LPP to SAM. This will use the average Regional Purchase Coefficient for electricity in the Region, which indicates the portion of demand for electricity that is met within the Region (in the Data Year being used).
Set LPP to your known LPP if you know what portion of the Commodity Output will be coming from the within Region.

Framing_What_-_Commodity.jpg

Margins are applicable to Commodities that are goods that can be purchased via a retailer or wholesaler. Similar considerations apply when choosing between Total Revenue and Marginal Revenue for a Commodity Event as when making this selection for a retail/wholesale Industry Event, but the implication of the choice is quite different. Read on about Total Revenue vs. Marginal Revenue.

LABOR INCOME EVENTS:
When Labor Income Events are used, there are only two specification options (as listed on the table at the beginning of this article) which are Employee Compensation or Proprietor Income. When using a Labor Income Event the Event Value (what) should be defined as the total value of the type of new income specified that you’d like to analyze.

HOUSEHOLD INCOME EVENTS:
When Household Income Events are used, there are nine household income groups to choose from when defining your specification. The Event Value or what in this case should be the total new household income within the household income group specified that you’d like to analyze.

INDUSTRY SPENDING PATTERN EVENTS:
When Industry Spending Patterns are used the Event Value or what could either be Total Output or Intermediate Expenditures. By default the Event Value will be assumed to be Intermediate Expenditures used you open the Advanced Menu by clicking into it via the Options button.

Framing_What_-_Ind_Spending_Pattern.jpg

Regardless of which is selected, IMPLAN will only estimate the effect of Intermediate Expenditures spent on the Commodities included in the Spending Pattern. If Total Output is selected, IMPLAN will first calculate Intermediate Expenditures by multiplying the Event Value by the Total Gross Absorption of the Sector for the Region, which can be found in Region Details > Social Accounts > Balance Sheets > Industry Balance Sheet > Commodity Demand, then filter by the Sector of interest and see the Gross Absorption column total.

INSTITUTIONAL SPENDING PATTERNS:
When Institutional Spending Patterns are used the Event Value or what should be defined as Total Spending on Goods, Services, AND Labor. Institutional Spending Patterns differ from Industry Spending Pattern in that they do include labor.

Framing: Who is Being Impacted?

INTRODUCTION:
The first question to think through when preparing your analysis is who is being impacted. The “who” of an analysis is the entity experiencing the initial change or economic activity you’d like to analyze. Keep in mind, IMPLAN is designed to estimate backward linkages, preparing your analysis determines the starting point.

Answering the “who” question will inform the definition of your Event Type and Specification in IMPLAN.

INDUSTRY & COMMODITY EVENTS:
When an Industry is experiencing the initial economic activity being analyzed, the question of who is answered by choosing one or more Industry Sectors. There are four different Event Types for analyzing a change in production in a given Industry: Industry Output, Industry Employment, Industry Employee Compensation, and Industry Proprietor Income. If you only have one Industry Event Value, simply select 1 of the 4 Industry Event Types based on the value you have.

Your analysis can include more than one of these Event Values. For example, you might want to look at a change in crop production and associated manufacturing.

When you have more than one Event Value, we recommend choosing your Event Type based on the chart below. Your Industry Event Values will be processing based on this prioritization of Event Values regardless of the Type you select:

Industry [Impact] Event Type

When to Use

Industry Output Events

When Output is known

Industry Employment Events

When only Employment is known

Industry Employee Compensation

When Employee Compensation is known, but Output is unknown

Industry Proprietor Income

When Proprietor Income is known, but Output and Employee Compensation are unknown

Once you’ve picked your Event Type, you’ll be able to pick the Industry that best represents the “who” of your analysis. For example, if you want to look at an increase in production for a local car assembly plant, you would choose Sector 340 – Automobile manufacturing.

To analyze the contribution of existing production or spending an Industry Contribution Event may be appropriate. Who is still answered by choosing one or more Industry Sectors.

To analyze the change in production or spending on a Commodity, who is answered in the Commodity Output Event with the appropriate Commodity. If you want to look at an increase in the production of cars in your region, choose Commodity 3340 – Automobiles. This is because although the cars will primarily be produced by Industry 340, adjacent Industries may also produce some cars in addition to their primary products.

LABOR & HOUSEHOLD INCOME EVENTS:
Maybe the who you want to affect is actually individuals. If these individuals are producing something and you know the Industry and associated Employment, Employee Compensation, or Proprietor Income, this should be modeled through an Industry Event. However, sometimes we don’t know what Industry is being affected or there isn’t an Industry being directly affected at all. A few examples of when an industry may not be directly affected by a change in spending by individuals include minimum wage increases, personal tax changes, or an increase in population of individuals who do not work in the Region (perhaps retirees or commuters).

Using a Labor Income Event allows you to choose either Employee Compensation or Proprietor Income to model changes in spending, without specifying a particular Industry.

A Household Income Event allows you to choose what income group would see a change in spending. Again, this is not associated with a specific Industry. This is helpful when you want to model an Event like a subsidy to a particular group of earners, for example households that make less than $15,000 per year.

Note that Labor Income and Household Income Events do not include Direct Effects as these Event Types are only modeling the spending of households without an associated Industry or Commodity.

INDUSTRY SPENDING PATTERNS EVENTS:
Spending Patterns measure the business to business backward linkages or supply chain effects of the Industry. Industry Spending Pattern Events are best used when modifications to an Industry’s Production Function are necessary that cannot be made with a standard Industry Event. When detailed information is known about the specific Industry’s spending, a Spending Pattern Event can be adjusted to reflect the specific purchases or ratios of purchases. Industry Spending Patterns include all Intermediate Expenditures for a given Industry. Note that Industry Spending Pattern Events also do not include Direct Effects.

INSTITUTIONAL SPENDING PATTERNS EVENTS:
Institutional Spending Pattern Events are most appropriate when an analyst would like to model the effect of a fiscal spending change. This is only at a high level as the specification options for Institutional Spending Pattern are general government entities rather than specific government programs. Other Event Types are more appropriate when the analyst knows more specifically how the government may be changing their spending. Unlike Industry Spending Patterns, Institutional Spending Patterns include payroll expenditures for employees. Institutional Spending Pattern Events do yield a Direct Effect.

EVENT TYPES & WHEN TO USE THEM:
So here’s the basics of each Event Type and when to use them:

Event Type

When to Use

Industry [Impact] Events

Modeling change in an industry’s production/spending on the industry

Industry Contribution Events

Estimating effect of an existing industry’s production

Commodity Output Events

Modeling change in a commodity’s production or spending on the commodity

Labor Income Events

Modeling change in labor payments isolated from an industry’s production

Household Income Events

Modeling a change in household income isolated from an industry’s production

Industry Spending Pattern

Customizing an industry’s purchases or the amount an industry spends on inputs is necessary.

Institution Spending Pattern

Modeling general fiscal spending changes

Picking an Industry

INTRODUCTION:
IMPLAN has 546 different Industries to choose from when running your economic impact. But how do you choose which one is right for your study? Here is the guide to everything you need to know about IMPLAN Industries!

IMPLAN INDUSTRIES:
IMPLAN Industries consist of 546 different codes and names. IMPLAN Industries can be grouped into the following categories:

1-19 are Agriculture
20-38 are Mining, Minerals, and Oil
39-49 are Utilities
50-62 are Construction
63-391 are Manufacturing
392-413 are Wholesale and Retail
414-421 Transport Related
422-525 Services
526-534 Government Enterprises
535-538 are Commodity-Only Sectors
539-546 captures payroll and employment for different types of government
Industries 1-534 are all private industries and government enterprises that have been aggregated by similarity in input purchasing patterns. While they are all comparable, each IMPLAN Industry has its own production function and spending patterns. Picking the right Industry is important. Running $1M through Industry 195 – Rubber and plastics hoses and belting manufacturing will yield different results than running that same $1M through Industry 196 – Other rubber product manufacturing.

BUT HOW DO I CHOOSE ONE?
If you are looking at oranges in Florida, Industry 4 – Fruit Farming is going to be the one. Often times, it is just that easy; use the list of 546 Industries and pick which one fits your analysis.

Sometimes selecting which IMPLAN Industry to use is a little trickier. What if you want to know what IMPLAN Industry to assign for a company that makes cash registers? A quick scan through the list of 546 Industries won’t help much. So IMPLAN Economists put together a bridge from NAICS Codes to IMPLAN Industries to help. Using this document, you can search the detailed NAICS Codes by keywords like “cash register.” Doing this leads you to NAICS 333318 – Other Commercial and Service Industry Machinery Manufacturing which corresponds to IMPLAN Industry 272 – Other commercial service industry machinery manufacturing. Using this method, you can also see what other things fall under this Industry. Industry 272 also includes vending machines and voting machines, for example.

Alternatively, you can search the NAICS website to find which 6-digit NAICS Code best fits your needs. Then, you can use the NAICS Codes to IMPLAN bridge to find the corresponding IMPLAN Industry.

NAICS CODES:
The industry classifications for all establishments covered by the economic census and surveys are based on the North American Industry Classification System (NAICS). NAICS Codes are a system by which all Industries are classified across Canada, Mexico, and the United States. They consist of Industries made up of firms with similar patterns. The IRS requires that businesses report their Principal Business Activity Code on their federal tax return. The IRS business activity codes are based on the NAICS and this is how the government has data based on these codes. NAICS is scheduled to be reviewed for potential revisions every 5 years so that the classification system can keep pace with the changing economy; the most recent revision was in 2017.

Industries in IMPLAN are all classified based on NAICS Codes, with two exceptions. Construction Industries are based on the Census Structure Type descriptions. Additionally, the Industries that start with an asterisk (IMPLAN Industries 535-546) are not based on NAICS because these Sectors do not make any purchases.

BEA INPUT-OUTPUT ACCOUNTS:
So if there are almost a thousand NAICS Codes, why are there only 546 IMPLAN Industries? Well, the answer lies with the Bureau of Economic Analysis’s Input-Output Accounts. The BEA’s benchmark Input-Output (I-O) accounts provide the most detailed information available on the structure of the U.S. economy and its industries. Benchmark I-O accounts are prepared at 5-year intervals and are based on detailed data from economic censuses conducted every 5 years by the Bureau of the Census; the most recent Industry and Commodity data is from 2012.

The BEA data contains details on 405 Industries. IMPLAN Economists augment this using input from industry experts. So you may notice a few places where the BEA data is less aggregated than the IMPLAN data.

Getting Started

INTRODUCTION:
Now that you have the information to run your first impact from this article, you are ready to jump into app.implan.com!

Before you can log in to IMPLAN, you must first have valid and active credentials. Valid IMPLAN credentials consist of two components: a username and a password, both of which are exclusive to each individual user. To acquire a username and password, you must first have an active IMPLAN data subscription. To purchase a data subscription, contact us directly at 800-507-9426 or sales@implan.com.

LOGGING IN:
The process begins at the login screen. This is where you will enter your email address and password. Then, click the LOG IN button. If you’ve logged in in the past, you can just click on your email address and you will be directed straight into IMPLAN.

Getting_Started_-_Login.jpg

To change your password, click on the text “Not your account?” and then click “Change or reset password.”

Getting_Started_-_Change_PW.jpg

Upon doing so, you’ll arrive at the Password Reset screen. Click into the empty field that says “yours@example.com” and enter your email address. Click SEND EMAIL. Upon doing so, you’ll return to the Login screen and a message that says “WE’VE JUST SENT YOU AN EMAIL TO RESET YOUR PASSWORD” will appear. Back in your email inbox, you’ll find a new email message from support@IMPLAN.com. Click on the link in the email and you will be prompted to create and confirm a new password. If you don’t see an email from us, check your spam folder.

Once you log in, you will be directed to the IMPLAN dashboard. Here you will find the REGIONS, IMPACTS, and PROJECTS buttons. Throughout the process, you can always click the IMPLAN logo in the upper left to return to this screen.

Getting_Started_-_Dashboard.jpg

SELECTING A REGION:
Next, we will look at the process of selecting a Region in IMPLAN. The procedure begins at the IMPLAN Dashboard and ends at the IMPACTS screen.

IMPLAN needs to know the specific regional economy in which your study’s real-life event will occur. So, every time you conduct an impact analysis with IMPLAN, you’ll need to tell it where your study’s event will take place by selecting a Region. Thankfully, IMPLAN makes this extremely easy to do by offering a large interactive map which lets you complete the process visually.

Start by clicking REGIONS from your home screen. This will take you to the map of the U.S.

Getting_Started_-_Regions.jpg

You can select your Region by either clicking on the appropriate place on the map or using the search bar in the upper left of the screen. In the search bar you can type in U.S. Total or the names of states, counties, MSAs, zip codes, or congressional districts. When you have selected a Region, it will become a darker shade of blue on the map and the Region name, Data Year and basic data will populate on the right side of the screen in the Selected Region section.

Next, click the CREATE IMPACT button.

Getting_Started_-_Regions_Create_Impact.jpg

This will create a popup that will prompt you to give your new project a name. Remember to make it easy to understand what you are modeling. Next, hit SAVE.

Getting_Started_-_Regions_Name_New_Project.jpg

After saving, you will be redirected to the IMPACTS screen.

CREATING AN EVENT:
Now we are on the IMPACTS screen and ready to input our data! An Event is arguably the most important element of any impact analysis performed with IMPLAN. When estimating the effects of an economic activity, IMPLAN relies on Events to communicate the unique quantitative characteristics of that activity.

IMPLAN can calculate impact results using as few as just one data point. However, the less you tell IMPLAN about a given event, the less it knows. And the less it knows, the more it has to assume. And the more it has to assume, the less reliable its results can ultimately be in providing insights. So, it’s always best to provide IMPLAN with as much information about your Event as you possibly can if you want the most valuable results possible in return.

To begin, click Add New Event.

Getting_Started_-_Impacts_Add_New.jpg

Upon doing so, a box of editable fields will appear.

Getting_Started_-_Impacts_Event_Line.jpg

In this box, you will first enter a title. Make it something memorable and explanatory so you can keep track of your different Events. After naming your new Event, click into the Type menu and select an Event Type from its dropdown list. You can choose from Industry, Commodity, Labor Income, Household Income, Contribution, Industry Spending Pattern, and Institutional Spending Pattern. The differences between the Event Types can be found here. The most basic and frequently used are the Industry Events (Output, Employment, Employee Compensation, and Proprietor Income).

After selecting a Type, click into the Specification menu and select from the dropdown list. The options available will vary depending on which Event Type you selected from the Type menu. Industry Events will give you a list of the 546 Industries from which you can choose. If you know the name of the Sector you want to use, you can start typing it directly into the Specification box.

After selecting a Specification, click into the Value field and enter your data point. If you choose an Industry Employment Event, for example, your Value would be the total employment you want to analyze. The options menu button on the right of the Value field can be accessed to allow for further customization, duplication or deletion of the Event.

To move your Event into your Group, click on the Event line until it turns blue. Then you can drag it (while holding the click) over to the right side of the screen into your Group. When your Group turns blue, drop the Event by releasing the click.

Getting_Started_-_Impacts_Drag.jpg

Notice when you add your Event to the Group on the right, the little circle in the upper right of the North Carolina Group box changes from a 0 to a 1. This indicates how many Events are in this Group. You can drag multiple Events into a single Group.

Getting_Started_-_Impacts_BBQ.jpg

You can also add new Groups from this screen by clicking on “Add New Group.” You will need to give your new Group a title and Select the Region for the blank drop-down menu. Because you can add any Region available to you from the Region field of a Group, this gives you the alternative path of starting your Project directly from the IMPACTS screen when you do not need to access additional features and data available in the REGIONS screen. The Dollar Year will default to the current calendar year and the Data Year will default to the most current year of data available in IMPLAN. You can use the options menu icon to Scale, Duplicate, or Remove Groups.

Getting_Started_-_Impacts_Add_New_Group.jpg

Now that you have your Event all set up in your Group, you are ready to hit RUN! IMPLAN will show how many iterations are Queued, In Progress, and Ready in the box in the lower right corner of your screen. When your analysis is finished, VIEW RESULTS will appear in the lower right. When you click VIEW RESULTS, you will automatically be taken to the RESULTS screen.

EXAMINING YOUR RESULTS:
Your RESULTS screen will default to the Impact Results Overview as shown. You will see the Economic Indicators by Impact, Tax Results, and Top 5 graphs. Scrolling down on the page you will see the Top 15 Industries by Estimated Growth Percentage and a table of Industries by Estimated Growth Percentage.

IMPLAN will default to showing you Results for every Region, Group and Event in the current calendar year Dollar Year. You can change what you see by clicking on FILTERS.

Getting_Started_-_Results_Summary.jpg

You can also dig deeper into the Output, Employment, Value Added, and Tax Results by clicking on the ribbon menu along the top of the screen.

You can see from these results, the economic impact of 1,000 new employees working in Sector 101 – Mayonnaise, dressing, and sauce manufacturing will have a total effect of 2,742.55 jobs, $117.9M in Labor Income, $207.8M in Value Added, and $841.47 in Output in North Carolina in 2019.

Construction: Building Across Years

INTRODUCTION:
Construction is a tricky thing to consider when modeling economic impacts. While the considerations to analyze are outlined in Construction: Building the Right Model, this article will walk through an example of a project that crosses years, as rarely are large-scale developments completed neatly in one calendar year.

EXAMPLE:
Morgan Construction is planning a large-scale industrial development in Omaha. The 100 acre site will be developed in phases over five years. The developer has given us the following spending information.

MORGAN INDUSTRIAL PARK COSTS BY YEAR
Year Description Cost
2020 Site acquisition $495,000
2021 Water, sewer, utility $950,000
2022 Roads and related preparation $500,000
2023 Construction Phase 1 $1,250,000
2024 Construction Phase 2 $2,500,000
2025 Construction Phase 3 $1,250,000
TOTAL $6,945,000

The first year, 2020, contains only $495,000 in site acquisition fees – the purchase of the land. In IMPLAN, land sales are considered to be asset transfers. One person receives money while the other receives tangible property. Thus, the land sale itself has no value in IMPLAN and will not include this in our model.

The five years of construction on Morgan Industrial Park from 2021-2025 can be modeled. As there are different types of construction work being done in each year, we will need to assign the proper IMPLAN Sector to each. For all construction Sectors, there is a bridge to the Definitions of IMPLAN’S 546 Construction Sectors. Using this document, we can search for what type of construction will be happening each year and choose the appropriate Sector.

MORGAN INDUSTRIAL PARK COSTS & IMPLAN SECTORS
Year Description Cost IMPLAN Sector
2020 Site acquisition $495,000
2021 Water, sewer, utility $950,000 56 – Construction of other new nonresidential structures
2022 Roads and related preparation $500,000 54 – Construction of new highways and streets
2023 Construction
Phase 1 $1,250,000 51 – Construction of new manufacturing structures
2024 Construction
Phase 2 $2,500,000 51 – Construction of new manufacturing structures
2025 Construction
Phase 3 $1,250,000 51 – Construction of new manufacturing structures
TOTAL $6,945,000

Now we are ready to set up our project in IMPLAN first by choosing our Region. In this case, we will be looking at the Omaha-Council Bluffs, NE-IA MSA. Our first step on the Impacts screen will be to set up an Event for each year. Note: if we had more detailed information, we could set up multiple Events for each year.

Conx_-_Events.jpg

Next we will create five different Groups; one for each year of the project. Note that they are all identical except for the Dollar Year. The Dollar Year field is changed for each Group so we can model the Event happening in that year.

The Dollar Year can sometimes be a tricky thing to determine and in the case of a multi-year construction project, it can be difficult to determine whether each year’s expenditures should be accounted for in that year’s dollars or if they should be accounted for in base year’s dollars. The answer? It depends on how the initial dollars are estimated. Dollar Year should always reflect the year of the Event Values. Therefore, if separate expenditures value ares known that will enter the economy independently in different years these multiple years of expenditures should be analyzed in separate Events and Groups.

Conx_-_Groups_Years.png

Now we will drop the Event for each year of the project into the appropriate year Group. Make sure that each Event only drops into one Group.

Conx_-_Groups_with_Events.png

Now we are ready to hit RUN and check out our Results.

RESULTS:
The default that we are seeing on the Results screen is the combination of the impacts across the five years. Looking at our Results, we see that the total Direct Output is not equal to the $6,450,000 of Direct Output we entered on our Impacts screen. This is because of the deflation. We entered 5 different Dollar Years on the Impacts screen and we are seeing our Results in 2019 dollars. The $5,921,136 in Direct Output accounts for the different Dollar Years and the reporting of the Results in 2019 dollars.

Conx_-_Results.jpg

You can see the yearly impacts by using the FILTERS and choosing the Event you want to see. For example, choosing to FILTER by Event Name “Roads” and Dollar Year “2022” will see the Direct Output of $500,000 that we entered on the Impacts screen.

TOTAL EMPLOYMENT TRAP:
If we look at the summary table, we see a Direct Employment of 55.19 jobs and a Total Employment of 88.83 jobs. However, let’s not forget this represents 5 years of construction.

When multi-year projects are summed it is fine to add the yearly Labor Income, Value Added, and Output components together, but Employment is a little different. We suggest reporting Employment in terms of average annual jobs or jobs/year for the project. We do this because:

If worker is on the job site over the course of the entire project or over several years of the project, that job will be counted in IMPLAN more than once. (i.e. if a worker is on site for all five years of project IMPLAN counts that as 5 jobs). However, we know that this is in fact just one job sustained over 5 years of the project.
As the nature of the construction project changes so do the workers. In our example, the jobs supported in the first year were utility workers, then road construction workers came in year two, and industrial building workers in years 3-5. Since some jobs are sustained and some are lost every year, the net effect is best reflected in the expression of average annual or jobs on the site/ year of the project.
To account for the jobs over the 5 years of construction, export your results to Excel and then divide the Direct, Indirect, and Induced Employment by 5. Then you can report your Results and Average Annual Employment.

Average Annual
Employment Labor Income Value Added Output
Direct 11.04 $2,975,680.23 $2,345,712.02 $5,921,135.58
Indirect 2.57 $885,899.86 $1,426,760.83 $2,679,850.41
Induced 4.16 $1,034,410.11 $1,864,219.71 $3,202,522.51
Total 17.77 $4,895,990.20 $5,636,692.55 $11,803,508.49

The Basics of Framing Your Analysis

INTRODUCTION:
When starting an IMPLAN analysis, you should first frame an analysis by identifying the who, what, where, when, and why of the analysis. Each of the first four questions are heavily influenced by the why of your analysis.

Framing your analysis is key to ensuring that studies are, first, prepared properly, and second, created properly inside IMPLAN. Answering the following questions before entering your analysis into the IMPLAN tool is a great way to ensure you’ve thought through the framing of your analysis and have the information you need.

FIVE STEPS OF FRAMING:
Woman.png
WHO ARE THE ACTORS?
Which Industry, Industries, or Commodities are experiencing a change?

Buyers create a demand for products—this is a demand change.
Sellers respond to demand changes by increasing production (Output). So, the seller is our actor.

Paper.png
WHAT IS THE VALUE OF THE ECONOMIC CHANGE?
One or more factors may be known about the change in production or expenditures, including Output (production value), Employment, or Employee Compensation (wages and benefits).

Map.png
WHERE IS THE IMPACT OCCURRING? WHERE DO YOU WANT TO MEASURE THE EFFECT?
These are important considerations when determining a model region.
Where you want to see the results occurring should be influenced by your Why and the audience/stakeholders involved in achieving your end goal with the study. Defining a functional economy may also be valuable to consider. A functional economy encompasses the major labor and production shed of the impact or contribution being modeled, meaning the region captures the local supply chain and areas in which employees are living and spending their income.
Region levels in IMPLAN include:
ZIP Codes
Congressional Districts
Counties
States
US Total
These Regions can be building blocks for Combined Regions or they can be linked together via a Multi-Region Input-Output Analysis (MRIO).
Be aware of aggregation bias – which stems from the loss of detail that occurs when you combine regions together to form a blended larger region.
Consider MRIO which estimates the interregional linkages of trade and commuting effects

Calendar.png
WHEN IS THE IMPACT TAKING PLACE? IN WHAT DOLLAR YEAR ARE YOUR INPUTS?
The Data Year indicates the year of the economy the model is based on, so if you are using a 2017 Data Year, your Region Details, Multipliers etc. will be based on the 2017 economy for the Region. The Data Year should be set to the year of the economy that best represents when the event occurs.
Deflators are applied to input values to convert them into terms of the Data Year before applying the multipliers.
Does the impact occur over a full year, a partial year, or a series of years?
Accounting for inflation – keep in mind that if historical survey data is used, the year of the data source should be used as the Dollar Year.

Brain.png
WHY ARE YOU PERFORMING THIS ECONOMIC ANALYSIS?
It is always smart to consider ALL potential audiences for your study. Ultimately, doing so may help you recognize the level of detail in which your final report should describe your study. Think about your audience:

What are you trying to communicate?
What drives them?

Running Your First New Business Impact

INTRODUCTION:
Welcome to IMPLAN and economic impact modeling! This article will guide you through what you need in order to run your first analysis. Good news! You only need to know a few things to get going. While it is true that the more data and information you have, the more accurate your results will be, sometimes you are only given small pieces of information.

BASIC INDUSTRY ANALYSIS:
Setting up your analysis will follow the same steps we all learned in grade school: who, what, where, when, and why. We call this framing. The most basic type of analysis in IMPLAN is an Industry Event for a new business. Here is what you will need to know.

WHO: Which Industry is being affected? Is this a cotton farm or a medical device manufacturing company? Is there new construction involved or just new operations of a business? Construction and operations should always be analyzed and reported individually. There are 546 Sectors in IMPLAN to choose from. Pick the one that most closely matches the business that you want to impact.

WHAT: What is the Value of the change? Is it 100 new jobs or $100M in new Sales? To analyze an Industry Event in IMPLAN, you will need to have at least one (but you can input all four) of the following: Employment, Employee Compensation (fully loaded payroll), Proprietor Income, or Output. Output differs by business type:

Industries that do not hold inventory
Output = sales (revenues)
Manufacturing
Output = sales plus/minus change in inventory
Retail and Wholesale
Output = gross margin (or Marginal Revenue)
WHERE: IMPLAN data is available for Congressional Districts, Zip Codes, counties, Metropolitan Statistical Areas (MSAs), states, and the nation. Answering this should be determined by the Region where your impact is happening and in which regional economy you want to measure the impact.

WHEN: Each analysis in IMPLAN needs to have an associated Dollar Year. This is usually the same as the year in which the economic event you are analyzing occurred or is expected to occur. The default in IMPLAN will be the current year.

Each Region in IMPLAN is associated with a Data Year. The default Data Year will be the most recent Data Year available in IMPLAN which is appropriate for current and future projects. Historical Data Years are also available in IMPLAN when analyzing a past economic event that.

WHY: The last question answers why this Event is being analyzed in the first place. It is often a good idea to start with the why question to help guide you through the other required steps, but sometimes it is also useful to think about this throughout your analysis all the way to reporting the results.

Did You Know?

INTRODUCTION:

IMPLAN Economists have received a lot of questions over the years. We have compiled a considerable repertoire of best practices and helpful tips from the trenches. This article outlines the most popular extras we want to share with you.


Sunflower_-_Candi.png FILTERS:

When in doubt, FILTER. When exploring Sector/Commodity specific data in the Region Details Behind the “i”, you will need to use the filter to choose the Industry or Commodity you want to see.  Otherwise, you get the default Sector 1 – Oilseed farming (or Commodity 3001 – Oilseeds). And we know we aren’t always looking for information on sunflowers.

Also utilize filters on your Results screen. You can filter to segment your results by Region, Impact, Group, and Event Name. You can also filter the Dollar Year in your Results to choose the year in which you’d like to report your results. When navigating between the tabs on your Results screen, always double-check that the filters you applied stayed with you.  


Ruler.png SIZE MATTERS:

The size of the impact you are running does matter. If you are trying to run an MRIO on one zip code versus the other 41,701 zip codes in the U.S., it likely won’t finish as that money will keep bouncing around the country for quite some time. IMPLAN recommends no more than 7 regions in any MRIO.

If you need to run several studies and one is larger, IMPLAN recommends starting with the smaller one.  All of your impacts will be put in a queue, so we don’t want that small study getting trapped behind that large one.  


Magic_Wand.png FINAL TRICKS:

You can have multiple tabs of IMPLAN open at the same time. You can set up multiple projects, compare Results across projects, or just look cool. 

IMPLAN works best in Chrome, Edge, Firefox, and Safari. Internet Explorer is not supported – as Microsoft quit using it in 2016.  You can try it, but the map won’t even show up on the Regions screen, so we don’t recommend it.  

If you are having issues with something loading improperly or taking longer than usual, hit save and refresh your browser.  This corrects the majority of issues.

You can search within Spending Patterns by using Control + F.

Older datasets (2012-2014) can be accessed by starting at the Project Screen and selecting New Project rather than starting your project at the Regions Screen.

Construction: Building the Right Model

INTRODUCTION:

There are a few special considerations for modeling construction impacts. Not only are all projects different, they need to be carefully considered in IMPLAN.

Construction Sectors don’t have a perfect NAICS crosswalk as the other Industries do.  Instead, there is the file Definitions of IMPLAN’s 546 Construction Sectors found on our 546 Sector Industries, Conversions, Bridges, & Construction – 2018 Data page. This is where you can find which Sector will be best to use whether you are modeling the construction of a power plant, office, or even a museum.

The value entered in Industry Output for construction should be the full cost of the structure, and only the structure. This includes hard costs and soft costs.  Because Employment, by definition, is based on where the job is located not where an individual resides, Employment should include the full value full-time, part-time and temporary Employment on the job site during the year. Additional considerations of costs attributed to construction are considered below.


SQUARE FOOTAGE:

Sometimes rather than construction cost or Employment, only the square footage of the project is known. Calculators to convert square footage to construction costs, by building type, can be found online.


EMPLOYMENT & SPECIALIZED SKILLS: 

While all Sectors are likely to source some Employment from outside the region, construction Sectors are among a group that may be more likely to do so, because in many cases either:

  • The needed skills for a project may not be available in the region
  • Contractors may be sourced from outside the region

In these cases, it is important to remember that Employment is site based in IMPLAN, so even if a worker is brought in from outside the region they still count as “local” employment during the period of their work.

It is sort of unreasonable to assume that these outside workers will spend their income in the same way as residents. Thus, what we will modify is the Labor Income values for the construction sector. The Employee Compensation and Proprietor Income should be reduced by the amount of payroll that is going to workers outside the region, less the regional commuting rate. But do these outside workers then have no local impacts? That also is unlikely if they are in the region for any period. The best way to capture these impacts is by using per diem spending patterns, ideally from the company’s budget or allowances, but when these are not available government per diems can be used as an estimate. This not only captures a more reflective amount of local spending by these temporary residents, but it also prevents their income from being spent on common resident household expenditures like utilities and the costs of owning a home.

An in-commuting rate is gross regional rates in which local workers commute out of the region to go home. In the calculation of the Induced Effects the in-commuting regional rate reduces the total income before it’s distributed to local households. To avoid underestimating the effects of Labor Income you will want to be sure to account for the commuting rate from the Social Accounting Matrix.


LAND VALUES:

When construction impacts are being considered, a question that often arises is: “What is the impact of the sale of the land?” The truth is, the sale of the land has very little impact on the economy. The purchase of the land necessary for a construction activity should not be included as Industry Output for the construction sectors. Why? Land sales are considered asset transfers, where one person receives money while the other receives tangible property. Thus, the land sale itself has no value in IMPLAN. Some small impact may be captured however, by creating an Event for real estate fees, and for large commercial projects, legal fees.


HARD & SOFT COSTS:

Construction spending patterns in IMPLAN include architectural engineering, legal fees and other common soft costs, so these should be included into the Industry Output value. However, if you want to specify these values or have soft costs that are significantly different than a typical construction project in your selected Sector, these can be modeled separately.


FURNITURE, FIXTURES, & EQUIPMENT:

Furniture, Fixtures, and Equipment (FF&E) are large, moveable investments that businesses make.  FF&E consists of movable furniture, fixtures, and other equipment that is not directly attached to a building.  FF&E should not be modeled through the construction Sector.

Often times, the specialized FF&E will not be produced in your region of study. If you know that everything is being brought in, it is considered leakage and you can omit the spending from your model. You may know that it was purchased through a local retailer or wholesaler, so then you can model the purchases through the appropriate Sector. Maybe you know that some of the purchases will be sourced locally. Then you can again choose the appropriate Sector, like 370 – Wood office furniture manufacturing, and enter the spending.  

Estimating Employee Compensation Adjustments for Known Commuting Rates

INTRODUCTION:

IMPLAN estimates an in-commuting rate for all regions – how many people work in the region and go home to another region. This article will show you how to see what IMPLAN estimates as the in-commuting rate and how to adjust it if you have more specific information for your project. The good news is that although there are quite a few calculations to adjust for your known in-commuting rate, we have a spreadsheet to ease the pain.


FINDING IN-COMMUTING RATES:

There are a few steps to figure out the in-commuting rate in IMPLAN. To view the data for your region, click behind the “i” to find the study area data for your region.


Commuting_Rate_-_Behind_the_i.jpg


Next, we can find the in-commuting data for the Region. Navigate to: 

     Social Accounts > IxC Social Accounting Matrix > Aggregate IxC SAM

The Social Accounting Matrix (SAM) can be interpreted as columns making payments to rows. We will be focusing on the Employee Compensation (EC) (5001) column. The payments from the EC column to the Domestic Trade (28001) and Foreign Trade (25001) row are the household income dollars paid to employees that work in the Region but do not live in the Region, or in-commuters. This is referred to in IMPLAN as Commuter EC – the remaining portion of Employee Compensation (EC) once payroll taxes and foreign commuting are removed.

To get an estimate of the in-commuting rate for your region, add the Foreign Trade (20551) + the Domestic Trade (28001) row and divide by the total EC. Below is an example from North Carolina in 2017.


Commuting_Rate_-_Domestic___Foreign_Trade.jpg


So, we take 

     $537,597,426.39 + $7,204,800,286.95 = $7,742,397,713.34. 

Then divide that by the total EC

     $7,742,397,713.34 / $284,542,852,368.49 = 2.72% 

This is the in-commuting rate which you can calculate using the file Commuting Rate – Calculations by filling in the teal boxes.


Commuting_-_Finding_In-Commuting.jpg


ADJUSTING FOR KNOWN IN-COMMUTING RATE:

Adjusting for your known in-commuting rate is necessary when IMPLAN’s in-commuting rate differs from yours, particularly when the difference is significant. The portion of EC earned in the Region by these in-commuters, according to the in-commuting rate, is treated as a leakage in IMPLAN.  Because EC by definition occurs at the site of employment, EC earned by in-commuters is still considered Direct EC to the Region, but because it is earned by non-residents, this EC will not generate any Indirect or Induced Effect in the Region. 

Now that you have your commuting rates, we can use one more table to adjust IMPLAN’s estimated regional commuting rate to your known regional commuting rate. Remember, your known commuting rate needs to be the value of the compensation that leaves the region. It cannot include payroll taxes.

We have four variables:

     MyEC = original, unmodified employee compensation
     MyCR = your known commuting rate
     SamCR = commuting rate reported in the SAM
     NewEC = the EC value you want to use when running the analysis

So the formula is:

     NewEC = MyEC* [ (1-MyCR) / (1-SamCR) ]

For our NC example, we see

     NewEC = $5,000,000 * [ (1-0.00%) / (1-2.72%) ] = $5,139,855.22


Commuting_-_Adjusting_In.jpg


This number, $5,139,855.22 is what you will run through your EC event. But you aren’t quite done yet.

After the analysis has been run, add the difference (MyEC – NewEC) back to your direct EC effect. This is because the adjusted EC value (NewEC) used to run the analysis was just a means of estimating the appropriate Induced Effect based on the known commuting rate. In this example, the difference between MyEC and NewEC is the -$139,855.22. Since EC is a component of Value Added and Value Added is a component of Output, you also need to add this figure to the Direct Effects of Value Added and Output.


Commuting_-_Results.jpg


OUT-COMMUTING:

Sometimes you as the researcher might want to look at data on out-commuting from your region.  Out-commuting will show up as a payment from the Foreign Trade (25001) and Domestic Trade (28001) columns to the nine household (10001-10009) rows.  To get a out-commuting rate, divide the sum of these payments (across the 9 household types in both the Foreign Trade and Domestic Trade columns) by the sum of the nine household column totals. For this one, it’s easier to do your calculations in Excel. 

Use the three dots icon to download the IxC Aggregate SAM table. 3_Dots.jpg

You will then add up the totals of AB10 to AC18 to get the total trade value for the first household group.  Then add the totals for each of the nine household categories J30 to R30, to get the total household value. 

So, in our NC example, we take

     $10,786,102,053.85 / $469,722,964,305.19 = 2.30% 

This is the out-commuting rate which again you can calculate using the file Commuting Rate – Calculations by filling in the teal boxes.


Commuting_-_Finding_Out-Commuting.jpg