Using Occupation Data in IMPLAN

INTRODUCTION

IMPLAN has added its occupation employment by industry data to the IMPLAN application. This dataset shows estimates of occupation employment, wages, hours, and core competencies which include knowledge, skills, abilities, education, work experience, and on-the-job training levels for each of 823 different occupations. Occupation data is available for all models, including models of combined regions, aggregated industry models, and customized models. Occupation data will match the current Data Year in IMPLAN (ie 2018 Data Year will show 2018 Employee Compensation).

There are two different types of Occupation Data that are useful during your analysis: Regional Occupation Data and Occupation Impact Data. 

Regional Occupation Data shows the Occupations, Wages, and Core Competencies that are already present in the Region you are studying. You can find this data Behind the i on the Region page. 

Occupation Impact Data shows the details for the Occupations, Wages, and Core Competencies that accompany your specific impact or contribution.


DETAILS

Occupation data can be used to examine study area data to gain important insights into a Region’s existing labor force, the skill requirements of various Industries, and more. The Occupation Data can also be seen in the Results of any impact or contribution analysis run within the IMPLAN application.

The data levels generally correspond to the BLS’s Standard Occupational Classification (SOC) codes. Major is the most aggregated, followed by Minor, Broad, and Detail. All data is based on national averages but brought to the regional level in IMPLAN. As with Employment, you may see fractional Occupations, especially for small firms where a few employees are spread across multiple Occupations.

The SOC categorizes occupations into one of 823 detailed occupations which contains 459 broad groups, 96 minor groups, and 23 major groups. 

Level

Name

Records

Example

Total

All occupations

1

All Occupations

Major

2-digit

23

51-0000 – Production Occupations

Minor

3-digit

96

51-7000 – Woodworkers

Broad

4-digit

459

51-7030 – Model Makers and Patternmakers, Wood

Detail

5-digit

823

51-7032 – Patternmakers, Wood


WHERE TO FIND OCCUPATION DATA
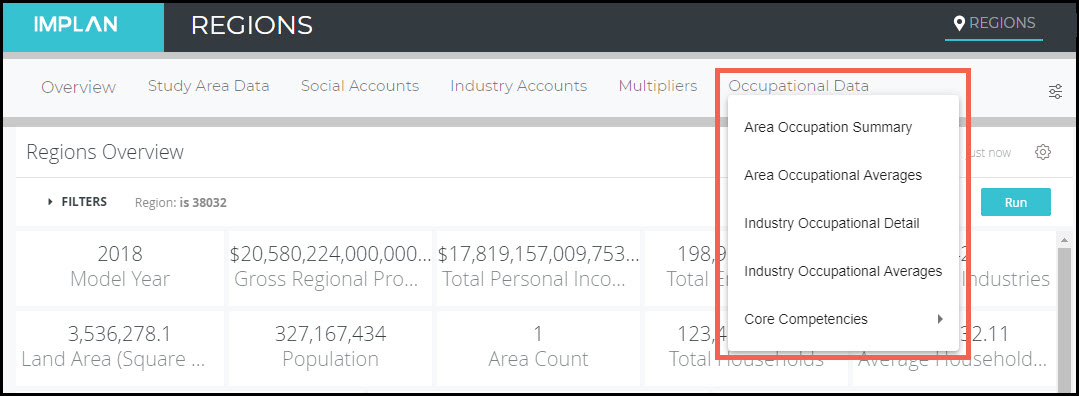
REGIONS OVERVIEW

The tables located in the Regions Overview provide insight into the model Region’s occupation makeup. Descriptions of the data found here are detailed in our Occupation Data – Behind the i article.
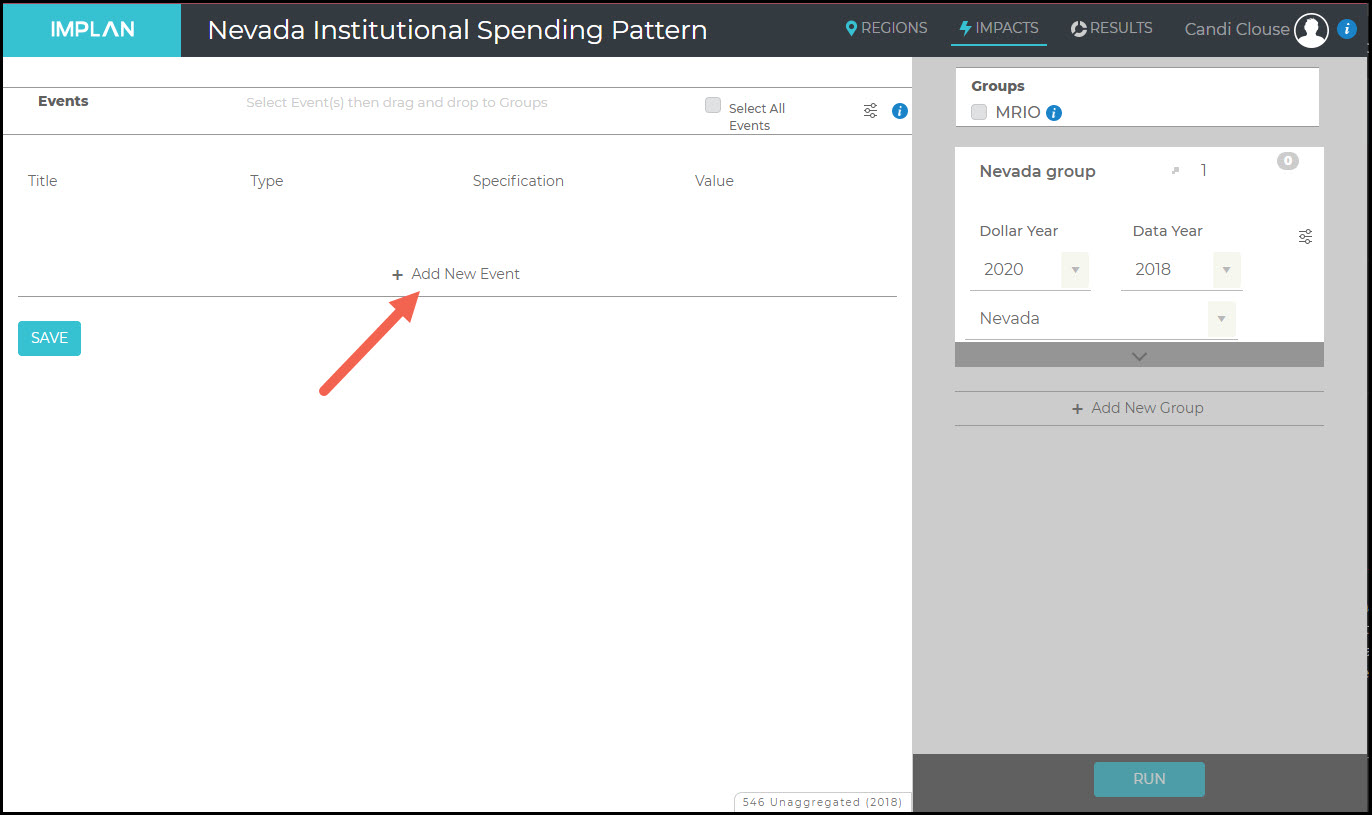
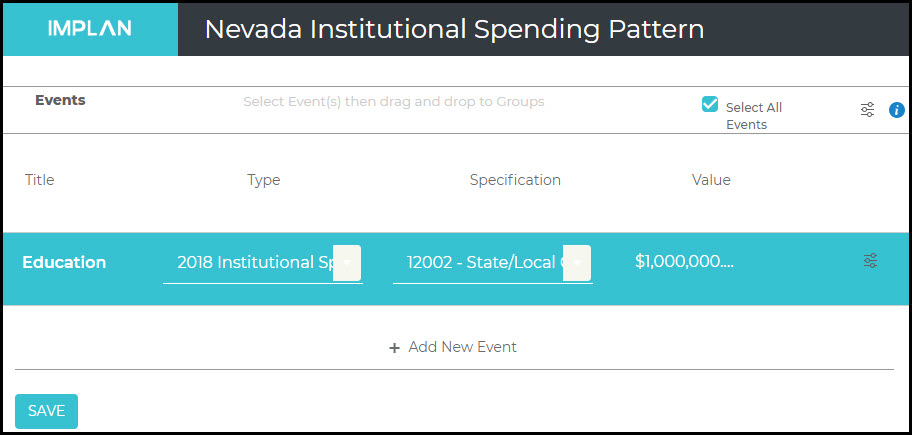
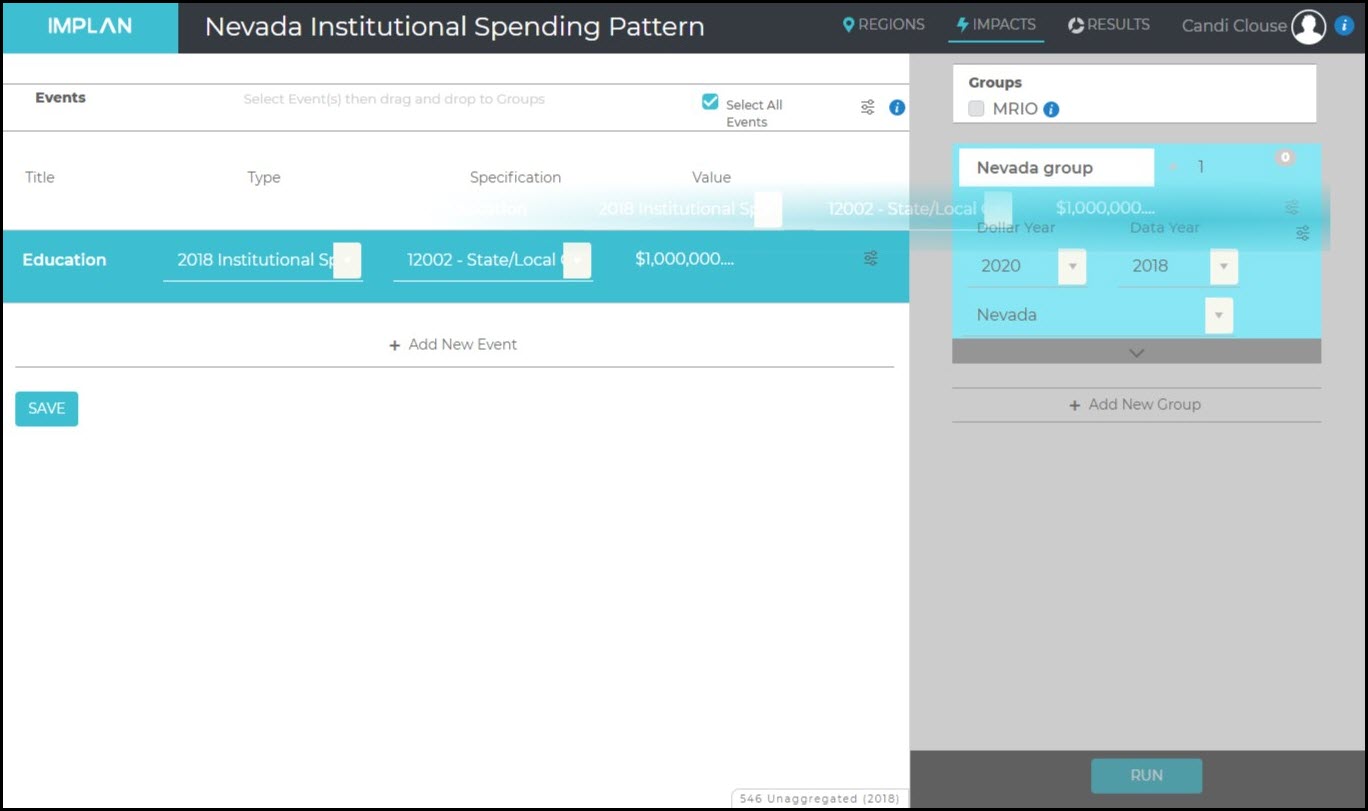
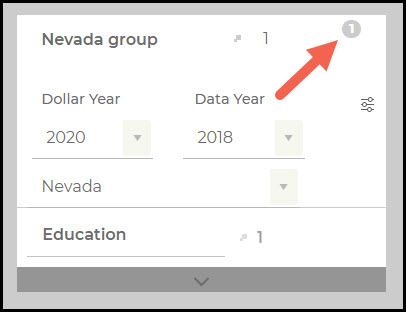
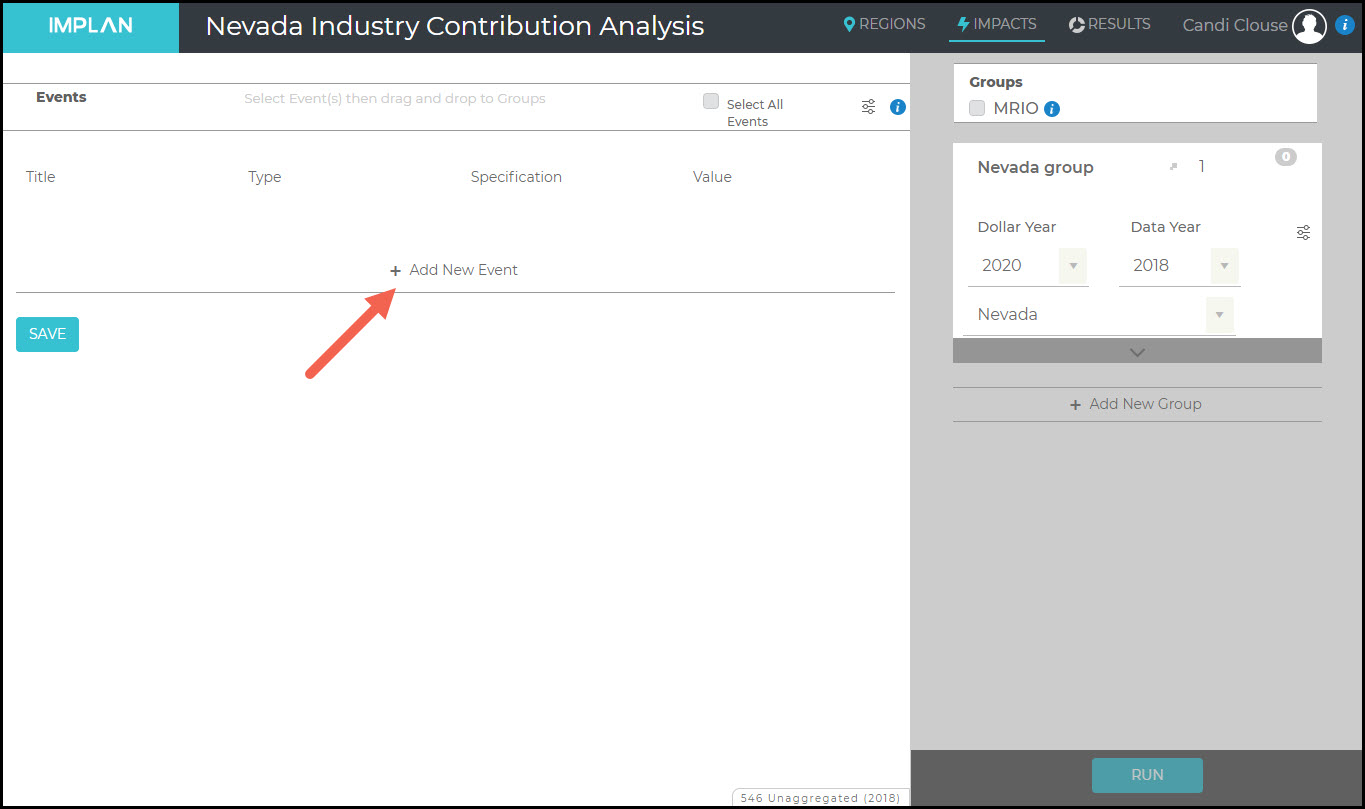
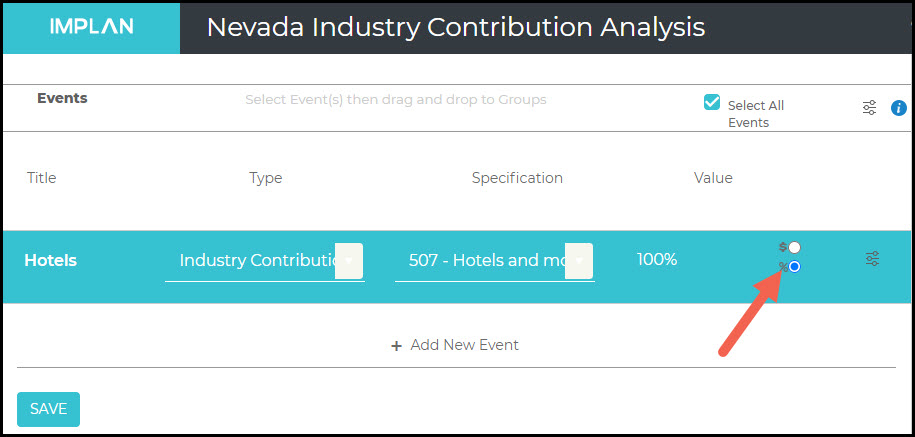
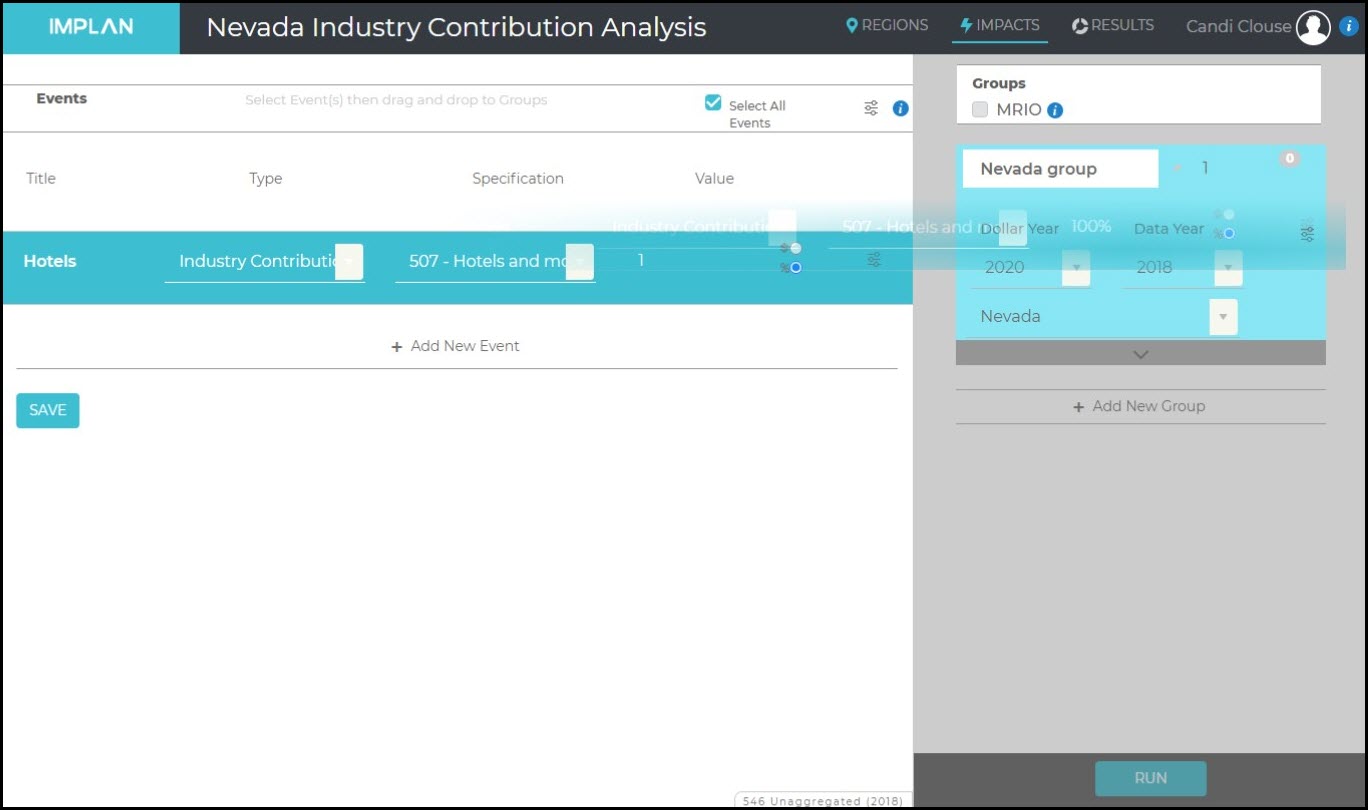
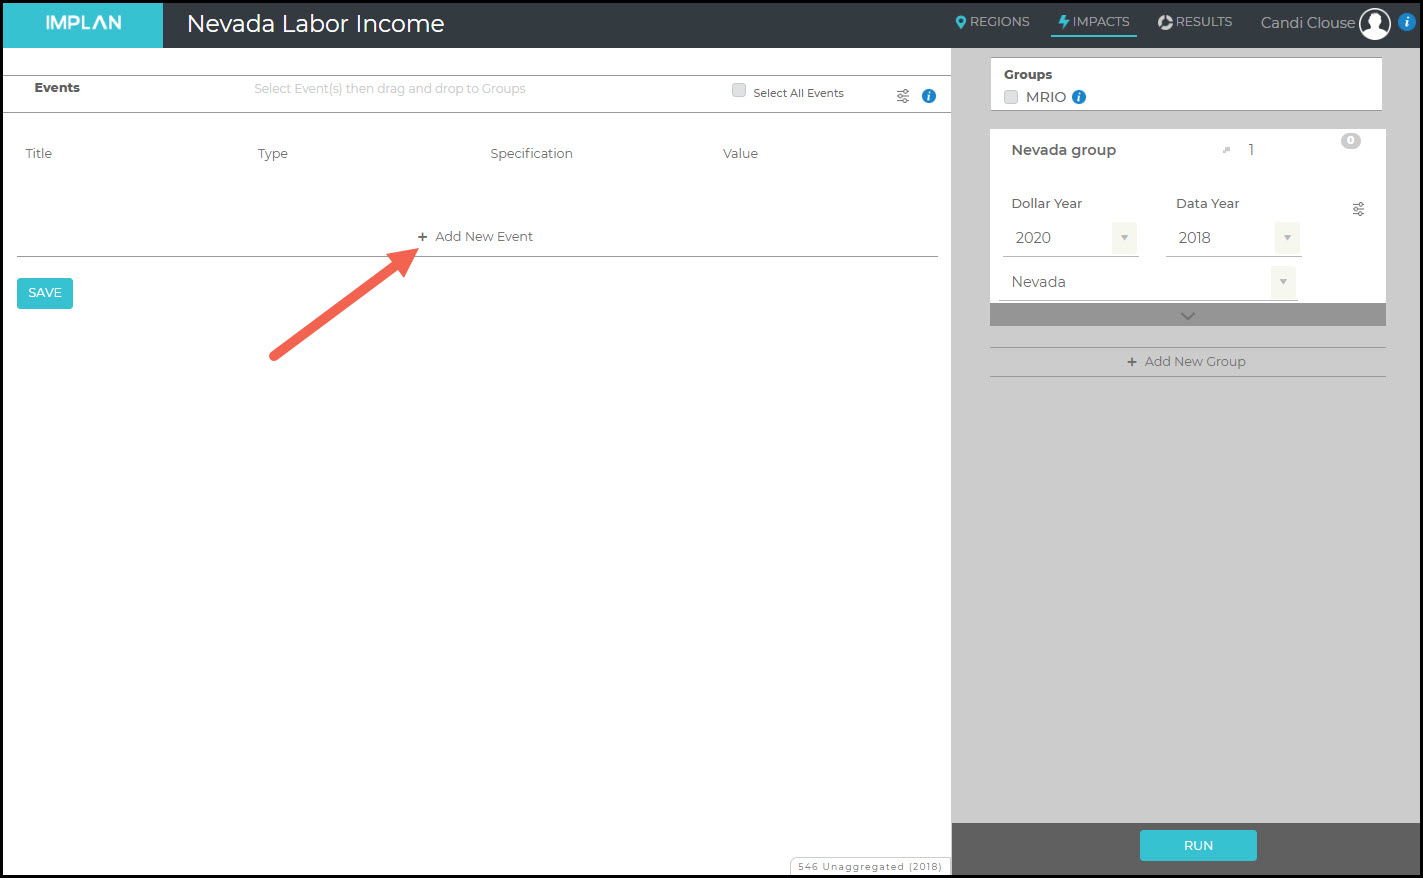
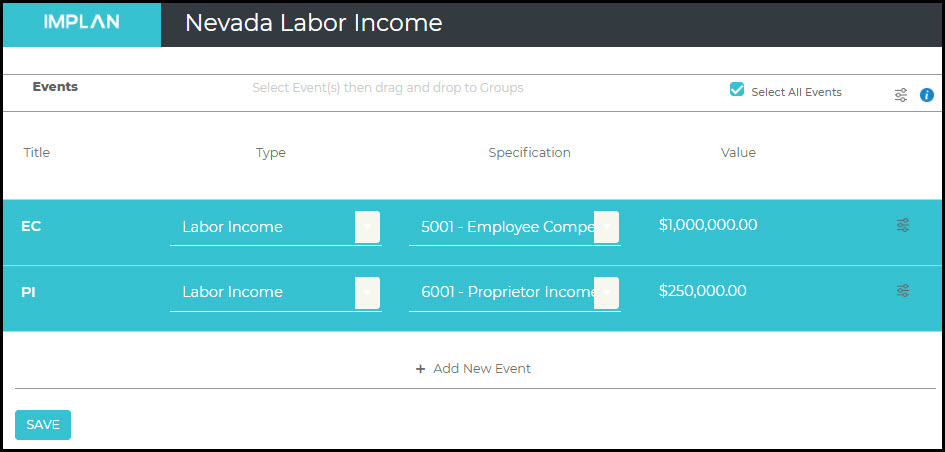
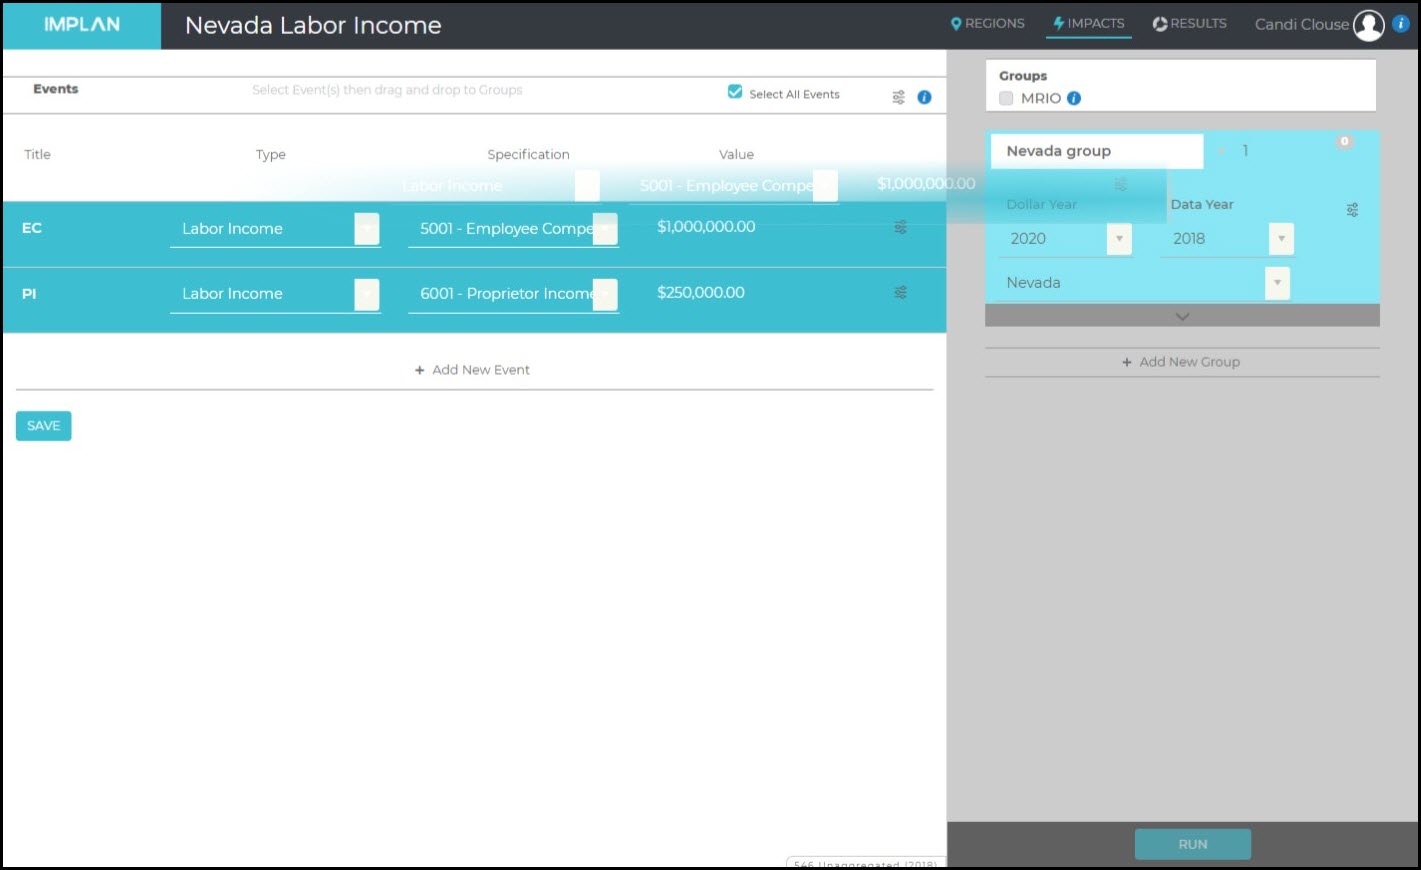
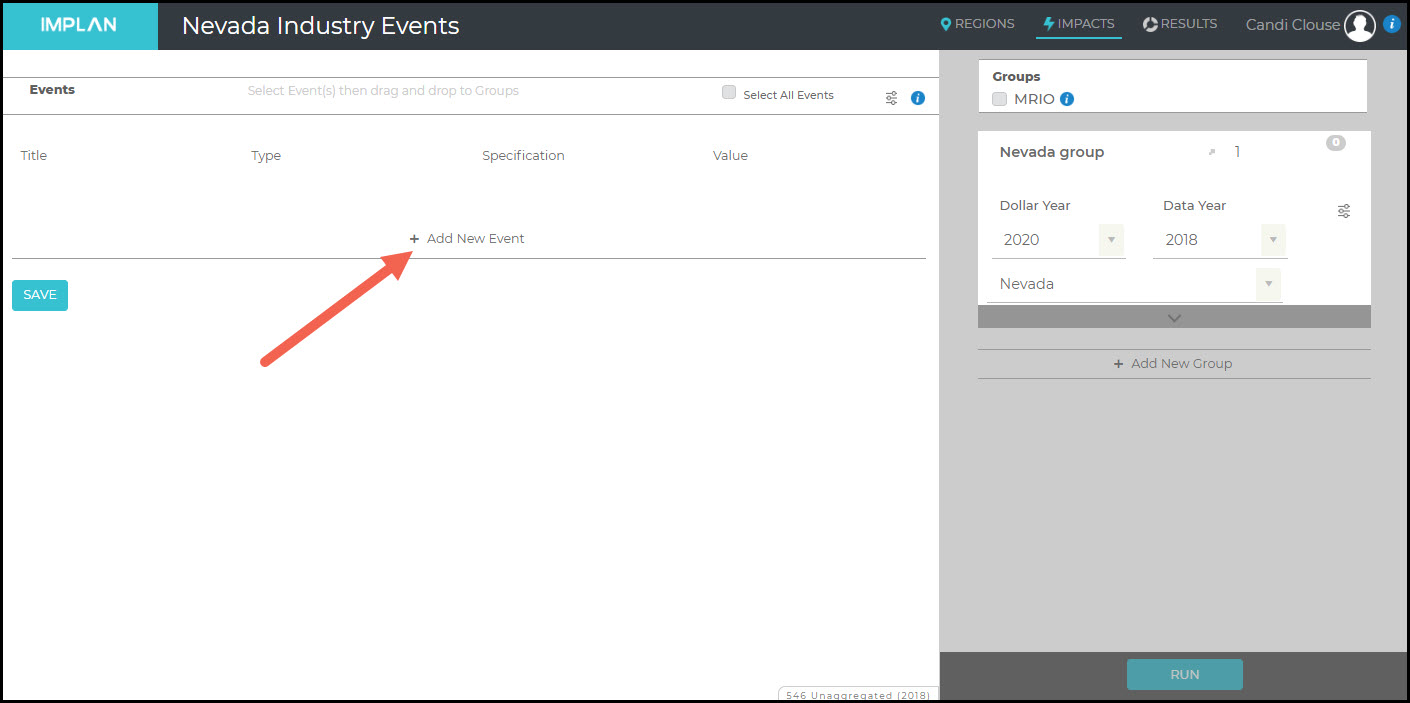
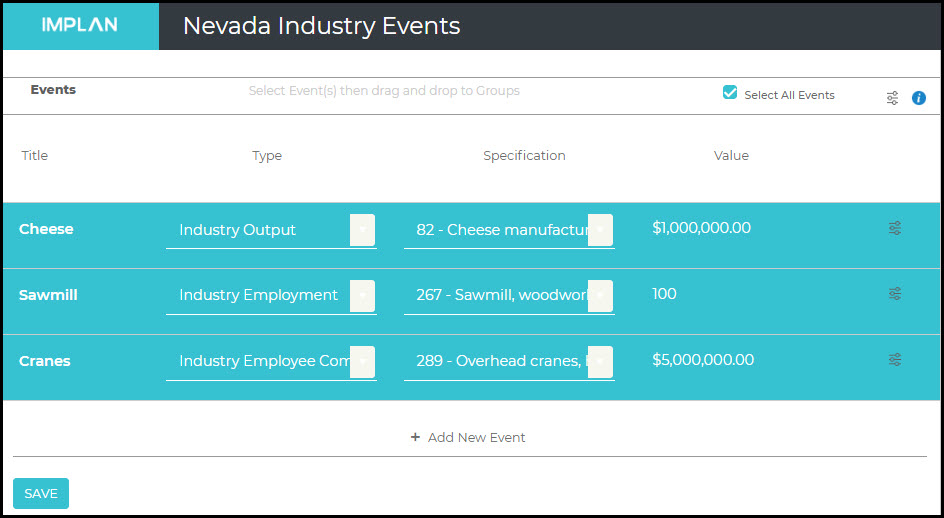
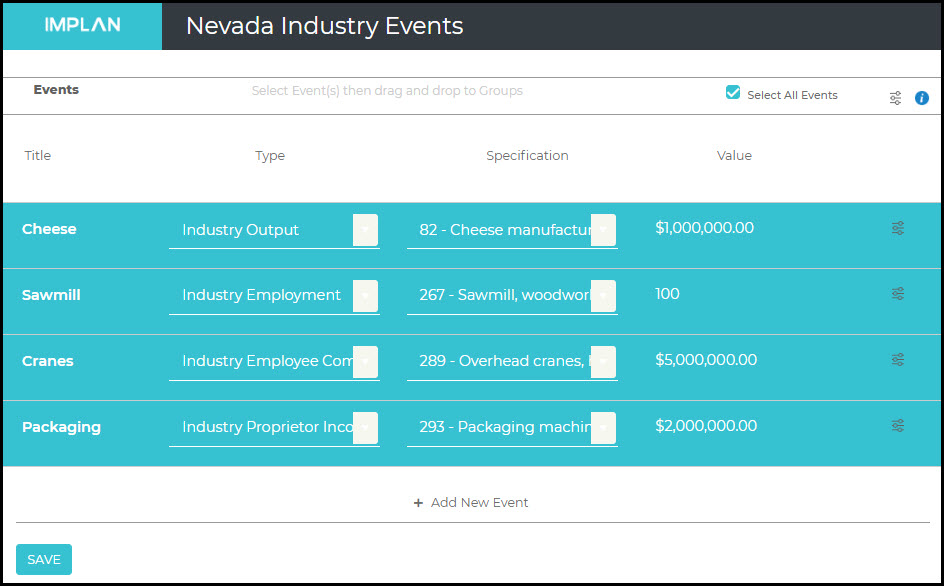
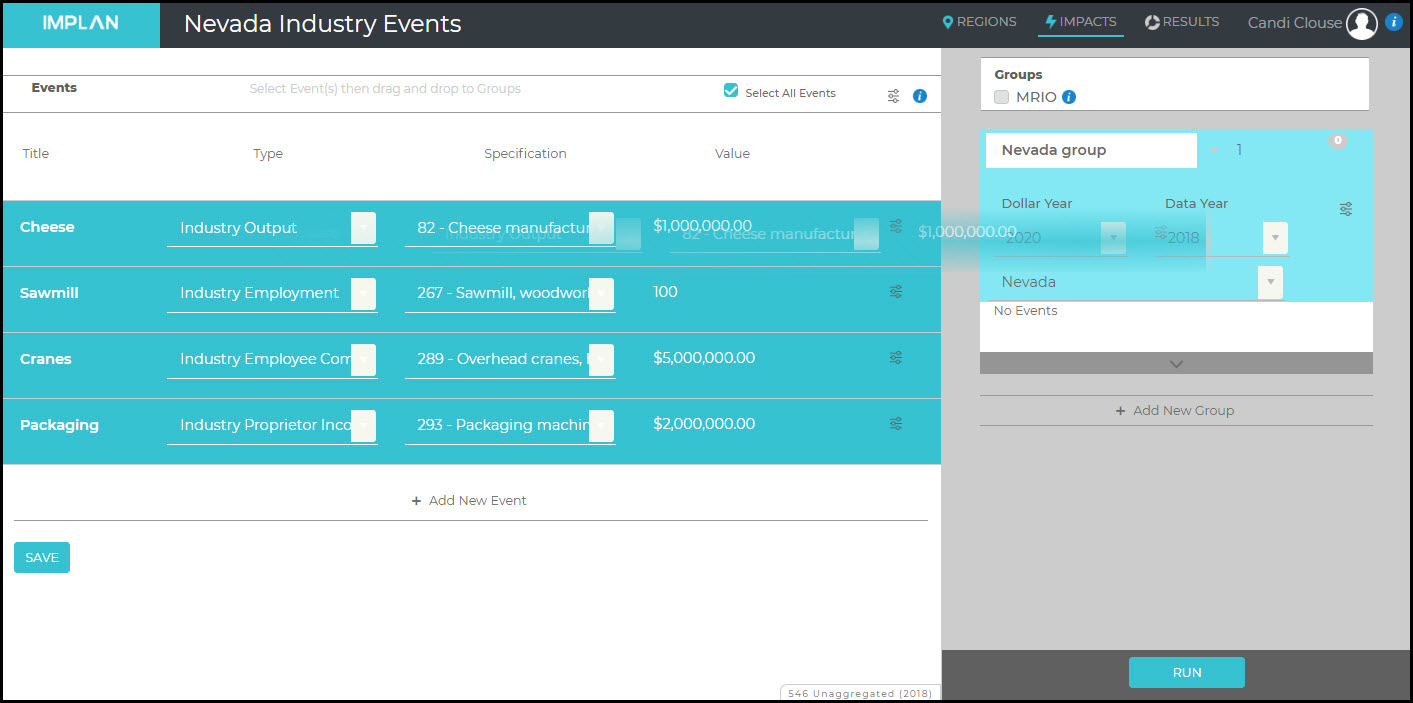
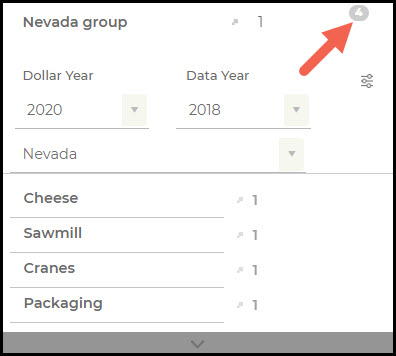
 

Occ_Behind_i_-_Header.jpg

IMPACTS

Distributions of occupation employment, wage, and core competencies are applied only to regional and results data. At this time, you cannot run impacts based on occupations.
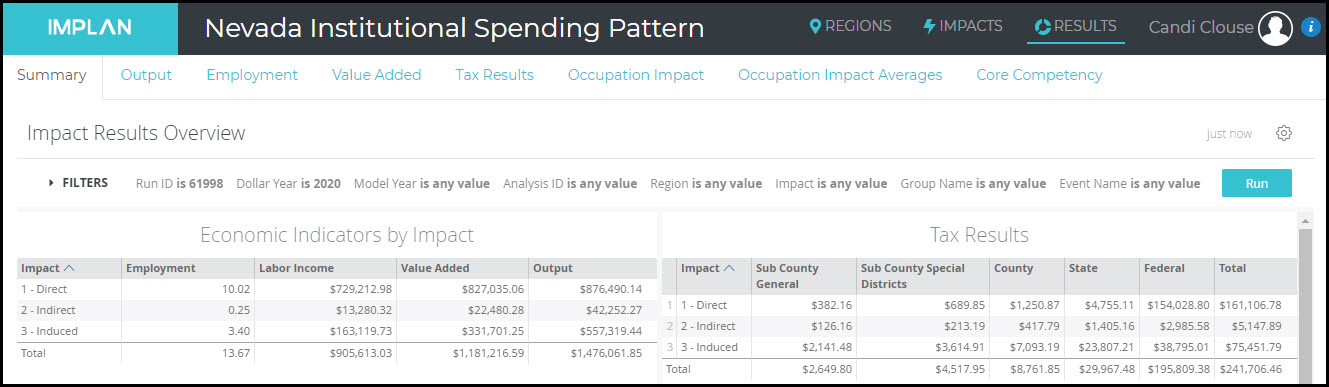
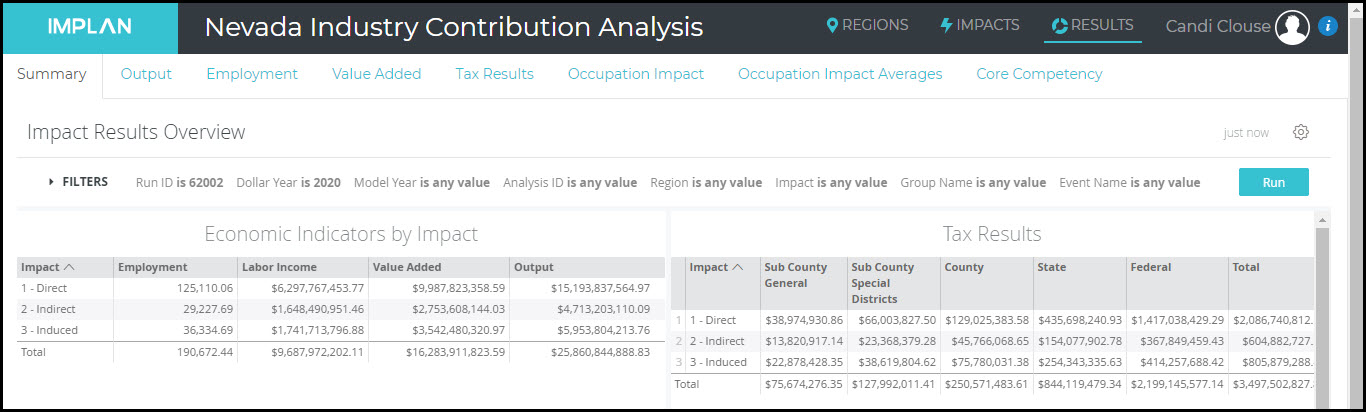
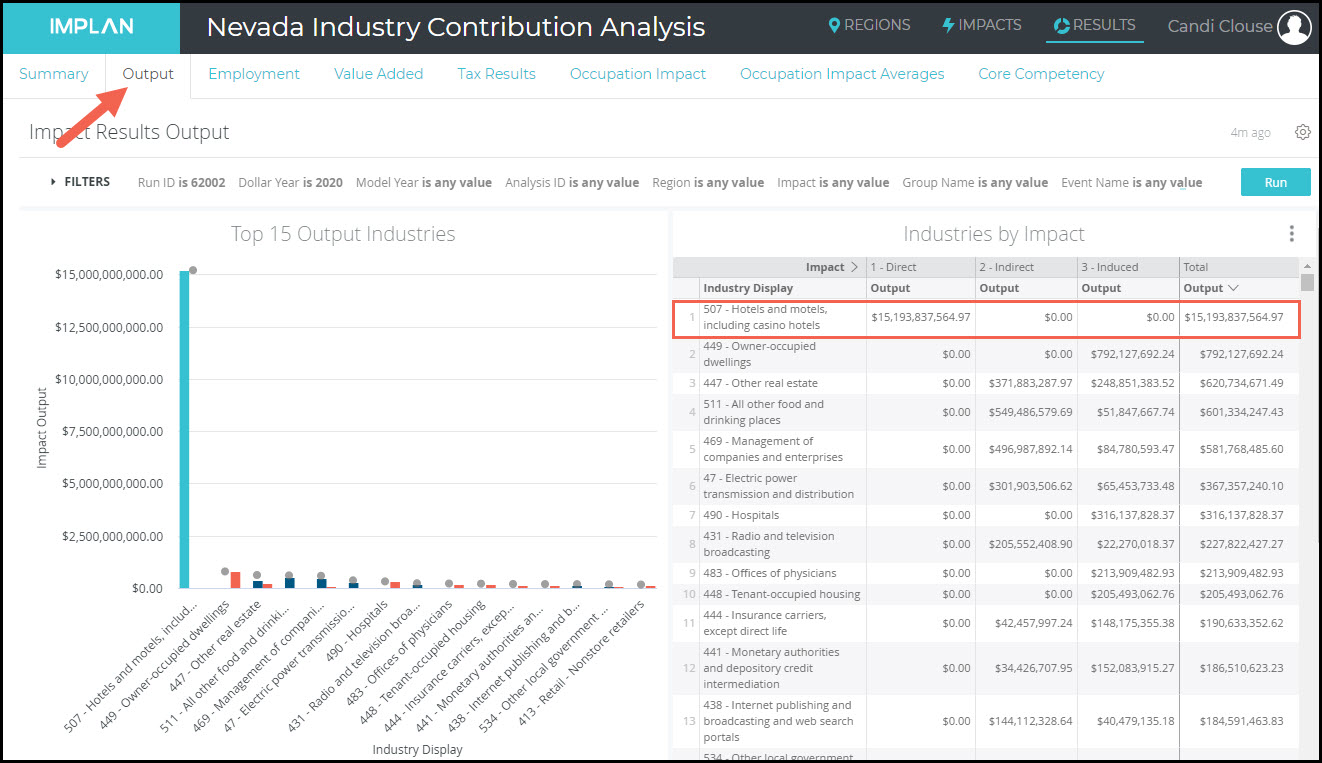
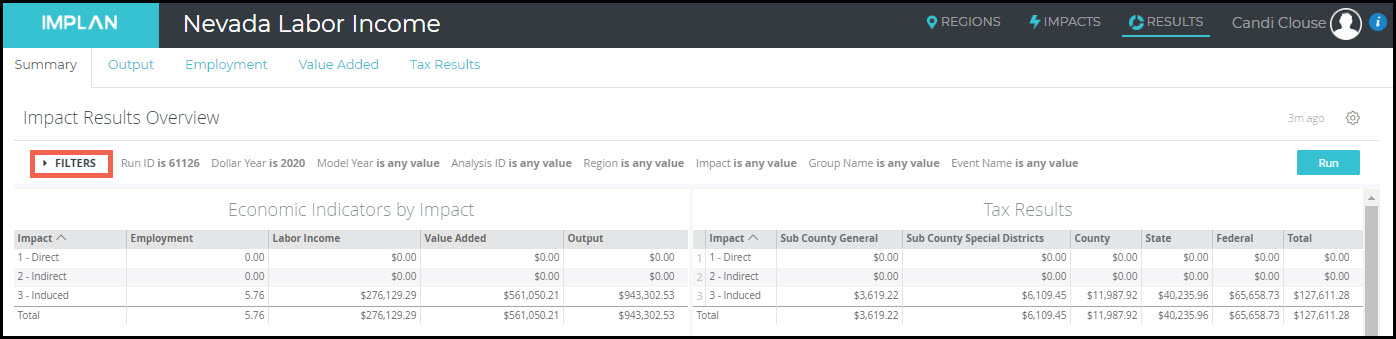
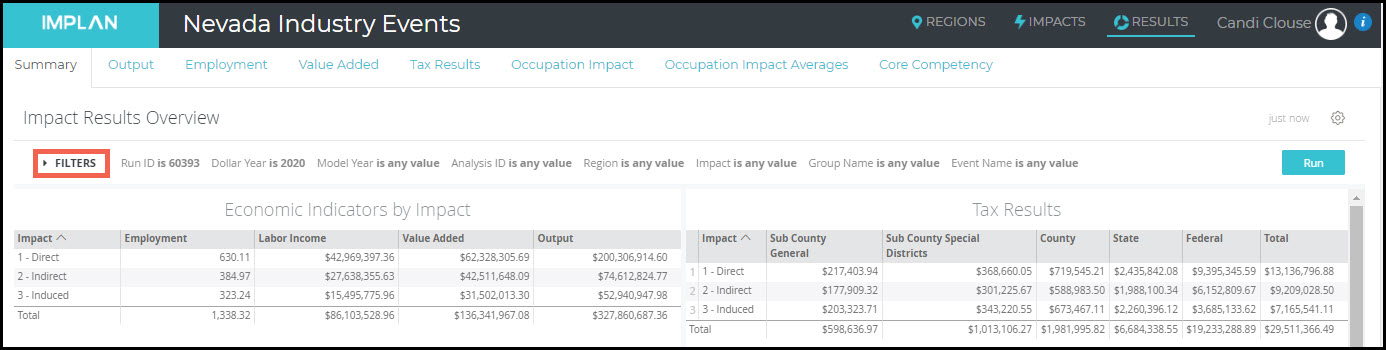
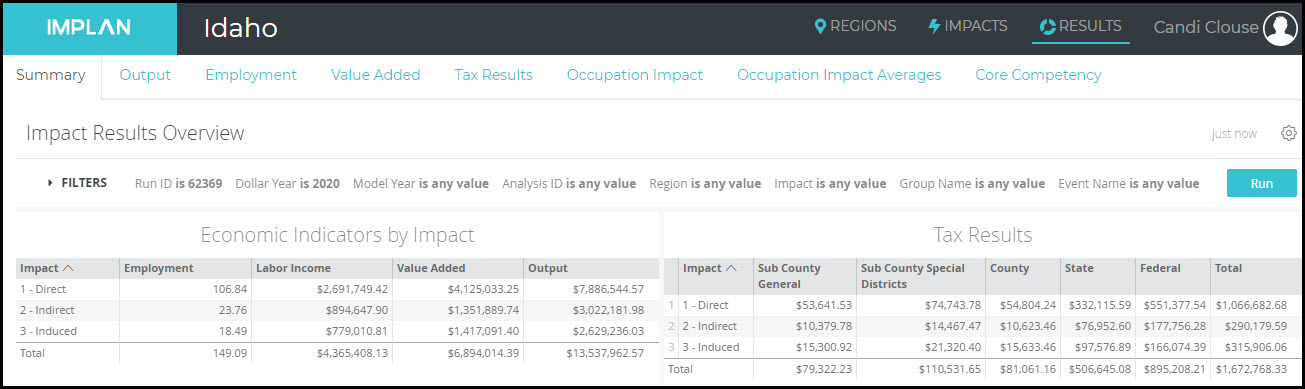
RESULTS

The Occupation Impact Data shows the details for the Occupations, Wages, and Core Competencies that accompany your specific impact or contribution in the Results tab. Descriptions of the data found here are detailed in our Occupation Data – Behind the i article.


Occ_Uses_-_Results_Header.jpg

The Occupation Impact Tab opens the Occupation Impacts screen containing a single table detailing regional employment and wage impacts by-occupation. Use the Filters to limit results to desired Region, Group, Event, and Industry. The Filter can also be used to select a different occupation aggregation level. 

The Occupation Impact Averages tab opens the Occupation Impacts screen containing a single table detailing the average regional employment and wage impacts by-occupation. Use the Filters to limit results to desired Region, Group, Event, and Industry. The Filter can also be used to select a different occupation aggregation level. 

Core Competency opens the Competency Impacts screen containing tables for each core competency category (Ability, Knowledge, Skills, Education Required, Work Experience Required, On-the-Job Training Required). Use the Filters to limit results to desired Region, Group, Event, Industry, and occupation. The filter can also be used to select a different occupation aggregation level. 


DOWNLOADS

Core Competencies

Occupation SOC Codes


RELATED ARTICLES

Occupation Data Details

Occupation Data Use Cases 

Occupation Data – Behind the i

Institutional Spending Pattern Events

INTRODUCTION

Institutional Spending Patterns, like all Spending Patterns, are made up of a list of Commodities, although Institutional Spending Patterns include government payroll Commodities to capture spending on Labor. Because Institutions are Final Demanders, in the case of Institutional Spending Patterns, each Commodity in the Spending Pattern is treated like a Commodity Output Event and will create a Direct Effect.

Event Type

Institutional Spending Patterns 

Event Use

Analyzing general fiscal spending changes

Event Specification

”WHO” 

Federal Government NonDefense

Federal Government Defense

Federal Government Investment

State/Local Govt. Other Services

State/Local Govt. Education

State/Local Govt. Hospital & Health

State/Local Govt. Investment

Capital

Inventory Additions/Deletions

Event Value

“WHAT” 

Total Spending on Goods, Services and Labor


INSTITUTIONAL SPENDING PATTERN EVENTS

IMPLAN can be accessed via app.IMPLAN.com. Once you are logged in, you will be directed to the IMPLAN dashboard. From the dashboard you can navigate to the Regions, Impacts, or Projects screen. 

IMPLAN_Dashboard.jpg

Once you have chosen your Region and named your new Project, you will be directed to the Impacts screen. From here, click on Add New Event to create a Institutional Spending Pattern Event. In this set of examples, 2018 Nevada data is utilized.

Institutional_Spending_Pattern_-_Impacts.jpg

Institutional Spending Pattern Events are unique in that they describe both Intermediate Inputs and Value Added within the same Spending Pattern. This results in these Spending Patterns producing ‘mixed results;’ where the reported Direct Effects describe both what we would generally consider Direct Effects (income, Employment and Value Added) and the first-round Indirect Effects that arise from the government spending its budget. Institutional Spending Pattern Events can be edited. Learn more in the article Editing Institutional Spending Pattern Events.

In this example, we want to look at a potential $1M increase in education spending by the government. We will give our new Event a Title, select the Type as Institutional Spending Pattern, the Specification is 12002 – State/Local Government Education, and the Value is $1,000,000. 

Institutional_Spending_Pattern_-_Event.jpg

Now that you have your Event, ensure that it is highlighted in teal by clicking on the Event or checking Select All Events at the top of the screen. Now the Events can be dragged into your Group on the right.

Institutional_Spending_Pattern_-_Drag.jpg

You will know when the Events have populated in the Group when the number in the upper right of the Group box equals the number of Events.

Institutional_Spending_Pattern_-_Group.jpg

Now click Run in the bottom right of the Impacts Screen.

The Institutional Spending Pattern Event Type represents a general spending distribution for measuring broad Institutional activity in your Region. 

Institutional_Spending_Pattern_-_Results.jpg

RELATED ARTICLES

ABP: Introduction to Analysis-By-Parts

Editing Institutional Spending Pattern Events

Explaining Event Types

Industry Contribution Events

INTRODUCTION

Industry Contribution Analysis (ICA) is a method used to estimate the value of an Industry or group of Industries in a Region, at their current levels of production. While the focus of the analysis still looks at backward linkages, the purpose of this analysis differs from the standard economic impact analysis. ICA shows the relative extent and magnitude of the Industry, event, or policy in the study area.

ICA is a unique method which applies a constraint upon the model by removing feedback linkages (buybacks) to the Industry being analyzed. This method can also be used with single firms, but if/when it is, the results of this method should be considered conservative.

ICA denotes that the study is looking at how the current state of an Industry supports other businesses in the local economy. When this involves a single firm, the analyst will need to determine if the Impact Method or Industry Contribution Analysis Method should be used. The results in either case should be described with words such as “contributes to” or “sustains.”  

Event Type

Industry Contribution

Event Use

Estimating effect of an existing Industry’s production

Event Specification

”WHO” 

Industry 1-546  for which the contribution is being measured

Event Value

“WHAT”

Output or % of Industry


INDUSTRY CONTRIBUTION EVENTS

IMPLAN can be accessed via app.IMPLAN.com. Once you are logged in, you will be directed to the IMPLAN dashboard. From the dashboard you can navigate to the Regions, Impacts, or Projects screen. 


IMPLAN_Dashboard.jpg


Once you have chosen your Region and named your new Project, you will be directed to the Impacts screen. From here, click on Add New Event to create a Industry Contribution Event. In this set of examples, 2018 Nevada data is utilized.


ICA_-_Impacts.jpg

In this example, we want to look at the contribution of the entirety of the hotel Industry in Nevada. We will give our new Event a Title, select the Type as Industry Contribution Analysis, the Specification is 507 – Hotels and motels, including casino hotels, and the Value is 1. The buttons after the Event Value give us the choice between entering a dollar value or entering a percentage of the total Industry. In that we want to see the entire Industry, we will select the %. Check out the article Picking an Industry for assistance in choosing the appropriate IMPLAN Industry.


ICA_-_Event.jpg

Now that you have your Event, ensure that it is highlighted in teal by clicking on the Event or checking Select All Events at the top of the screen. Now the Events can be dragged into your Group on the right.


ICA_-_Drag.jpg

You will know when the Events have populated in the Group when the number in the upper right of the Group box equals the number of Events. You will also see a new icon in teal indicating that this is an Industry Contribution Analysis.

ICA_-_Group.jpg


Now click Run in the bottom right of the Impacts Screen.


ICA_-_Results.jpg

To see how the constraints on the hotel Industry worked, navigate to the Output tab in the Results. The largest Industry in terms of Output was Industry 507 – Hotels and motels, including casino hotels with a total of $15,193,837,564.97. On the Industries by Impact table, you can see that the entirety of this was in the Direct Effect and the Indirect and Induced Effects in this Industry are zero. If we had used a standard Industry Output Event, there would be additional Indirect and Induced Effects in our Results.


ICA_-_Output_Results.jpg


RELATED ARTICLES

Explaining Event Types

ICA: Introduction to Industry Contribution Analysis

Industry Spending Pattern Events

INTRODUCTION

Industry Spending Patterns include all Intermediate Inputs for a given Industry. Industry Spending Pattern Events are most appropriate to use when an analyst has the data required to build a customized Spending Pattern which reflects specific purchases by an Industry or when the ratios in an Industry’s Leontief Production Function must be modified to a degree beyond that which is achievable by simply customizing an Industry Event. 

Event Type

Industry Spending Patterns 

Event Use

Analyzing a change in Intermediate Inputs

Event Specification

”WHO” 

Industry 1-546 making purchases of Intermediate Inputs

Event Value

“WHAT”

Intermediate Inputs or Output (per Advanced Menu)

INDUSTRY SPENDING PATTERN EVENTS

IMPLAN can be accessed via app.IMPLAN.com. Once you are logged in, you will be directed to the IMPLAN dashboard. From the dashboard you can navigate to the Regions, Impacts, or Projects screen. 

IMPLAN_Dashboard.jpg

Once you have chosen your Region and named your new Project, you will be directed to the Impacts screen. From here, click on Add New Event to create an Industry Spending Pattern Event. In this set of examples, 2018 Nevada data is utilized.

Industry_Spending_Pattern_-_Impacts.jpg

At the most basic level, Industry Spending Pattern Events can be used to examine the economic impact of only the Intermediate Inputs of an Industry. Intermediate Inputs are the purchases of non-durable goods and services that are used to produce other goods and services rather than for final consumption. Industry Spending Patterns can be edited through the Advanced Menu. Learn more in the article: Editing Industry Spending Pattern Events.

In this example, we want to look at only the spending on Intermediate Inputs by casinos. We will give our new Event a Title, select the Type as Industry Spending Pattern, the Specification is 503 – Gambling industries (except casino hotels), and the Value is $1,000,000. Check out the article Picking an Industry for assistance in choosing the appropriate IMPLAN Industry.

Industry_Spending_Pattern_-_Events.jpg

Now that you have your Event, ensure that it is highlighted in teal by clicking on the Event or checking Select All Events at the top of the screen. Now the Event can be dragged into your Group on the right.

Industry_Spending_Pattern_-_Drag_Events.jpg

You will know when the Events have populated in the Group when the number in the upper right of the Group box equals the number of Events.

Industry_Spending_Pattern_-_Group.jpg

Now click Run in the bottom right of the Impacts Screen.

The first thing you will notice is that there are no Direct Effects. Industry Spending Pattern Events only affect spending on Intermediate Inputs, so there will only be Indirect and Induced Effects. Learn more in the article Explaining Event Types.


Industry_Spending_Pattern_-_Results.jpg

Industry Spending Pattern Events are often used as part of Analysis-by-Parts (ABP). ABP allows you to examine a specialized Industry or a firm that is not reflected by an IMPLAN Industry due to differences in the structure of the Leontief Production Function and/or Spending Pattern that cannot be edited via a single Industry Event. This type of analysis is typically used to split the stemming ripple effects of an Industry Impact into its individual impact components – budgetary Spending Pattern (Intermediate Inputs), which can be analyzed using an Industry Spending Pattern Event, and payroll, which can be analyzed using Labor Income Event(s).


RELATED ARTICLES

ABP: Introduction to Analysis-By-Parts

Editing Industry Spending Pattern Events

Explaining Event Types

Understanding Intermediate Inputs (II)

Household Income Events

INTRODUCTION

Household Income Events are appropriate to model a change in Household Income isolated from Industry production and payroll. In Household Income Events, you can specify the specific income group(s) receiving the income. Examples would be a government stimulus check or tax refund.

Household Income values should include all new Household Income the residents will receive including personal tax and savings. IMPLAN will automatically deduct personal tax and savings. Household spending of income on imported goods and services will also be treated as leakage.

Event Type

Household Income Events

Event Use

Analyzing a change in Household Income separately from production 

Event Specification

”WHO” 

HH LT15K, HH 15-30K, HH 30-40K, HH 40-50K, HH 50-70K, HH 70-100K, HH 100-150K, HH 150-200K ,HH GT200K

Event Value

“WHAT” 

Total Household Income for specified income group


HOUSEHOLD INCOME EVENTS

IMPLAN can be accessed via app.IMPLAN.com. Once you are logged in, you will be directed to the IMPLAN dashboard. From the dashboard you can navigate to the Regions, Impacts, or Projects screen. 

IMPLAN_Dashboard.jpg

Once you have chosen your Region and named your new Project, you will be directed to the Impacts screen. From here, click on Add New Event to create a Household Income Event. In this set of examples, 2018 Nevada data is utilized.

Household_Income_Event_-_Add_Event.jpg

Household Income represents the income received by people for their participation in production, from government and business transfer payments, and from returns on capital (e.g., interest payments, dividends). Household Income Events allow the analyst to pick which income group(s) will receive the gain or loss of income.

Specification

Explanation

Households LT15k

Those earning less than $15,000

Households 15-30K

Those earning between $15,000 and $30,000

Households 30-40K

Those earning between $30,000 and $40,000

Households 40-50K

Those earning between $40,000 and $50,000

Households 50-70K

Those earning between $50,000 and $70,000

Households 70-100K

Those earning between $70,000 and $100,000

Households 100-150K

Those earning between $100,000 and $150,000

Households 150-200K

Those earning between $150,000 and $200,000

Households GT200K

Those earning greater than $200,000

In this example, there will be a stimulus check for households that earn less than $40,000. We are told this will result in $2,000,000 of new income in Nevada for households earning less than $15K, $1,500,000 for households earning between $15-30K, and $3,000,000 for households earning between $30-40K. Therefore, we will set up one Household Income Event for each household level.

Household_Income_Event_-_3_Events.jpg

Now that you have your Events, ensure that all are highlighted in teal by clicking on them individually or checking Select All Events at the top of the screen. Now the Events can be dragged into your Group on the right.


Household_Income_Event_-_Drag.jpg

You will know when the Events have populated in the Group when the number in the upper right of the Group box equals the number of Events.

Household_Income_Event_-_Group.jpg

Now click Run in the bottom right of the Impacts Screen.

The first thing you will notice is that there are no Direct or Indirect Effects. Household Income Events only affect household spending, so there will only be Induced Effects. Learn more in the article Explaining Event Types.

In this example, we included three Events, so the default on the Results screen will include all three. If you want to look at the impacts for just one Event, click on Filters and search for the Event Name that you want to see.


Household_Income_Event_-_Results.jpg

RELATED ARTICLES

Explaining Event Types

Labor Income Events

INTRODUCTION

Labor Income Events are appropriate to model a change in labor payments which are isolated from Industry production. An example would be a wage increase for current employees. There won’t be any new production, but the workers will earn more.

IMPLAN will automatically deduct in-commuting income, payroll tax, personal tax, and savings from Labor Income Events. All payroll taxes stay in the location of the employment. That is, only commuters’ post-payroll-taxes-income is deducted. Household spending of income on imported goods and services will also be treated as leakage. 

Event Type

Labor Income Events

Event Use

Analyzing a change in Labor Income separately from production 

Event Specification

”WHO” 

Employee Compensation or Proprietor Income

Event Value

“WHAT”

Employee Compensation or Proprietor Income 


LABOR INCOME EVENTS

IMPLAN can be accessed via app.IMPLAN.com. Once you are logged in, you will be directed to the IMPLAN dashboard. From the dashboard you can navigate to the Regions, Impacts, or Projects screen. 

IMPLAN_Dashboard.jpg

Once you have chosen your Region and named your new Project, you will be directed to the Impacts screen. From here, click on Add New Event to create a Labor Income Event. In this set of examples, 2018 Nevada data is utilized.

Labor_Income_Event_-_Impacts_Screen.jpg

Labor Income represents all forms of Employment income, including Employee Compensation (wages, salaries, and benefits) and Proprietor Income. When using a Labor Income Event, there are two Specification options: Employee Compensation and Proprietor Income.

Employee Compensation is the total payroll cost of wage and salary employees to the employer.  This includes wages and salaries, all benefits (e.g., health, retirement) and payroll taxes (both sides of social security, unemployment insurance taxes, etc.).  It is also referred to as fully-loaded payroll.

Proprietor Income consists of payments received by self-employed individuals and unincorporated business owners. More specifically, it represents the current-production income of sole proprietorships, partnerships, and tax-exempt cooperatives. It excludes dividends, monetary interest received by nonfinancial business, and rental income received by persons not primarily engaged in the real estate business.

In this example, there will be an additional $1M in Employee Compensation and an additional $250K in Proprietor Income. The Industry or Industries in which employees are earning new income is irrelevant in this example because there is no change in production, just an increase in earnings by existing employees. One Event will be set up for each type of Labor Income. 

Labor_Income_Event_-_2_Events.jpg

Now that you have your Events, ensure that all are highlighted in teal by clicking on them individually or checking Select All Events at the top of the screen. Now the Events can be dragged into your Group on the right.

Labor_Income_Event_-_Drag_Events.jpg

You will know when the Events have populated in the Group when the number in the upper right of the Group box equals the number of Events.

Labor_Income_Event_-_Impacts_Group.jpg

Now click Run in the bottom right of the Impacts Screen.

The first thing you will notice is that there are no Direct or Indirect Effects. Labor Income Events only affect household spending, so there will only be Induced Effects. Learn more in the article Explaining Event Types.

In this example, we included two Events, so the default on the Results screen will include both. If you want to look at the impacts for just one Event, click on Filters and search for the Event Name that you want to see.

Labor_Income_Event_-_Results.jpg

Labor Income Events are often used as part of Analysis-by-Parts (ABP). ABP allows you to examine a specialized Industry or a firm that is not

reflected by an IMPLAN Industry due to differences in the structure of the

Leontief Production Function and/or Spending Pattern that cannot be edited via a single Industry Event. This type of analysis is typically used to split the stemming ripple effects of an Industry Impact into its individual impact components – budgetary Spending Pattern (Intermediate Inputs) and payroll.


RELATED ARTICLES

ABP: Introduction to Analysis-By-Parts

Explaining Event Types

Running Your First New Business Impact

Understanding Labor Income (LI), Employee Compensation (EC), and Proprietor Income (PI)

Industry Events

INTRODUCTION

There are four Industry Event Types in IMPLAN: Output, Employment, Employee Compensation, and Proprietor Income. Each of them operates in the same manner. This article will walk you through an example of each type of Industry Event.

Event Type

Industry (Output, Employment, Employment Compensation, Proprietor Income)

Event Use

Analyzing a change in an Industry’s production

Event Specification

”WHO” 

Industry 1-546 experiencing change in demand/production  

Event Value

“WHAT”


1 or more:

     Output

     Employment

     Employee Compensation

     Proprietor Income


INDUSTRY EVENTS

IMPLAN can be accessed via app.IMPLAN.com. Once you are logged in, you will be directed to the IMPLAN dashboard. From the dashboard you can navigate to the Regions, Impacts, or Projects screen. 

IMPLAN_Dashboard.jpg

Once you have chosen your Region and named your new Project, you will be directed to the Impacts screen. From here, click on Add New Event to create your first Industry Event. In this set of examples, 2018 Nevada data is utilized.


Industry_Event_-_Impacts_Screen.jpg

INDUSTRY OUTPUT

The first type of Event is Industry Output. In IMPLAN, Output represents the value of Industry production. For service Industries, Output equals sales. For  manufacturing firms, Output equals sales +/- the change in inventory. For retailers and wholesalers, Output equals their gross margin or Marginal Revenue (not gross sales) and does not include the value of goods sold. By default, the Event Value of an Industry Output Event with a retail or wholesale Industry specified is interpreted as Total Revenue. Learn more about retail and wholesale margins in the article Retail and Wholesale: Industry Margins.

In this example using an Industry Output Event, we are told a cheese manufacturing firm will have $1M in new production. We will give our new Event a Title, select the Type as Industry Output, the Specification is 82 – Cheese manufacturing, and the Value is $1,000,000. Check out the article Picking an Industry for assistance in choosing the appropriate IMPLAN Industry.


Industry_Event_-_Output_Event.jpg

Perhaps we are also told that this cheese company will pay $250,000 of that $1M in production in Employee Compensation. We can click on the menu button to enter additional information for Employment, Employee Compensation, and Proprietor Income.

Industry_Event_-_Output_Event_Advanced.jpg

Clicking on Close will collapse the Advanced Menu.

IMPLAN will always prioritize the Event Values in the following order:

  1. Output
  2. Employee Compensation
  3. Proprietor Income
  4. Employment

Therefore, if this Event had instead been entered as an Industry Employee Compensation Event with a Value of $250,000 and an Output Value of $1,000,000 entered in the Advanced Menu, the Event would still produce the same Impact Results. 


INDUSTRY EMPLOYMENT

Sometimes, we are only given an Employment figure. In this example, we are told there will be 100 new employees in a new sawmill. We will give our new Event a Title, select Industry Employment as the Type, select Industry 267 – Sawmill, woodworking, and paper machinery as the Specification, and type the Value of 100. 

Industry_Event_-_Employment_Event.jpg

INDUSTRY EMPLOYEE COMPENSATION

If Output is unknown, but you do know the Employee Compensation associated with a new project, an Industry Employee Compensation Event is appropriate. Employee Compensation is the total payroll cost of wage and salary employees to the employer. This includes wages and salaries, all benefits and payroll taxes.  It is also referred to as fully-loaded payroll.

In this example, we are told there will be $5M in new Employee Compensation at a crane manufacturing facility. We will give our new Event a Title, select Industry Employee Compensation as the Type, select Industry 289 – Overhead cranes, hoists, and monorail systems manufacturing as the Specification, and enter $5,000,000 as the Value. If you know more information, utilize the Advanced Menu to add in other known Values.


Industry_Event_-_EC_Event.jpg

INDUSTRY PROPRIETOR INCOME

The final type of Industry Event is Industry Proprietor Income. Proprietor Income consists of payments received by self-employed individuals and unincorporated business owners. More specifically, it represents the current-production income of sole proprietorships, partnerships, and tax-exempt cooperatives.

In this example, we are told there will be $2M in new Proprietor Income at a packaging machinery manufacturing plant. We will give our new Event a Title, select Industry Proprietor Income as the Type, select Industry 293 – Packaging machinery manufacturing as the Specification, and enter the Value of $2,000,000. If you know more information, utilize the Advanced Menu to add in other known Values.

Industry_Event_-_PI_Event.jpg


Now that you have your Events, ensure that all are highlighted in teal by clicking on them individually or checking Select All Events at the top of the screen. Now the Events can be dragged into your Group on the right.


Industry_Event_-_Move_to_Group.jpg

You will know when the Events have populated in the Group when the number in the upper right of the Group box equals the number of Events.


Industry_Event_-_Group.jpg

Now click Run in the bottom right of the Impacts Screen.

When the analysis is finished, you are ready to check out your Results. For more information on how to interpret them, check out the article Industry Impacts: Direct, Indirect, and Induced Effects.

In this example, we included four Events, so the default on the Results screen will include all four. If you want to look at the impacts for just one Event, click on Filters and search for the Event Name that you want to see.


Industry_Event_-_Results.jpg

RELATED ARTICLES

Explaining Event Types

Industry Impacts: Direct, Indirect, and Induced Effects

Picking an Industry

Running Your First New Business Impact

Wage & Salary Income

Wage & Salary income includes base salary and/or wages, employee paid social insurance tax, bonuses, stock options, severance pay, profit distributions, and reimbursements for meals and lodging. It is a portion of Employee Compensation.

Scaling Groups & Events

INTRODUCTION

IMPLAN is an annual, linear model. This means that analyzing $100 would yield the same Results as analyzing $1 and multiplying the results by 100. The scaling feature in IMPLAN allows you to set up Events and then adjust all the Events by this figure. 


SCALING GROUPS

Scaling is especially fun when looking at a group of Events for a tourism impact. When analyzing tourism impacts, we have a list of expenditures usually by individual visitors. We can set this up as shown with one Event for each affected Industry. In this example, we are examining a basic visitor spending for a weekend with the Idaho Falls Chukars. We know that each visitor spends approximately $2,000 on a weekend trip across six spending categories.


Scaling_-_Impacts.jpg

If we are told there were 5,000 visitors, we could just multiply each Value by 5,000. However, we can also use scaling to tell IMPLAN to multiply each value by 5,000. Drag your Events into the Group. Then on the number 1 next to the Group name, type 5,000. This will multiply each Event by 5,000.

Scaling_-_Scaling.jpg


Our Results will show the impacts of $2,000 total spending for each of the 5,000 guests. Our Direct Output is therefore just shy of the $10M in total spending, due to the fact that we used one retail Industry and therefore margins were applied. For more information on this, check out the articles Margins & Deflators and Why don’t my Direct Effects match my Direct inputs?

Scaling_-_Results.jpg

SCALING EVENTS

Perhaps we are told that only 3,000 of the total 5,000 attendees used hotel rooms, transit, and airfare. We can scale each Event individually to reflect this new information. Ensure that the scaling on the entire Group is 1. Then click on the menu icon and select scaling.

Scaling_-_Scale_Events.jpg


Now you can edit the 1s that are located to the right of each Event in the Group. In our example, we enter 3,000 for Hotel, Transit, and Airfare, and 5,000 for Restaurant, Retail, and Sports. 

Scaling_-_Scale_Events_Entered.jpg


This will then tell IMPLAN to multiply the first three Events by 3,000 and the last three Events by 5,000. We would expect a Direct Output of slightly less than $8.4M and we see $7.9M in our Results.

Scaling_-_Scale_Events_Results.jpg


RELATED ARTICLES

Margins & Deflators 

Surveying for Input-Output

Tourism Spending

Why don’t my Direct Effects match my Direct inputs?

Indian Tribes: Considerations for Native American Impacts

INTRODUCTION

There are 1.9 million American Indians and Alaska Natives belonging to 574 federally recognized American Indian tribes and Alaska Native Villages in the U.S. Not only are Native Americans an important part of our national identity, but they are also a large part of the national economy.


TRIBAL GOVERNMENTS 

Generally, Tribal Governments are covered by QCEW (from the BLS, our main source for wage & salary employment) and BEA (another source for employment), and both sources classify tribal establishments as local government.  Therefore, they are included in IMPLAN data. However, some tribal authorities are not subject to Federal/State employment security (ES-202) laws. Those who are must report employment and income.  It is optional for those who are not. 

If they are covered and included, there is unfortunately no way to identify in the data sets which employment is Tribal vs. other Local Government.  You could ask employment security for your state if the reservation reports.  If it does, their information will be included in the county data – if not, it probably is not included. It is best to work with Tribes to get detailed data or use proxies based on related IMPLAN spending patterns like Institutional Spending Pattern 12001 – State/Local Government Other Services.

Tribal Government can potentially be found in:  

  • 532 – Local Government Passenger Transit 
  • 533 – Local Government Electric Utilities 
  • 534 – Other Local Government Enterprises 
  • 542 – Employment and payroll of local govt, education
  • 543 – Employment and payroll of local govt, hospitals and health services
  • 544 – Employment and payroll of local govt, other services


BUSINESSES

Tribes operate many businesses and enterprises. While Tribal data falls into the above mentioned Industries, determining the effects of a specific Tribal business operations is often better achieved through using the appropriate Industry for each business, working with the Tribe to determine appropriate inputs, and applying some modifications to the results as required.

For example, many casinos are owned by Tribes, in which case these establishments will be captured in the region’s data for Industry 534 – Other local government enterprises. Unfortunately, in such a case there’s no way to determine how much of Industry 534 belongs to the Tribal government, and of that, how much belongs to Tribal casino operations. If we want to analyze the operations of a Tribal casino, working with the Tribe to determine the scale and specifics of their casino operations is recommended. With those initial findings, we can utilize the methods described in the article Casinos: Acing the Impact to run our analysis.


INTERNALIZING TRIBAL GOVERNMENT

Let’s take an example where a Tribal casino makes a payment to the Tribal government (like a tax). By default, IMPLAN will treat this payment as a leakage, as it treats all tax payments. If we want to look at how that government payment ripples through the economy, we can add an Institutional Spending Pattern 12001 – State/Local Government Other Services Event in the amount of the payment, being sure to set the LPP to 100% in the Menu by unclicking the SAM checkbox. Because this is not a Direct Effect (or even an Indirect one), all of the Results of the Institutional Spending Pattern (Direct + Indirect + Induced) should be moved to the Induced line. Then the Results from the casino can be added to the Results from the Tribal Government.


FEDERAL PROGRAMS

There are many federal programs specifically designated for Tribes like the Tribal Transportation Program and the Indian Health Service. Through various programs, federal dollars are invested in local economies on everything from healthcare to bridge construction. To best model this funding, the Industry receiving the grant should be utilized. So, if you are modeling the construction of a new school, Industry 53 – Construction of new educational and vocational structures should be used. 


OTHER RESOURCES

Federally Recognized Indian Tribes and Resources for Native Americans

National Congress of American Indians

U.S. Department of the Interior Bureau of Indian Affairs


RELATED ARTICLES

Casinos: Acing the Impact