Volunteers don’t get paid, not because they’re worthless, but because they are priceless.
Sherry Anderson
Unfortunately, not all productive activity is actually included in GDP. Volunteer or unpaid work is not included as it is not only difficult to measure, it has no explicit economic activity related to them that can be measured using I-O analysis. However, the results of that volunteer activity as measured by other economic activity related to the workers (additional tourism, increased productivity, etc.), then one can use that activity as the input, claiming the value exists due to the volunteer work.
Not all volunteers are essential. Some may perform functions that are wonderful, although not required and the organization would still operate without them. However, it is hard to think about an organization like Girl Scouts or the American Legion running without volunteers. If the argument can be made that “but for” these volunteers, none of the activity would occur, then estimations of their economic impact make sense. However, care needs to be taken when outlining your methodology to avoid valuing volunteer work as full Output-producing jobs.
VALUING VOLUNTEER TIME
The Independent Sector estimates the Value of Volunteer Time for each state and the U.S. each year. The current estimation is $25.43 per hour at the national level. Their methodology is based on average hourly pay “of all production and non-supervisory workers on private non-farm payrolls” from the BLS. They note that following the Financial Accounting Standards Board guidelines, volunteer time should only be included if they are performing a specialized skill. Note that the Value of Volunteer Time is based on the volunteer work, not the person’s paid employment. So if a rocket scientist volunteers for a park beautification, the value of his or her time should be based on the earnings of a groundskeeper and not a rocket scientist.
Another way to value volunteer time is using the BLS Occupational Employment Statistics data. This data is released by occupation, so a closer estimate to the actual value of a certain job duty can be found. This is best utilized when a volunteer is performing a specialized skill like a trained medical doctor volunteering to do health screenings at a community event.
A third school of thought is that the value of a volunteer’s time should be based on the hourly wage that the person normally receives for their paid employment. This is problematic on a few levels and is the least preferable method, but may provide useful insight in some situations.
ANALYZING THIS IN IMPLAN
Now that you have estimated the value of the volunteer time you want to capture in IMPLAN, create an Industry Employee Compensation Event in the Industry that reflects the work. Enter the value of the volunteer work in the Employee Compensation. If you know the number of volunteers, add that in using the advanced menu. Also in the advanced menu, zero out the Proprietor Income field. Run your analysis.
You may only want to estimate the value of the Intermediate Inputs that would be required because of volunteer time, as well as the associated Indirect and Induced Effects. In this case, we recommend that you run either an Industry Employee Compensation Event or an Industry Employment Event and zeroing out Proprietor Income. Then on your Results, deduct the Direct Employment and Direct Employee Compensation associated with the volunteers. So if you ran $500,000 in an Industry Employee Compensation Event, on the Results screen you would zero out the Direct Employment and deduct $500,000 from Direct Labor Income, Direct Value Added, and Direct Output.
Life’s most persistent and urgent question is, what are you doing for others?
Martin Luther King, Jr.
https://implan.com/wp-content/uploads/Market-site-Logo-resized-2-1.jpg00Joe Demskihttps://implan.com/wp-content/uploads/Market-site-Logo-resized-2-1.jpgJoe Demski2020-08-12 11:06:352020-08-12 11:06:35Volunteers: Estimating the Economic Impact of Free Labor
As the world continues to see changes stemming from the COVID-19 pandemic, more questions arise on best practices for how to look at the economic impact of the latest developments in IMPLAN. Here are some considerations to think through when analyzing your impacts.
ASSUMPTIONS
The assumptions inherent in Input-Output analysis remain the same. However, two specifically come into play.
The Constant Make Matrix assumption states that an Industry will always produce the same mix of Commodities regardless of the level of production. In other words, an Industry will not increase the Output of one product without proportionately increasing the Output of all its other products. Given the increased production of items like personal protective equipment, this assumption could be called into question when manufacturing firms like Ford have pivoted to make respirators and masks; not a usual Commodity coming from automobile manufacturers.
On the flip side, another assumption states that there are No Supply Constraints. This means there are no restrictions to raw materials and employment to produce an unlimited amount of product. During this pandemic, there is excess capacity as plants are operating at reduced capacity and there are a lot of unemployed people. Because of this, businesses are willing to accept lower prices and also not increase prices, so increases in demand (i.e., the changes analyzed in Input-Output) are less likely to change prices and Input-Output is therefore more reasonable.
PURCHASING CHANGES
People and businesses normal purchasing patterns have changed. Industries may be spending less on payroll and travel, while spending more on technology. These changes will affect how the multipliers react.
Additionally, household purchases are changing. There are fewer trips to restaurants and far less travel and entertainment. So, the multipliers for household spending are also affected.
The government issued stimulus checks to people that are working and those that are not. This money will likely be saved by those working and spent by those who are currently not employed.
Finally, while some people have been furloughed or lost their jobs entirely, unemployment benefits are being collected. In some cases, people are actually earning more with the expanded unemployment benefits. This money may be spent or saved.
INDUSTRY CHANGES
Industries are changing, too. Trade across the U.S. and the world has changed. Also, the relative sizes of Industries have changed. Some tech and manufacturing industries, for example, have grown, whereas in-person service industries (e.g., restaurants, sporting events, other personal services) have declined. Some businesses have been completely shuttered while some are booming and employing additional staff and shifts. The Paycheck Protection Program (PPP) has given out loans to small businesses to pay their employees during the pandemic in order to ensure that Employee Compensation levels are maintained, benefits retained, rent is paid, and utilities are continued. These forgivable loans might make the difference between a business staying open or closing for good.
ANALYZING THIS IN IMPLAN
Some of the changes to the economy are easily modeled in IMPLAN like adding 100 new jobs at a manufacturing plant with an Industry Employment Event. However, given the systemic nature of many of the current changes, Analysis by Parts (ABP) is often the best approach. Using ABP allows you to tailor the Leontief Production Function by inputting your own Direct Effects and even modifying your Indirect and Induced Effects.
For example, the Indirect and Induced Effects can be altered to move spending that was going to restaurants to spending at grocery stores. Also, an assumption could be made that people are saving more money than normally because they cannot go anywhere and therefore less disposable income is expended. On the other hand, many people have lost income and are probably spending a higher percentage of income than in the model. In these cases, you can export the SAM, rearrange and rebalance it, and recalculate your own multipliers that more accurately reflect what you want to show.
Governments have also been reporting large losses in sales tax revenues. Most of this stems from reduced overall economic activity, not from changes in effective tax rates. By adjusting your inputs and results, you should not have to do much editing to the tax impact report. However, effective personal income tax rates are based on labor income and capital income; reduced capital income (e.g., from dividends and rent) might require adjustments to personal income taxes. Corporate income taxes likely also would need to be edited. In this case, we recommend supplementing the direct tax impacts with your own estimates.
DATA RESOURCES
The following lists some data sources on how the economy has changed to help inform how to edit direct effects, the model, and/or results.
Several news outlets, research organizations, banks, and consultancies have identified particular industries and occupations affected by changes related to COVID-19.
Until all of the dust settles from the economic changes spurred by the pandemic, we will not know the full extent of the impact. Be cautious not to overstate the effects in your analysis. Consider taking additional care in analyzing the Results by Industry and Type of Effect. As there are likely to be winners and losers, consider both sides of the equation by using a Net Analysis.
We get this question a lot at IMPLAN. You run an analysis of $5M and your Results only show $4.8M in Direct Output. Where did the other $200,000 go?
There are seven reasons that these numbers won’t match. Let’s walk through them.
THE SEVEN REASONS WHY
MISSING INDUSTRY
If you are modeling a list of Industries, it is possible that one of them doesn’t exist in your Region. If it doesn’t exist in the IMPLAN data, there will be no effect from that Industry. If you know that the Industry does now operate in your Region, you can add it by Customizing your Region.
DIFFERENT DOLLAR YEARS
In order to see the exact number that you used on the Impacts screen in your Direct Effects, you will need to ensure that your Dollar Year matches on both screens. For example, if you analyzed your Events using 2018 Dollar Year, filter your Results for 2018 Dollar Year. If different years are used, you will not see exact matches between the Impacts screen and the Results screen. Check out the article on Dollar Year & Data Year for more details.
EVENT TYPE
The only Event Types that will give you a Direct Effect are Industry Events, Industry Contribution Events, Commodity Output Events, and Institutional Spending Pattern Events. Direct Effects are not a part of Labor Income Events, Household Income Events, or Industry Spending Pattern Events. More details are in the article Explaining Event Types.
MARGINS
A Margin is the value of the transportation, wholesale, and retail trade services provided in delivering Commodities from the factory floor to buyers. Margins are calculated as sales receipts less the cost of the goods sold. They consist of the trade Margin plus sales taxes and excise taxes that are collected by the trade establishment.
Most Input-Output models, including IMPLAN, record expenditures in producer prices (known as Marginal Revenue). This allocates expenditures to the Industries that produce the goods or services. Any Output or sales you want to apply to multipliers that are in purchaser prices (prices paid by final consumers) need to be converted from purchaser price (Total Revenue) to producer prices (Marginal Revenue) or allocated to the producing Industries. Margins enable the move from producer to purchaser prices or vice-versa.
IMPLAN values are based on the actual costs of producing the product or service being sold. Margins are necessary whenever an item is purchased from a retailer or wholesaler. Margins can be applied to retail and wholesale Industry Events and Commodity Events.
When margins are applied, you will not see the full Value from your Impacts screen in your Results. The portion that you do see in the Results is the margin coefficient for retail or wholesale Industry. Details can be found in these two articles: Retail and Wholesale: Industry Margins and Retail and Wholesale: Commodity Margins.
LOCAL PURCHASE PERCENTAGE
The Local Purchase Percentage (LPP) in Commodity Output Events and Spending Pattern Events is by default set to 100%, but this can be edited via the Advanced Menu. Remember, the LPP indicates to the software how much the Event impact affects the local Region and should therefore be applied to the Multipliers. If the LPP is set to anything less than 100%, you won’t see your inputs match the Results. Learn more in the article Local Purchase Percentage (LPP) & Regional Purchase Coefficients (RPC).
COMMODITY MARKET SHARE
The portion of Commodity supply coming from each source for a given Commodity is called a Market Share. If you are analyzing Commodities, some of the Market Share can come from Institutional Sales (like out of inventory or produced by the government). When LPP is less than 100%, the remaining portion (or 1-LPP) is then assumed to be affecting a different Region. The portion happening outside the Region of your analysis does not create any local effect.
Because Commodity Market Shares allocated to Institutions will be treated as leakages, these portions of Commodity Output will not be included in the Direct Effect of the Results. Check out where to find the Market Shares in the article on Social Accounts.
COMMODITY EVENTS AND DEFLATORS/INFLATORS
When a Commodity Event is run with the same Dollar Year and Data Year and the Results are viewed in that same Dollar Year, the Direct Effect will match the Direct Commodity input. However, when the Dollar Year on the Impacts screen or the Dollar Year on the Results screen do not match the Data Year, the Direct Effect will be slightly different than the Direct inputs. This is because the Commodity Event is adjusted using Commodity deflators/inflators and then those dollars are deflated/inflated on the Results using Industry deflators/inflators. The slight difference in the Results you see in the Direct Effect is due to the differences between Commodity and Industry deflators/inflators.
https://implan.com/wp-content/uploads/Market-site-Logo-resized-2-1.jpg00Joe Demskihttps://implan.com/wp-content/uploads/Market-site-Logo-resized-2-1.jpgJoe Demski2020-08-12 11:02:282020-08-12 11:02:28Why don’t my Direct Effects match my Direct inputs?
Combining Regions in IMPLAN allows you to create Regions of grouped geographies to analyze. The great part is once you create a Combined Region, it will always be available for you to use.
DETAILS
You can create a custom Combined Region in IMPLAN with just a few simple clicks. From the Regions screen, select all of the Regions you want to combine. Click the Menu Button in the Selected Regions field.
A popup will appear asking you to name your new Combined Region. Remember to give it a name that makes sense as this will now be searchable in from your Regions or Impacts screen.
IMPLAN is now building your Combined Region. You will know it is complete when the teal icon appears next to the i as shown below.
You can now proceed with your analysis by clicking Create Impact in the bottom right corner of your screen.
HINTS
You can always start a new Project using this Combined Region by searching for the title you gave it on the Regions screen.
Note that there is a limit of 200 geographies in Combined Regions.
MRIO
Combining Regions is very useful when you are using MRIO. For example, you may want to compare your county to the remainder of the state. To ensure that your Project runs efficiently, you can create a Combined Region for all of the other counties in your state. You can then MRIO your county to the Combined Region of the remaining counties. So instead of having to use MRIO with Brewster County, TX and the other 253 counties, you can use MRIO with Brewster County and a Combined Region of the 253 other Texas counties.
https://implan.com/wp-content/uploads/Market-site-Logo-resized-2-1.jpg00Joe Demskihttps://implan.com/wp-content/uploads/Market-site-Logo-resized-2-1.jpgJoe Demski2020-08-12 10:18:552020-08-12 10:18:55Combining Regions
The table below clarifies the underlying level of detail of all line items in an IMPLAN tax impact report. In principle, the tax impact report captures all tax revenue in the study area across all levels of government that exist in that study area for the specific industries and institutions affected by an event or group of events. The underlying data that support the tax impact report, however, do not embody that much detail.
For example, IMPLAN does not have systematic reports of state government tax revenue by county; IMPLAN has same-year state government tax revenue by state and must allocate that to counties based on proxy information (we do have county-level data for some states, and use this to build a model for the allocation process). Also, IMPLAN obtains detailed TOPI data by geography (even for each city within a county), but does not have any industry detail about the specific TOPI line item. A third note: for the data by city, we often must aggregate that to the county level, so that a model of two cities in the same county will have the same implied effective tax rates. In other words, city-specific data will be used, but averaged across all cities within a county.
Please note that all line items are controlled to nationwide, current-year controls estimated by the Bureau of Economic Analysis (BEA) in the National Income and Product Accounts (NIPAs) with no industry resolution and two level-of-government distinctions, Federal and State & Local. For example, the NIPAs might give a value of $15 billion in State & Local income tax in 2017, which would be reflected in the 2017 IMPLAN data.
Industrial and geographic resolution are reported at their maxima and nest more aggregate levels. For example, if IMPLAN has raw data on property tax at the county level, that implies we also have state-level data.
Timeliness lags are reported vis-à-vis the dataset year. For example, a 1 year lag for 2017 IMPLAN data means that the underlying data have a reference year of 2016. Timeliness is especially relevant for knowing whether changes in tax laws or economic conditions are reflected in the IMPLAN dataset.
The table below does not report the combined State & Local level of government, since (other than nationally in the NIPAs as explained above) IMPLAN does not collect any data at this level; it’s simply an aggregate for legacy and convenience purposes.
Level of Government
Tax Impact Item
Maximum Industry Resolution of Underlying Data
Maximum Geographic Resolution of Underlying Data
Timeliness of Underlying Data
City/Special District
TOPI: Property Tax
TOPI aggregate at BEA sectoring (approximately 80 sectors).
TOPI detail has no industry resolution.
County level
1-2 years lag
City/Special District
TOPI: Motor Vehicle License
TOPI aggregate at BEA sectoring (approximately 80 sectors).
TOPI detail has no industry resolution.
County level
1-2 years lag
City/Special District
TOPI: Severance Tax
TOPI aggregate at BEA sectoring (approximately 80 sectors).
TOPI detail has no industry resolution.
County level
1-2 years lag
City/Special District
TOPI: Other Taxes
TOPI aggregate at BEA sectoring (approximately 80 sectors).
TOPI detail has no industry resolution.
County level
1-2 years lag
City/Special District
TOPI: Special Assessments
TOPI aggregate at BEA sectoring (approximately 80 sectors).
TOPI detail has no industry resolution.
County level
1-2 years lag
City/Special District
Personal Tax: Income Tax
n/a
County level
1-2 years lag
City/Special District
Corporate Profits Tax
None
County level
1-2 years lag
City/Special District
Personal Tax: Motor Vehicle License
n/a
County level
1-2 years lag
City/Special District
Personal Tax: Property Tax
n/a
County level
1-2 years lag
City/Special District
Personal Tax: Other Tax
n/a
County level
1-2 years lag
County
TOPI: Property Tax
TOPI aggregate at BEA sectoring (approximately 80 sectors).
TOPI detail has no industry resolution.
County level
1-2 years lag
County
TOPI: Motor Vehicle License
TOPI aggregate at BEA sectoring (approximately 80 sectors).
TOPI detail has no industry resolution.
County level
1-2 years lag
County
TOPI: Severance Tax
TOPI aggregate at BEA sectoring (approximately 80 sectors).
TOPI detail has no industry resolution.
County level
1-2 years lag
County
TOPI: Other Taxes
TOPI aggregate at BEA sectoring (approximately 80 sectors).
TOPI detail has no industry resolution.
County level
1-2 years lag
County
TOPI: Special Assessments
TOPI aggregate at BEA sectoring (approximately 80 sectors).
TOPI detail has no industry resolution.
County level
1-2 years lag
County
Personal Tax: Income Tax
n/a
County level
1-2 years lag
County
Corporate Profits Tax
None
County level
1-2 years lag
County
Personal Tax: Motor Vehicle License
n/a
County level
1-2 years lag
County
Personal Tax: Property Tax
n/a
County level
1-2 years lag
County
Personal Tax: Other Tax
n/a
County level
1-2 years lag
State
TOPI: Property Tax
TOPI aggregate at BEA sectoring (approximately 80 sectors).
TOPI detail has no industry resolution.
State level
0 years lag
State
TOPI: Motor Vehicle License
TOPI aggregate at BEA sectoring (approximately 80 sectors).
TOPI detail has no industry resolution.
State level
0 years lag
State
TOPI: Severance Tax
TOPI aggregate at BEA sectoring (approximately 80 sectors).
TOPI detail has no industry resolution.
State level
0 years lag
State
TOPI: Other Taxes
TOPI aggregate at BEA sectoring (approximately 80 sectors).
TOPI detail has no industry resolution.
State level
0 years lag
State
TOPI: Special Assessments
TOPI aggregate at BEA sectoring (approximately 80 sectors).
TOPI detail has no industry resolution.
State level
0 years lag
State
Personal Tax: Income Tax
n/a
State level
0 years lag
State
Corporate Profits Tax
None
State level
0 years lag
State
Personal Tax: Motor Vehicle License
n/a
State level
0 years lag
State
Personal Tax: Property Tax
n/a
State level
0 years lag
State
Personal Tax: Other Tax
n/a
State level
0 years lag
Federal
Social Insurance Tax- Employee Contribution
None
State level
0 years lag
Federal
Social Insurance Tax- Employer Contribution
None
State level
0 years lag
Federal
TOPI: Excise Taxes
TOPI aggregate at BEA sectoring (approximately 80 sectors).
TOPI detail has no industry resolution.
National level
0 years lag
Federal
TOPI: Custom Duty
TOPI aggregate at BEA sectoring (approximately 80 sectors).
TOPI detail has no industry resolution.
National level
0 years lag
Federal
Corporate Profits Tax
None
National level
0 years lag
Federal
Personal Tax: Income Tax
n/a
National level
0 years lag
Federal
Personal Tax: Estate and Gift Tax
n/a
n/a
n/a
METHODOLOGY:
Initially, the estimation of value added by sector and taxes by level of government proceed independently.
Taxes by level of government are obtained by combining data from the Annual Survey of State and Local Government Finances, which usually is lagged a year or two with respect to the IMPLAN data reference year, the most recent state government tax collections (also reported by the Census Bureau), and the most recent Census of Government Finance, which is like the Annual Survey, but covers every single unit of government. Those sources report tax by type, by unit of government (ergo by level of government), and by location. State government revenue is assigned only at the state level (i.e., the data do not tell us how much state income tax came from a given county). Federal government revenue is known only at the national level from the National Income and Product Accounts.
Data for county, city, and special district governments are assigned to the counties containing those units of government. Data for state and federal government revenue are allocated to counties based on proxies (e.g., personal income by county is used to allocate state government personal income tax revenue to counties). We have national level controls for taxes by level of government and type of tax from the National Income and Product Accounts. We first distribute taxes to states using a combination of the combined finances data and data on total taxes by state (covering both state and local governments) from the BEA’s Regional Economic Accounts. We then distribute those state values to counties based on the combined finances data, where possible, and by proxies where not possible.
The only industry-level detail we have for taxes is for TOPI, and it is for the entirety of TOPI, not the components of TOPI (e.g., sales tax, property tax, etc.). The components are only place- and level-of-government specific, not industry-specific.
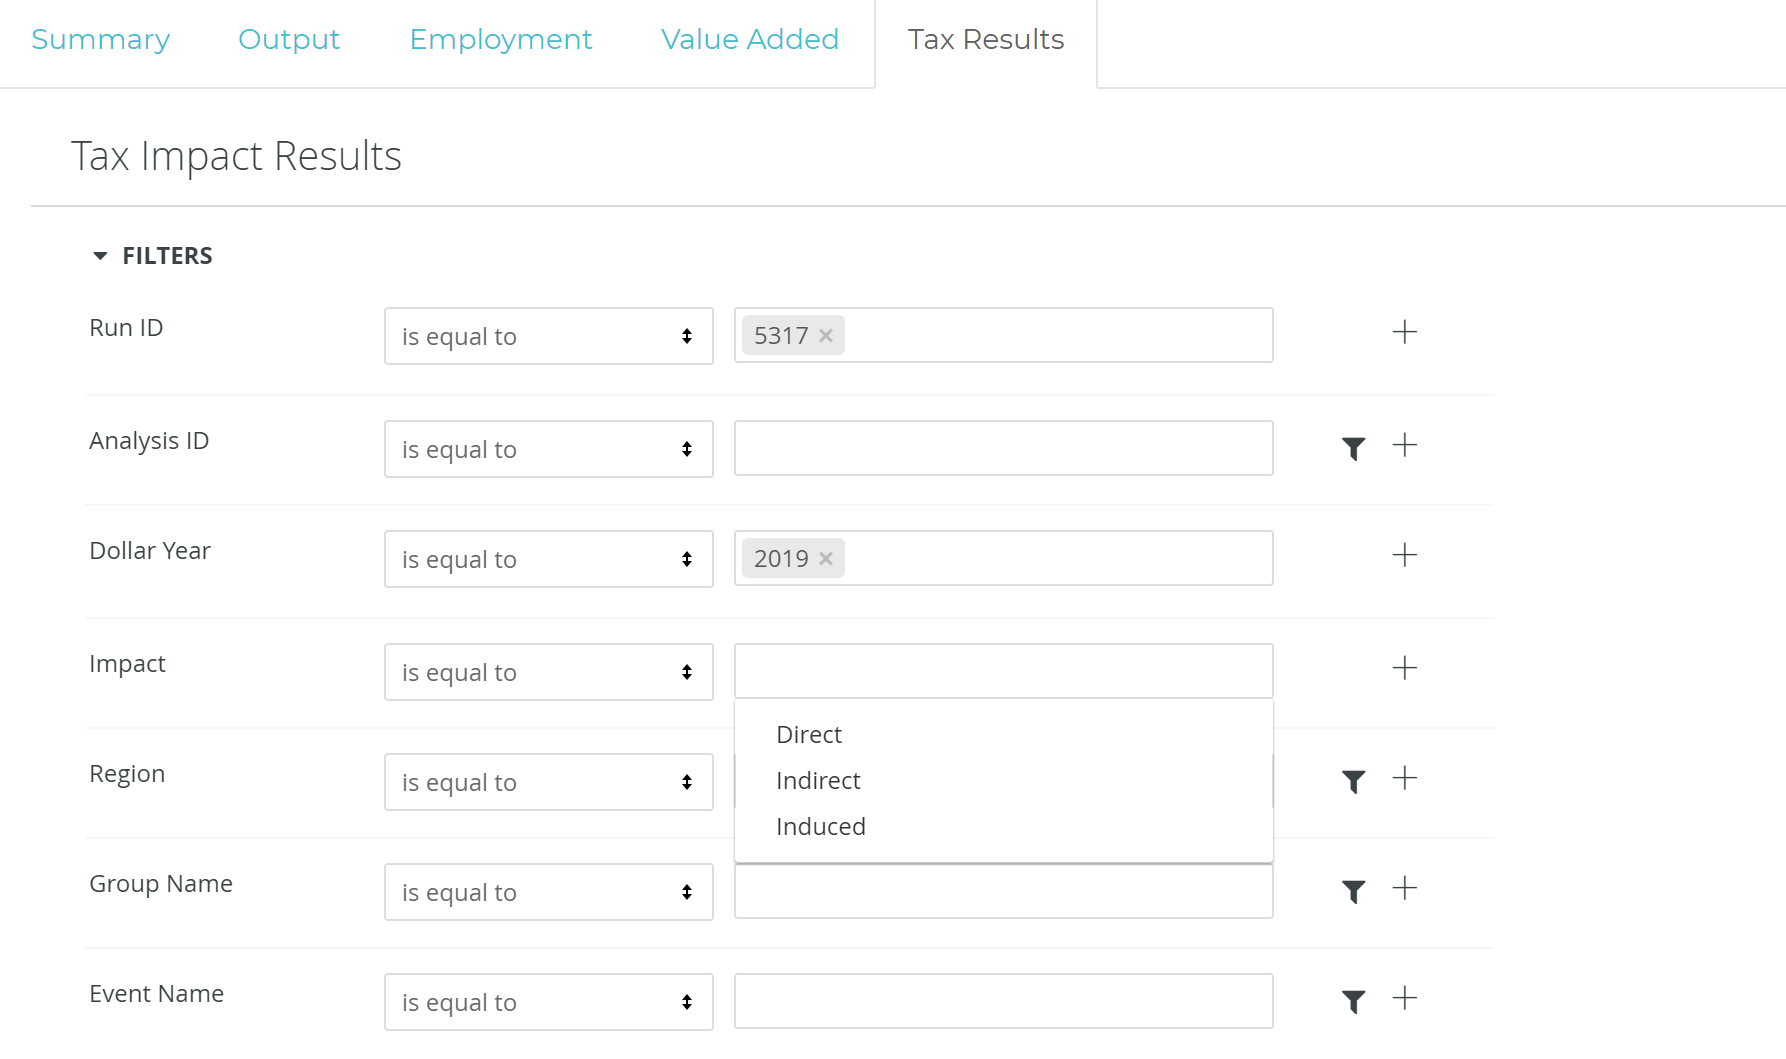
FILTERING:
To filter by Direct, Indirect, and Induced taxes in IMPLAN, simply open the Filter window and click into the “Impact” Filter. This will provide you the option of “Direct”, “Indirect”, “Induced”. Making a selection and clicking “Run” will apply the filter and only show the Tax Results as specified. if no selection is made, you are viewing total Tax Results.
Generation and Interpretation of IMPLAN’s Tax Impact Report
https://implan.com/wp-content/uploads/Market-site-Logo-resized-2-1.jpg00Joe Demskihttps://implan.com/wp-content/uploads/Market-site-Logo-resized-2-1.jpgJoe Demski2020-08-12 10:14:372020-08-12 10:14:37Generation and Interpretation of IMPLAN’s Tax Impact Report
Your answers to the questions you should ask yourself when preparing your analysis: Who, What, Where, When and Why can range in level of detail widely. The more information you bring to IMPLAN, the more detailed your analysis can be defined. IMPLAN is based on Input-Output Analysis which quantifies the secondary demands supported across industries within a given Regional economy due to some primary economic effect. The primary, initial change or effect is entered into IMPLAN using Events by the analyst, you! Therefore you need some information about the level of production, spending, or income/revenue generated from the economic Event you are analyzing.
This article specifically speaks to defining the What element of your analysis, which corresponds to your Event Values and other Event Settings when entering your analysis into the application.
The “What” element of your analysis simply refers to the quantified size of the economic Event you are analyzing. Who answers the Industry, Commodity, Institution or Income type responsible for the initial effect being analyzed.
The more data brought into the application from outside of IMPLAN the more IMPLAN data points and averages are being replaced with the analyst’s known values or assumptions. More specificity is added to the analysis when more data is known about the effect and is incorporated in the setup of the analysis in the application. Doing so takes time, effort and attention to detail to prevent any unintended errors. Taking the time to add extra specificity to your analysis is recommended when the data to do so is available and that data is reliable, the “Who” of your analysis spends differently than the norm for this actor in the economy or how IMPLAN says they do, or the details of your analysis will be heavily criticized by your audience.
INDUSTRY CONTRIBUTION ANALYSIS
Industry Contribution Analysis (ICA) is appropriate when you’d like to estimate how existing production supports demand to other Industries in the economy. As a rule of thumb, we recommend using ICA especially when the existing production you are analyzing makes up more than half of its Industry. ICA allows you to quantify the extent to which that Industry is connected to the Regional economy and on the other side what an economy stands to lose in the hypothetical scenario that the Industry leaves the Region.
ICA Events in IMPLAN differ from other Event Types, used to analyze Impacts, as they restrict any purchases back to the Industry such that the Indirect and Induced Effects for the specified Industry will always be zero in the Results.
The Event Value of an ICA Event can either be an Output ($) or a percentage (%) of the Output in the Industry according to the Region Details behind the “i” in the Study Area Data. No other data points can be used in ICA. If you’d like to estimate the contribution of an Industry based on an Employment number, you’ll need to first convert the value to Output using the data in:
Study Area Data
> Industry Summary
Find the row for the Industry you are analyzing and find the intersecting column for Output per Worker. Multiply your number of employees by Output per Worker for the given Industry.
CONTRIBUTIONS: USING IMPLAN DATA
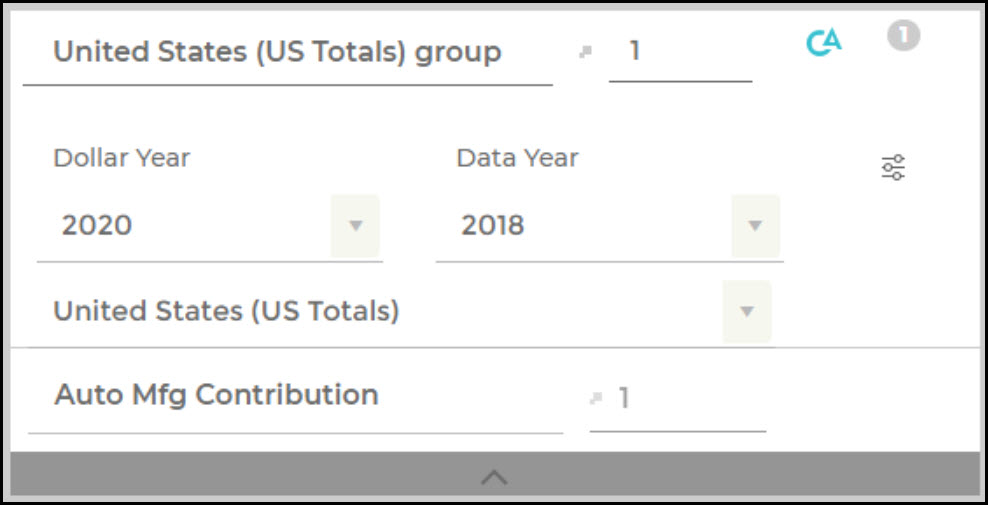
Using 100% as the Event Value in an Industry Contribution Analysis is the one situation in which you don’t need to bring your own value to IMPLAN.
For example, above is an ICA Event setup to analyze the effect of 100% of the Automobile manufacturing Industry. The value of the 100% depends on the Region and Data Year of the Group in which this Event is analyzed.
Dragging and dropping the Event into a Group with Region: United States, Data Year: 2018 will analyze the effect of the entire Automobile Manufacturing Industry in 2018 across the whole country. Dollar Year is ignored when using a percentage as the Value. Because the analysis will use the Region Details data, the Value analyzed will always be in the same Dollar Year as the Data Year. You can choose what Dollar Year to report in by using the Dollar Year Filter in the Results.
CONTRIBUTIONS: USING YOUR OWN % OR OUTPUT VALUE
You may want to analyze the contribution of just a segment of an IMPLAN Industry. For example, in 2018, the Output of the U.S. Automobile Manufacturing Industry was $217,100,880,875.11. If the specific manufacturer you want to analyze produced $115B worth of cars in 2018, or about 53% of the value of all cars produced in 2018, I could either us $1115B or 53% as the Event Value.
IMPACT ANALYSIS
The most common types of Impacts analyzed in IMPLAN are:
New construction
New business operations
New final demand spending:
Tourism/Visitors
Population growth
Fiscal spending policy changes
When there is new activity (such as the possible impacts above) in an economy due to a change in demand, there are additional secondary demands that ripple throughout the Region’s economy. These secondary demands stem from impacted Industry’s need for inputs. The chain of transactions that are supported by the impact in the Region are quantified by IMPLAN as Indirect and and Induced Effects. Unlike in ICA, the specified Industry can experience Indirect and Induced Effects.
To analyze some new activity, remeber you need to identify in IMPLAN Where and When the Impact occurs by defining the Region, Data Year and Dollar Year. Each of these indicators are captured in a Group. Events specify the economic transactions occurring in the local economy in terms of Type, Specification, and Value. The Who and What of the new activity should be captured by the Event Specification and Value. The Who and What of the economic transaction are paired with Where and When by dragging and dropping an Event into a Group.
For standard Industry Events, the Event Specification can be defined as the IMPLAN Industry impacted by the initial change. There are four different Industry Event Types: Industry Output, Industry Employment, Industry Employee Compensation, Industry Proprietor Income. Choosing between these Event Types should be based on the known Event Value. In some cases, information about new activity may not be known from a production standpoint, but rather from a consumption standpoint. The Industry vs. Commodity Output article provides a questionnaire to help guide you to the appropriate approach for analyzing your data.
IMPACTS: SINGLE VALUE
For construction impacts its common to only know total cost of construction, for operations impacts its common to only known number employees and for new final demand spending, total spend (by Industry or Commodity) is typically all that is known. To analyze any impact, you need to know, at least, either Output, Employment, Total Employee Compensation or Total Proprietor Income.
Output is equal to the total value of production. Industry Output in IMPLAN is the value of the Industry’s production, including production that is added to inventory, in the given Data Year. Commodity Output in IMPLAN is the value of the total supply of the Commodity, including from inventory, in the given Data Year. Output is equivalent to the Producer Price of a good or service.
Employment in IMPLAN follows the same definition as Bureau of Economic Analysis Regional Economic Accounts (BEA REA) and Bureau of Labor Statistics Quarterly Census of Employment and Wages (BLS QCEW) data, which is full-time/part-time annual average. Thus, it adjusts for seasonality, but does not indicate the number of hours worked per day. Thus, if you have a full-time equivalent (FTE) value you will want to first convert the FTE value to IMPLAN employment prior to using it as an Event Value IMPLAN. Conversely, if you need to report FTEs you will want to convert the IMPLAN employment to reflect those. FTE and wage and salary to Employment Compensation conversions can be found in the article “546 Industries, Conversions, Bridges, & Construction – 2018 Data.”
Employee Compensation is the total payroll cost of the wage and salary employee paid by the employer. This includes wage and salary, all benefits (e.g., health, retirement), and payroll taxes (both sides of social security, unemployment taxes, etc.). IMPLAN also provides a conversion between Employee Compensation and Wage and Salary data in the article “546 Industries, Conversions, Bridges, & Construction – 2018 Data.”
Proprietor Income is the current-production income of sole proprietorships, partnerships, and tax-exempt cooperatives. Excludes dividends, monetary interest received by nonfinancial business, and rental income received by persons not primarily engaged in the real estate business (BEA).
Typically, information about retail and wholesale Industry impacts are in the form of consumer spending, whether the consumer is a business or household. As discussed in the Output section, Output is in Producer Prices. Therefore when you enter Total Revenue into an Retail or Wholesale Industry Event, IMPLAN calculates the Marginal Revenue, a portion of Total Revenue to the specified Industry as the Direct Effect. Read on in the linked articles to learn more about Industry Margins and Commodity Margins.
IMPACTS: MULTI-VALUE
When only one Event Value is provided, IMPLAN estimates all effects based on this one number and the Industry’s average Leontief Production Function. If more than one Event Value is known it is always best to use this known information as opposed to IMPLAN’s estimate to reflect the more unique characteristics of what you are analyzing.
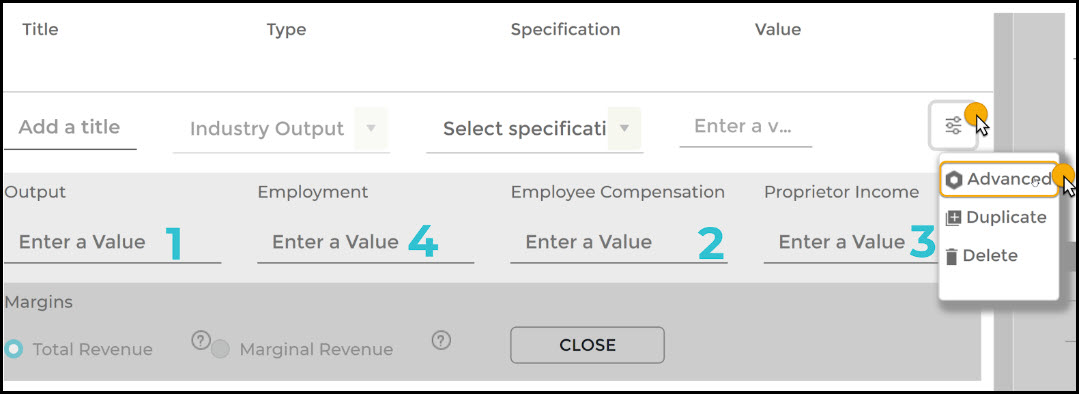
When multiple Event Values are provided in an Industry Event via the Advanced Menu fields shown below, Output will be determined by the Event Values in the following priority, regardless of the selected Event Type:
Output
Employee Compensation
Proprietor Income
Employment
All secondary Event Values will be a customization to IMPLAN’s estimation for the Event Value.
Other data adjustments can be applied to standard Industry Events for some further customization.
IMPACTS: DOING MORE WITH ABP
Do you have more information beyond the values that can be entered in an Industry Event: Output, Employment, Employee Compensation and Proprietor Income? Analysis-by-Parts or ABP is a technique for that allows you to define the spending associated with Industry as you’d like, giving the option to:
Specify the purchase amount of all Intermediate Inputs (all commodities purchased from operating the businesses)
Specify the Local Purchase Percentage of all Intermediate Inputs
Adjust allocations of Output to TOPI and OPI (essentially tax and profit)
https://implan.com/wp-content/uploads/Market-site-Logo-resized-2-1.jpg00Joe Demskihttps://implan.com/wp-content/uploads/Market-site-Logo-resized-2-1.jpgJoe Demski2020-08-12 10:13:142020-08-12 10:13:14What Kind of Data Can I Bring to IMPLAN?
Owner-occupied dwellings is a Special Sector developed by the BEA to ensure consistency in the flow of funds.
Owner-occupied dwellings is necessary to include as an Industry in IMPLAN because home-ownership generates wealth (the home can be rented out to others or saves the owner from having to pay rent); the Value Added portion of this Industry is counted as part of GDP along with the Value Added of every other Industry in the country. Owning and maintaining a home is also a major area of spending for homeowners; this Industry captures the economic effect.
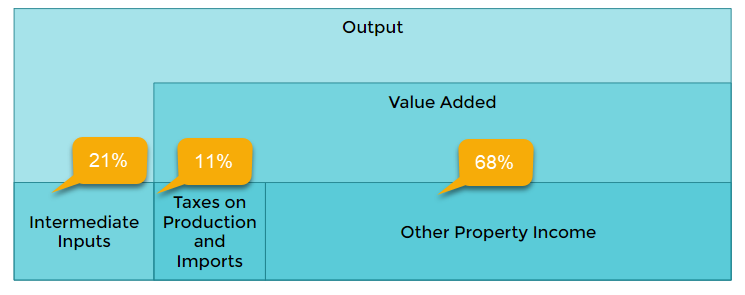
The Owner-occupied dwelling Industry Production Function only contains:
Taxes on Production and Imports (TOPI) = largely made up of Property Tax
Other Property Income (OPI) = difference between the rental value of the home and the non-mortgage costs of home ownership (Output – Intermediate Inputs – TOPI); Mortgage Interest is included in OPI
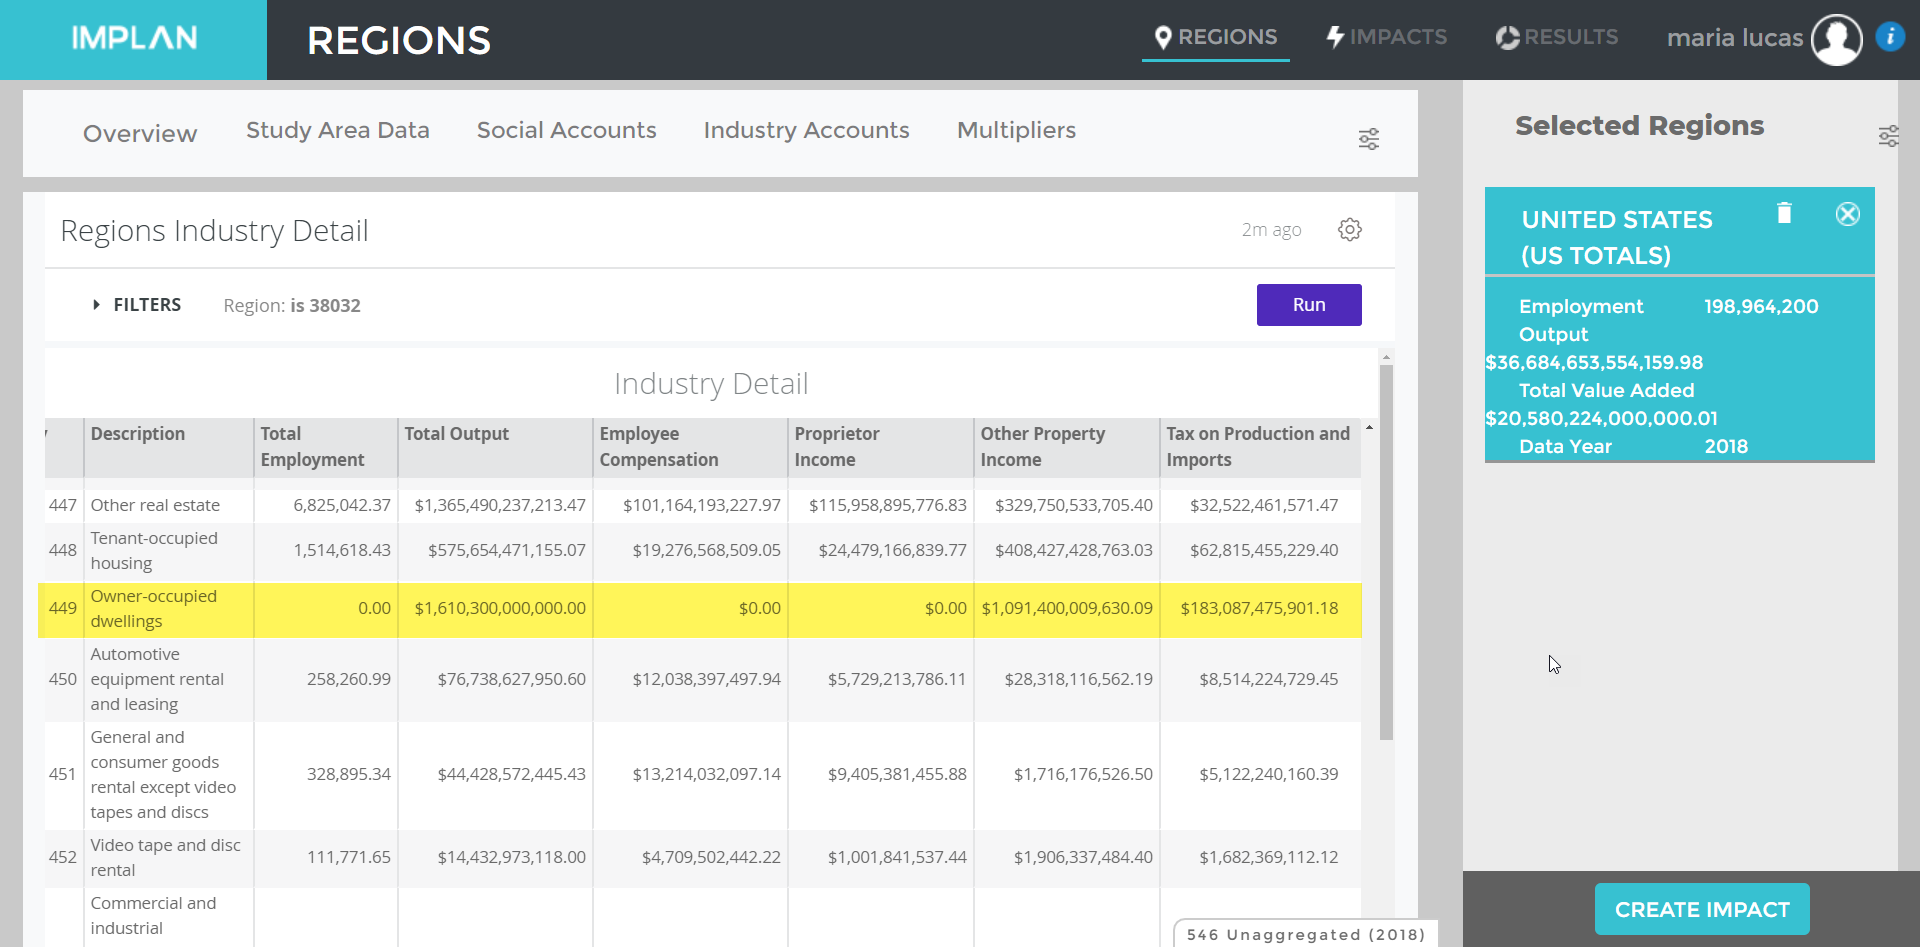
Here’s the Industry Detail for the U.S. 2018 Economy:
Note there is no Employment or Labor Income generated in this Industry. Below, the components of production have been converted to percentages of Output for the Industry as a whole in the U.S. 2018 Economy:
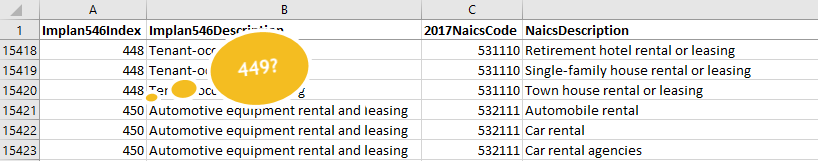
Notice in the screenshot below, Industry 449 does not exist in the NAICS Bridge (546 Industry Scheme) because the industry does not correspond to a NAICS Code. NAICS Codes are used to classify business establishments. The Owner-occupied dwellings Industry is not a business establishment and therefore does not have a NAICS Code.
The owner-occupied dwelling Industry is different from the other two real estate related Industries in IMPLAN; Industry 448 Tenant-occupied housing and Industry 447 Other Real estate.
Tenant-occupied housing (448) includes the value of operations for lessors of residential rentals.
Other Real estate (447) includes the value of operations for residential property managers, lessors of nonresidential buildings, and offices of real estate agents and brokers (offering services other than residential leasing).
Owner-occupied dwelling and Tenant-occupied housing are the number one and three Industries (in the U.S. 2018 Economy) in terms of Total Household Demand. Logically this seems very appropriate as they respectively represent the value of home-ownership and home renting/leasing.
RENT PAYMENT IMPACTS
The economic effect of rent payments associated with some Event is accounted for in the Induced Effects in the Results of the given Event when analyzed in IMPLAN.
If you’d like to directly analyze rent payments (made to a leasing establishment as opposed to a home-owner), the total value of rent payments can be analyzed via an Industry Output Event in the Industry 448 – Tenant-occupied housing. When analyzing this Industry, the necessary service of renting out the property via a property manager will be captured as an Indirect Effect to IMPLAN Industry 447 – Other real estate. This is because property management service is an Intermediate Input that Tenant-occupied housing purchases from Other real estate.
HOME OWNERSHIP IMPACTS
The economic effect of home-ownership costs associated with some Event is accounted for in the Induced Effects estimated in the Results of the given Event when analyzed in IMPLAN.
MORTGAGE PAYMENTS ARE NOT INCLUDED IN ANY INDUSTRY
The exchange of cash for principal is essentially an asset swap. Input-Output models do not account for existing assets – only annual change (e.g., net savings, new construction, equipment purchases). This means mortgage payments are an asset swap and are not part of the current accounts, and are therefore not included in any Industry. An Industry’s production function only includes current accounts; it does not include investment.
Households make a payment to the capital institution in IMPLAN. This payment is accounted for when analyzing Household Income Events. The payment is net savings, which includes paying down debt (i.e., principle). Mortgage payments are included in this payment to capital by Households.
HOMEOWNERS RENTING OUT THEIR HOME
When a homeowner rents out their home, either to a vacationer or a resident, the income they earn is often used to pay their mortgage and maintain the home. The surplus income they earn can be spent in a variety of ways.
Rent income earned by a homeowner can be analyzed via a Household Income Event. The Event Value should not include any fees for the paid service of property management. This approach assumes the homeowner will distribute the income like any other income earned. As mentioned in the previous section, Household Income Events accounts for the Household Income groups average net savings (net payments to capital). The portion of total Household Income for the income group that is allocated to net savings in the Region and Data Year is assumed to be the portion of every dollar entered in a Household Income Event that will be allocated to net savings. Because the capital institution in IMPLAN is not internalized in the Multipliers, there will be no effect in the Results from income allocated to capital. In other words, IMPLAN does not assume how capital payments will be spent, so these payments are treated as leakage. Another portion, accounting for income taxes, is also treated as a leakage.
The remaining Household Income is distributed across the average makeup of Commodities purchased by the given income group. Commodities purchased with this Household Income that are produced by Industries within the Region generate Induced Effects.
The allocation of Household Income includes a payment to IMPLAN Industry 449 – Owner-occupied dwellings which represents the value of the house as if it was rented. Owner-occupied dwellings pay for repair and maintenance services, real estate fees, and bank financing fees (such as refinancing a mortgage). These payments generate the iterations of Induced Effects from owning, repairing, and maintaining the home. Owner-occupied dwellings also pay taxes (largely property taxes). Once again, tax revenue is treated as a leakage. The residual going to Other Property Income is considered “imputed income” for households and includes mortgage interest. OPI is another leakage in IMPLAN.
Analyzing rent income to a homeowner via a Household Income Event is not perfect because the allocation of Household Income, after accounting for leakages, is an average for all households in that income group, not just the homeowners. Because spending by households that do pay rent are included in these averages, Tenant-occupied housing will also receive a payment.
BUYING AND SELLING A HOME
The cost associated with buying a constructed home is included in the cost of owning a home. The net income gained when a home is sold can be analyzed only if where, when, and on what the income will be spent is known. If the seller of the home uses the income to buy another house in the Region you may have real estate and financing fees for the new mortgage that can be analyzed accordingly. If the seller of the home is moving out of the Region, which is often the case, there is no impact to the Selected Region.
BUILDING A HOME
Constructing a new home does of course create an impact due to the need for materials and labor. The cost of constructing a home can be analyzed via an Industry Output Event in the Construction of new single-family residential structures Industry. More information on considerations when analyzing construction are found in the article Construction: Building the Analysis.
QUANTIFYING HOMEOWNERS’ PROPERTY TAX
TOTAL REGIONAL HOMEOWNERS’ PROPERTY TAX
The Taxes on Production and Imports (TOPI) for IMPLAN Industry 449 – Owner-occupied dwellings is made up largely of property taxes, therefore you can identify the total property taxes paid on homes as approximately the value of TOPI for IMPLAN Industry 449 – Owner-occupied dwellings. This value can be found in the Region Details: Behind the i in
Study Area Data
> Industry Detail (shown for U.S. in screenshot above)
> Find the row for the Owner-occupied dwellings Industry and the intersecting column for TOPI.
HOMEOWNER PROPERTY TAX EFFECTS
The ratio of total TOPI to total Output in a given Region for a given Industry is called the TOPI coefficient. This coefficient can be found Behind the i in
Social Accounts
> Balance Sheets
> Industry Balance Sheet
> Value Added tab
> Filter by Owner-occupied dwellings Industry, find the TOPI coefficient.
The TOPI coefficient for IMPLAN Industry 449 – Owner-occupied dwellings can be multiplied by the value of Owner-occupied dwelling Output generated in your IMPLAN Results to calculate the associated approximate value of Property Taxes paid by homeowners on their homes.
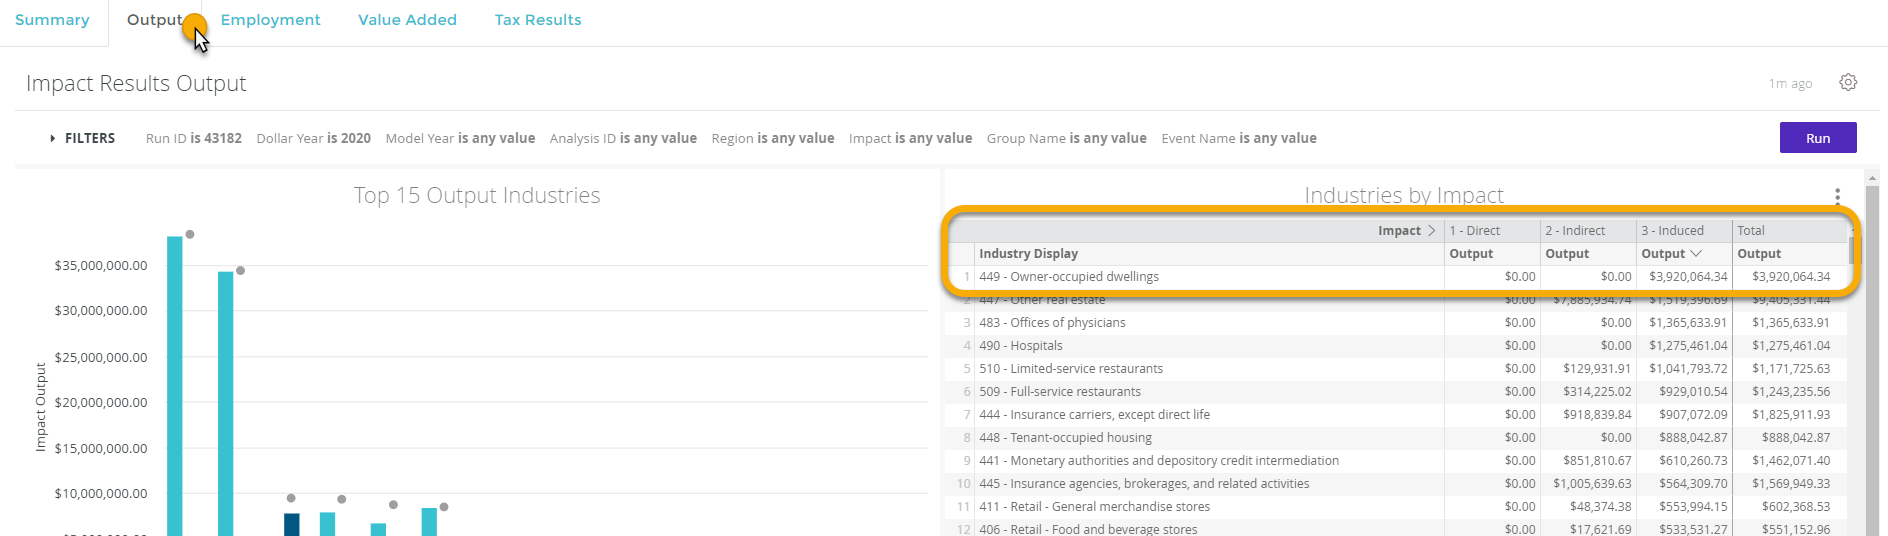
You can find the Owner-occupied dwelling Output effects generated in your IMPLAN Results by navigating to the Output tab of your Results. Find the Owner-occupied dwelling row in the Industries by Impact table (sort by Induced Effects). Here you’ll see the Output Effects to the industry. Unless you analyzed an Event in the Owner-occupied dwelling Industry, you will only see Induced Output to this Industry.
https://implan.com/wp-content/uploads/Market-site-Logo-resized-2-1.jpg00Joe Demskihttps://implan.com/wp-content/uploads/Market-site-Logo-resized-2-1.jpgJoe Demski2020-08-12 10:09:042020-08-12 10:09:04Housing: Owning, Buying, Selling and Renting
COVID-19 has the world turned upside down. IMPLAN is no different as we have moved to working remotely instead of heading into the office. As the leader in economic impact modeling data and software, we are being continually asked how to model the economic impacts of COVID-19. Unfortunately, the answer isn’t easy, and with things changing so quickly, it won’t fully be known until the pandemic is under control. No model can predict all of the wide-ranging, short- and long-term impacts of such a far-reaching phenomenon as the COVID-19 pandemic, but here are some ways you can examine what is happening in the U.S. and your community.
LOSSES
PRODUCTION & JOBS
The losses could be so great that Treasury Secretary Steven Mnuchin noted unemployment could reach 20%; impacting 32 million Americans. This scenario could be run by aggregating Industries in a national IMPLAN model and analyzing a 20% reduction across all industries. Some consideration around which Industries will be most heavily affected can also be used to pinpoint employment loss across more specific Industries.
One could also take a more industry- or region-specific approach. Many businesses are forced to make difficult decisions about how to proceed. Service industry firms are being forced to cut back and lay off workers, some even closing due to decreased demand and mandatory closures. These types of activities are easily analyzed in IMPLAN and data is readily available. For example, you can model the wider economic impacts of the loss of 100 jobs to an event planning company with Industry 500 (Promoters of performing arts and sports and agents for public figures). You could also look at how IMPLAN analyzed losses to the airline industry. The Census has some great detail by 2-digit NAICS from the Small Business Pulse Survey Data.
Something to consider, however, is net analysis. While all of our favorite restaurants are closed, we are still eating, so there will likely be an uptick for grocery store sales. Domestic food manufacturing firms may experience no change. On the other hand, they may see increases as specialty imported foods are not currently available. While food consumption rates may remain the same, the shift from restaurant expenditures to grocery store expenditures will likely not be a one-for-one substitution in terms of economic activity, due to differing wage rates and input patterns in each of these distinct industries. Such positive and negative impacts can be modeled in IMPLAN to get a sense of the overall net impact and the other industries affected indirectly.
HOUSEHOLDS
Standard household purchasing patterns are obviously being interrupted. Many families rely on employment in the service industry to make ends meet. Although some companies are offering assistance like free internet access and HUD is postponing evictions, wallets will still likely be strained. In IMPLAN, you can examine what a decrease in household spending, most likely for those at the lower ends of the earning spectrum, would look like by analyzing a decrease via a Household Income Event.
In some cases, the occurrence of economic activity may just be temporarily disrupted. If our travel plans for an Orlando vacation in March were canceled, we may just wait to take our trip until the fall. In that case, the spending from a household perspective would be the same in 2020. If we purchase an abundance of toilet paper now, we won’t need to purchase it later in the summer; just as in the case of our travel expenditures, our total 2020 expenditures on toilet paper would remain the same. COVID-19 isn’t likely to increase a household’s demand for toilet paper over the long term despite short term buying frenzies. So be careful what assumptions you make to ensure that they will be true changes to the economy.
It is also important to note that a decrease in household spending associated with job losses is already covered in the Industry analyses discussed in the previous section and should not be modeled separately. Also, just like with Industry impacts, net analysis should be performed where possible. For instance, if households receive a payment from the government, as is currently being considered, that may offset some of the losses to household spending, and may also result in an offsetting reduction in government spending on other government programs.
INTERNATIONAL DEMAND
There are obvious effects happening in domestic markets, but what about all of the shipments that U.S. firms make abroad? Many ports and borders are closed which will obviously hurt some businesses that rely on international purchasing.
For example, in 2018 the U.S. exported $17 billion in soybeans. For the past 5 years, China has been the largest buyer of U.S. soybeans. The potential economy-wide economic impact of a loss of $3B in soybean exports to China alone is $8 billion. Because exports make up such a large majority of soybean sales, looking at the international purchasing from the Census and running changes is best analyzed with an Industry Contribution Analysis Event.
GAINS
PRODUCTION & JOBS
Not all the news is bad for the national economy, however. Many domestic suppliers are ramping up their production to meet increasing and new demand. Amazon is hiring an additional 100,000 warehouse and delivery workers. In IMPLAN, this is simply a new employment impact.
What some are calling “panic buying” has forced one toilet paper manufacturer to increase shipments by 20%. While these changes aren’t likely to remain in the long run, they do offer some short run positive benefits. In IMPLAN, increases in toilet paper production can be analyzed by increasing Output in these industries.
SUPPLY CHAIN
Retailers are already feeling the strain of the interruption in the global supply chain. They worry about being able to get products for the upcoming back-to-school and even holiday seasons. This could mean that there are fewer items on store shelves for consumers to purchase and thus shopping will be delayed until later in the year. There might be potential here for import substitution and an increase in purchases of items made in America. These can be modeled by Industry Output Events in IMPLAN.
Manufacturers may not be able to get inputs from foreign ports, which can delay or stop their production. This may encourage them to look for domestic suppliers, which can help them in the short term and help the U.S. economy in the long term if the relationship is successful. Losses to one industry due to decreased production or gains to another industry that might see new demand are modeled through changes to Output in a standard Industry Event.
ENVIRONMENTAL IMPACTS
The environment has become a discussion point online as cities are shutting down for quarantine and unusual natural sights are observed. Scientists are also looking at the potential environmental impacts of COVID-19. Dr. Marshall Burke of Stanford is looking at the reduction in emissions in China and relating that to potential positive health outcomes. IMPLAN has environmental data with Industry-specific coefficients of physical emissions per dollar of Output. Analysts can use these ratios with results from the IMPLAN modeling system in order to gain insight into the environmental impacts associated with COVID-19. By doing this, we can see the environmental effects of what an uptick in manufacturing might look like for the environment.
THE TAKEAWAY
The coronavirus has introduced uncertainty into everyone’s lives. As with any economic disruption, the best way to cut through confusion and uncertainty is with data and insight. IMPLAN provides you the ability to model the impact of these circumstances on your own economy.
https://implan.com/wp-content/uploads/Market-site-Logo-resized-2-1.jpg00Joe Demskihttps://implan.com/wp-content/uploads/Market-site-Logo-resized-2-1.jpgJoe Demski2020-08-12 09:58:532020-08-12 09:58:53Pandemic: Analyzing the Economic Impacts of the Coronavirus