Understanding the Leontief Production Function (LPF)

INTRODUCTION:

Production functions detail the relationship between inputs and outputs. They represent the technically-efficient combination of inputs required for producing a certain level of output (Hess, 2002).  This article outlines the three most common production functions, with an emphasis on our personal favorite, the Leontief Production Function.


PRODUCTION FUNCTIONS & ISOQUANTS:

In general, functions talk about relationships between variables.The basic formula for production functions is:

LPF_-_PF_Formula.jpg     

Isoquants are the lines shown in graphical representations of production functions that show the required financial capital (K) and labor (L) required to produce the quantity of output (Q). The ability to substitute factors of production is demonstrated in the shape of the isoquants (Hess, 2002).

There are three main types of production functions: linear, Cobb-Douglas and Leontief. The differences among them lie in the relationship between the variables: output, capital, and labor. The Leontief Production Function is used in IMPLAN to dictate the ratio of inputs needed by each Industry in order to produce a unit of Output (in terms of dollar value).


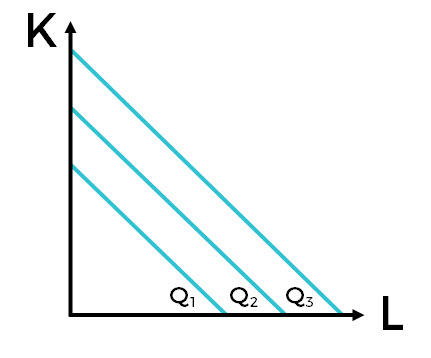
LINEAR PRODUCTION FUNCTIONS

The most basic is the Linear Production Function. Here, output is a simple function of inputs; unlike in the Leontief Production Function, capital can be substituted for labor perfectly. In the graph, we see three straight isoquants each showing the level of capital (K) and labor (L) required to produce the quantity of output (Q) (represented by the lines). In this equation, a and b are the output elasticities of K and L. Output elasticity refers to the ratio of change in Output to the proportionate change in input.

 LPF_-_Linear_PF_Formula.jpg

LPF_-_Linear_PF_Graph.jpg

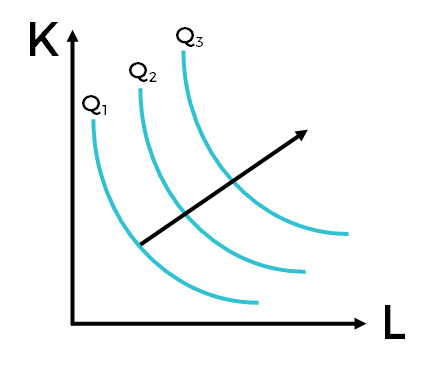
COBB-DOUGLAS PRODUCTION FUNCTION

The classical production function is commonly termed the Cobb-Douglas Production Function. Here, we see that output (Q) is still a function of capital (K) and labor (L), however, we also see the addition of a productivity assumption (A). Productivity is built into each Leontief Production Function within every IMPLAN dataset based on the level of productivity for the given Industry and Data Year. As with the linear production function, a and b represent the output elasticities of K and L. 

The isoquants in the Cobb-Douglas Production Function are curved with the slope changing along them. This indicates that the capital and labor inputs are not perfect substitutes for each other. There can be input substitution, but it is not linear.

 LPF_-_Cobb_Douglas_PF_Formula.jpg

LPF_-_Cobb_Douglas_PF_Graph.jpg

LEONTIEF PRODUCTION FUNCTION

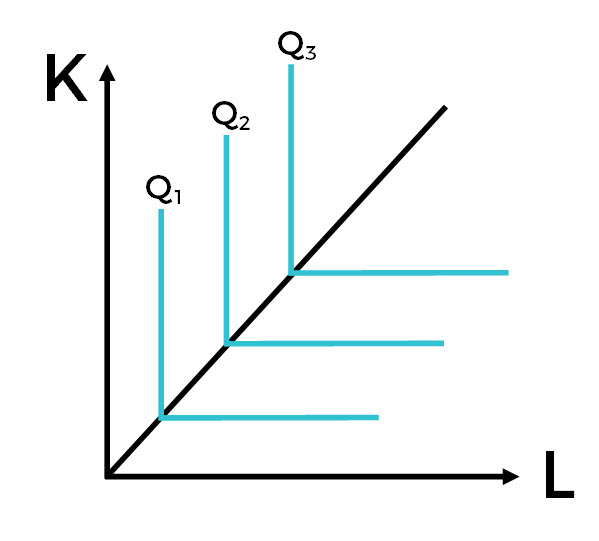
The Leontief Production Function (LPF), named for the father of Input-Output economics Wassily Leontief, is what is utilized in IMPLAN. It is also known as the Fixed-Proportions Production Function. We still see output (Q) being a function of capital (K) and labor (L). The designation of min refers to the smallest numbers for K and L.

The isoquants in the LPF are right angles. Capital and labor are fixed proportions. They are perfect complements and cannot be substituted for one another. Increasing the inputs will lead to a proportional increase in output (Miller & Blair, 2009). Also, you can’t have too few or too many outputs; the relationship between capital and labor is locked.
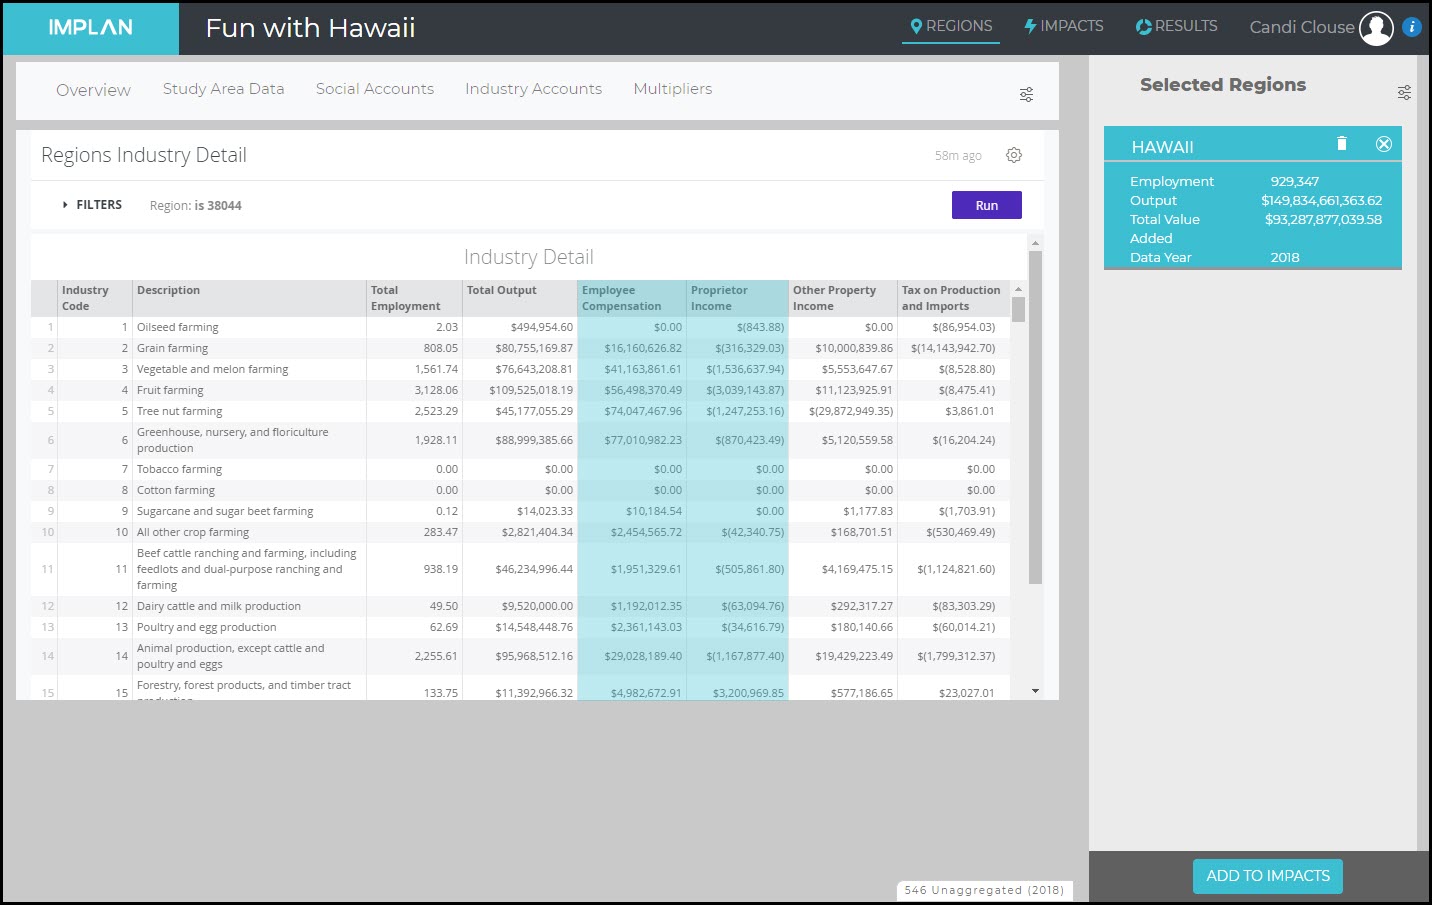
 LPF_-_Leontief_Production_Function_Formula.jpg

LPF_-_Leontief_Production_Function_Graph.jpg


THE LPF IN IMPLAN:

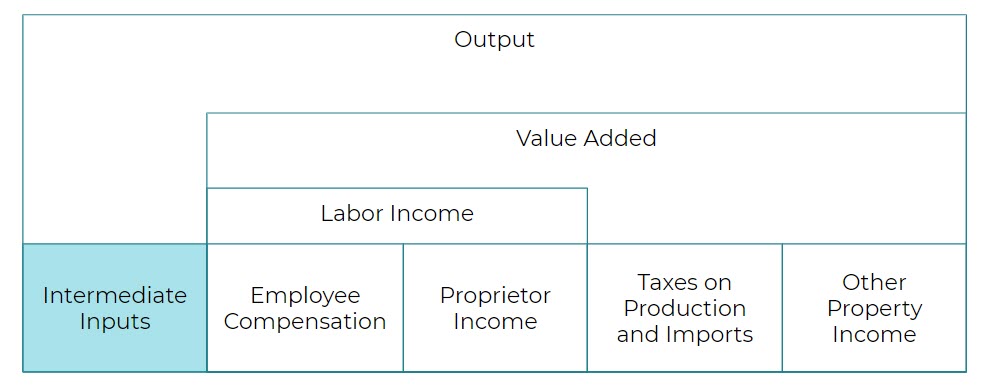
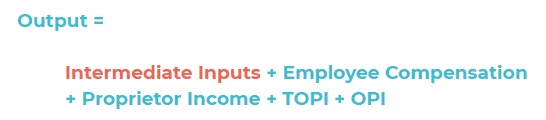
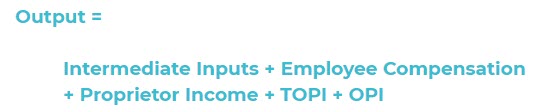
So that was a fun economics lesson, but how does this work in IMPLAN? Well, it all comes down to Output, the total annual production value of each Industry. The LPF of an Industry in IMPLAN determines how each Industry will allocate Output. Industries have employees, they pay Labor Income and Proprietor Income. They also pay taxes (Taxes on Production and Imports) and realize profits (Other Property Income). These combine to give us Value Added. In addition to the Value Added, Industries spend money on Intermediate Inputs. 

Instead of just Output just consisting of capital and labor, we have an equation for Output that includes all of these pieces:

Output___II_EC_PI_TOPI_OPI.jpg

If you want to dig into the details on how the magic happens with some information on the matrices, read Industry Leontief Production Functions in IMPLAN.

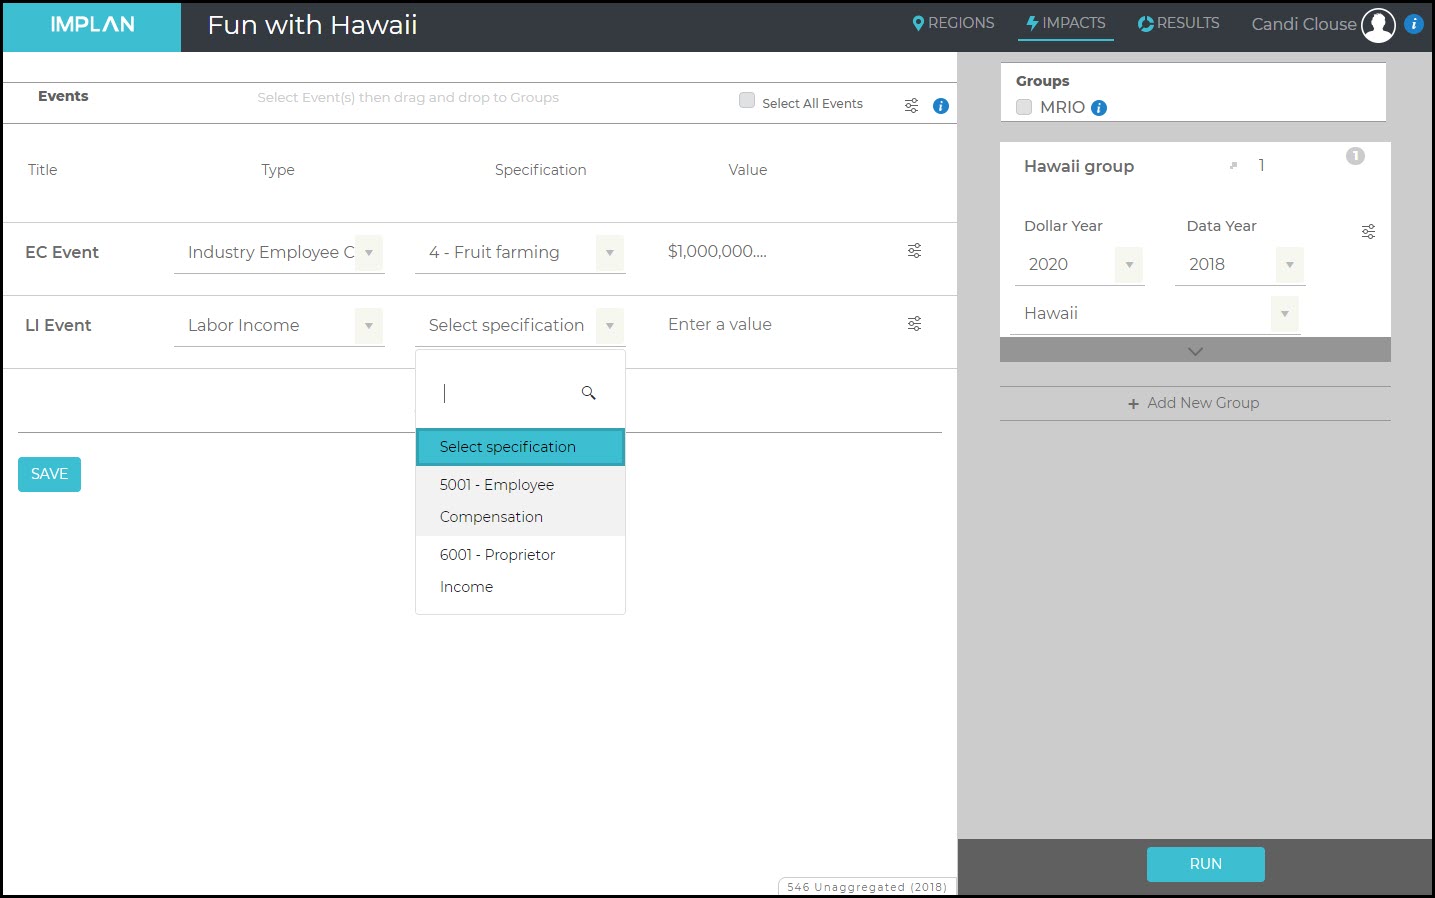
Note that while IMPLAN is based on the Leontief Production Function, you can make changes to Industry relationships using a technique called Analysis by Parts which allows for customization of the LPF.


RELATED ARTICLES:

ABP: Introduction to Analysis-By-Parts

Industry Leontief Production Functions in IMPLAN


OTHER RESOURCES:

Hess, P. (2002). Using Mathematics in Economic Analysis. Upper Saddle River, NJ: Prentice Hall.

Miller, R.E. & Blair, P.D. (2009). Input-output Analysis: Foundations and Extensions (second edition). New York: Cambridge University Press.

Economic Impact Reporter’s Toolkit

Supply Chain versus Value Chain

INTRODUCTION:
It is important to be able to distinguish between the concepts of a Value Chain and a Supply Chain. Supply Chains describe the chain of Intermediate Input purchases, or backward linkages, that are included in an Industry’s Spending Pattern and the Spending Patterns of its supplier, and so on. These purchases are incorporated into a new product that is then sold either to another Industry or to final demand.

A simplified Supply Chain of t-shirt may look like:

Cotton → Fabric → T-shirt

On the other hand, Value Chains describe how a good changes in value, after its produced, through the process of selling the good via a wholesaler or retailer. Throughout the Value Chain, Commodities increase in value, but unlike through a Supply Chain, do not change physically from the factory door to the final sale. A Value Chain provides a breakdown of the Total Revenue of a good into the Marginal Revenues of each Value Chain component (which sum to Total Revenue).

The Value Chain of the t-shirt includes each element of value of the t-shirt at time of purchase at the retailer:

tshirt_value_chain.png

DETAILED INFORMATION:
WHERE TO FIND AN INDUSTRY’S SUPPLY CHAIN
In IMPLAN, you can explore an Industry’s Supply Chain from Behind the “i” in

Social Accounts >

Balance Sheets >

Industry Balance Sheet >

Commodity Demand, Filtering by the Industry of interest

Here you will find a list of all of the Industry’s Intermediate Inputs. Gross Absorption and Gross Inputs reflect all demand. Regional Absorption and Regional Inputs reflect local demand. Filtering by the Industries that produce the Regional Inputs allows you to explore the next round of the Supply Chain. Exploring the Supply Chain will exponentially widen in each round of suppliers purchasing from their suppliers.

WHERE TO FIND A PRODUCT’S VALUE CHAIN
The Value Chain of a good cannot be found Behind the “i” in IMPLAN. Instead you’ll need to explore the Excel file of the IMPLAN Margins. The full value of good is available in the Commodity tab of this excel file. These Margins are not regionally specific.

For example, let’s look at the Value Chain for Mens and boys cut and sew apparel, which includes T-shirts:

tshirt_value_chain_excel.png

The chart below displays all non-zero values in the Value Chain:

Commodity

Commodity Name

Margin Commodity

Margin Commodity Name

MarginValue

3125

Men’s and boys’ cut and sew apparel

3125

Men’s and boys’ cut and sew apparel

0.372592838

3125

Men’s and boys’ cut and sew apparel

3400

Wholesale services – Other nondurable goods merchant wholesalers

0.123361792

3125

Men’s and boys’ cut and sew apparel

3401

Wholesale services – Wholesale electronic markets and agents and brokers

0.009337612

3125

Men’s and boys’ cut and sew apparel

3409

Retail services – Clothing and clothing accessories stores

0.477160698

3125

Men’s and boys’ cut and sew apparel

3414

Air transportation services

0.001306514

3125

Men’s and boys’ cut and sew apparel

3415

Rail transportation services

9.04E-05

3125

Men’s and boys’ cut and sew apparel

3417

Truck transportation services

0.01615018

This shows that 37% of the value of a t-shirt sold at a retailer is the Marginal Revenue/Producer Price of the t-shirt. 12.3% of the Purchaser Price of a retail t-shirt is the Marginal Revenue for the merchant wholesaler and 47.7% is the Marginal Revenue for the retailer, and so on.

ANALYZING A SUPPLY CHAIN VS. IMPACTING A VALUE CHAIN
The Supply Chain of the affected Industries are being analyzed In every IMPLAN analysis. This is the foundation of Input-Output analysis and is how IMPLAN calculates backward linkages.

The full Value Chain of a good is only analyzed when Total Revenue has been entered into a Commodity Event.

Only the retail portion of Total Revenue is analyzed when Total Revenue has been entered into an Industry Event with a retailer or wholesaler specified.

SUPPLY CHAIN LEAKAGES
Remember, Supply Chains describe the chain of Intermediate Input purchases, or backward linkages, that are included in an Industry’s Spending Pattern and the Spending Patterns of its supplier, and so on. When Intermediate Input purchases are bought from Industries in the Selected Region this supports an economic effect in that Region. In the case of the Direct Industry’s Supply Chain, local industry purchases of Intermediate Inputs specifically support Indirect Effects. All of an Industry’s purchases cannot be sourced from Industries within the Region even at the U.S. level. The purchases of imports and institutional production (other than srap produced by households) are exogenous to a Region’s multipliers in IMPLAN. This simply means these purchases are leakages and do not generate effects.

IMPLAN calculates the Supply Chain leakages for you by setting the Local Purchase Percentage (LPP) on Commodity purchases in an Industry’s Supply Chain to the Regional Purchasing Coefficient (RPC) for the given Commodity unless you specify otherwise. The only time IMPLAN will default the LPP of a Commodity purchase to 100% is in a Commodity Event.

IMPLAN determines the industry and institution producers of a Commodity in a Region based on the Market Share for the Commodity.

VALUE CHAIN LEAKAGES
As mentioned, only the retail portion of Total Revenue is analyzed when Total Revenue has been entered into an Industry Event with a retailer or wholesaler specified. The other portions of Total Revenue are leakages because without knowing what was purchased at the retailer or wholesaler, the full Value Chain cannot be identified.

Because the components of a Value Chain for a good are made up of Commodities, some portion of the Commodities in the Value Chain may be produced by institutions in the Region, in which case these portions are leakages.

When LPP is set to a value less than 100% in a Commodity Event evaluating a Value Chain there will also be leakages. When LPP to is set to “SAM” in this situation, the leakage of each Commodity in the Value Chain is based on the RPC for each Commodity.

Understanding Intermediate Inputs (II)

INTRODUCTION:

Let’s get this out of the way right off the bat. Intermediate Inputs were previously called Intermediate Expenditures in IMPLAN. Much like Prince (once known as only a Love Symbol) or Sean (middle name now “Love” not “Diddy”) Combs, sometimes we have to change names. And you will love this one!

We changed the title to be consistent with the definition and terminology of the Bureau of Economic Analysis (BEA). The BEA defines Intermediate Inputs as “Goods and services that are used in the production process of other goods and services and are not sold in final-demand markets.”

Intermediate Inputs are purchases of non-durable goods and services such as energy, materials, and purchased services that are used for the production of other goods and services, rather than for final consumption. They do not include any capital-account purchases or labor.


LPF_Box_-_II.jpg


DETAILS:

The first round of Indirect Effects are triggered by the Intermediate Inputs purchased by the Direct business or businesses when analyzing Industry Events, Commodity Events, Industry Contribution Events, and Institutional Spending Pattern Events. The amount of Intermediate Inputs is solely determined by the Event’s Direct Output and the relationship between Output and Intermediate Inputs according to the Direct Industry’s Total Gross Absorption. Further rounds of Indirect Effects reflect the ripple effect through the local Supply Chain. The local businesses affected in the first round of Indirect Effects also purchase Intermediate Inputs from local businesses, and so on.

Labor Income and Household Income Events  do not generate any Indirect Effects but there are Intermediate Inputs still being analyzed in them. In these Events the income spent at local businesses is being estimated and analyzed. The Intermediate Inputs of the Inducedly affected business triggers further rounds of Induced Effects.

When using an Industry Spending Pattern Event the first round of Indirect Effects are triggered by the Intermediate Inputs being analyzed.  The amount of Intermediate Inputs is solely determined either by the Event Value alone (by default Industry Spending Pattern Event Values are total Intermediate Inputs) or by the relationship between Output and Intermediate Inputs according to the specified Industry’s Total Gross Absorption when “Total Output” is selected in the Advanced Menu of the Event instead of Intermediate Inputs. 

Industry Spending Pattern Events are appropriate when modifications to the Intermediate Inputs of an Industry’s Leontief Production Function are necessary. When detailed information is known about Intermediate Input spending, these Events can be used and adjusted to reflect the specific purchases or ratios of purchases. Industry Spending Patterns include all Intermediate Inputs for a given Industry. 

Institutional Spending Patterns are unique in that they describe both Intermediate Inputs and Value Added within the same Spending Pattern. The Results in Institutional Spending Patterns differ: the reported Direct Effects describe both what we would generally consider Direct Effects (income, Employment and Value Added) and the first-round Indirect Effects that arise from the government spending its budget. 


WHERE TO FIND IT IN IMPLAN:

ON THE REGIONS SCREEN

Intermediate Inputs represent the difference between Output and Value Added. To calculate Intermediate Inputs, head to the table Behind the i called Regions Industry Summary by navigating to

     > Study Area Data

          > Industry Summary

 II_-_Regions_Screen.jpg


If we look at Industry 1 – Oilseed farming in Ohio for example, we can calculate Intermediate Inputs 

     = Output – Total Value Added 

     = $2,526,412,335 – $753,211,566.09

     = $1,773,200,769


ON THE IMPACTS SCREEN

On the Impacts screen, you can see the Spending Pattern for Industries by choosing the Industry Spending Pattern Event Type or for Institutions by choosing the Institutional Spending Pattern Event Type. By clicking on the menu icon and choosing Advanced, you can see the list of Commodities purchased as inputs by that Industry or Institution.

 II_-_Impacts_Screen.jpg


ON THE RESULTS SCREEN

The Summary Results has a table entitled Economic Indicators by Impact. To calculate the Intermediate Inputs, simply take Output less Value Added. Therefore in this example, Intermediate Inputs

     = Output – VA

     = $829,827 – $392,848

     = $436,979


II_-_Results_Screen.jpg 


HOW IS IT CALCULATED?

IMPLAN defines Intermediate Inputs as: 

Output___II_RED_EC_PI_TOPI_OPI.jpg


Or more simply,

Output___II_RED_VA.jpg

So to calculate Intermediate Inputs, we just take Output less the other four components of the Leontief Production Function (which sum to Valued Added).

Intermediate Inputs

Goods and services that are used in the production process of other goods and services and are not sold in final-demand markets (BEA). Intermediate Inputs consist of purchases of non-durable goods and services such as energy, materials, and purchased services that are used for the production of other goods and services rather than for final consumption. They do not include any capital-account purchases nor do they include the inputs from the primary factors of production (capital and labor) that are components of value added.

These inputs are sometimes referred to as current-account expenditures. In IMPLAN, this was previously referred to as Intermediate Expenditures.

Analyzing Capital Investments

INTRODUCTION: 

Industries, households and government all make capital purchases. In IMPLAN, Capital simply refers to durable assets and devices that can be thought of as an investment for the purchaser. For Industries, this includes purchases that are used but not consumed in production like Intermediate Expenditures. For households, this includes all purchases that are used but not consumed in household daily life (consumables include things like food, electricity, water and clothes). Capital purchases are things that will be used on an ongoing basis and depreciate and degrade over time until it needs to be repaired or replaced (through an expenditure of capital).

Capital Expenditures are not assumed and analyzed for you when using IMPLAN’s most common Event Types. For example, when analyzing an Industry Event, IMPLAN estimates the impact of Intermediate Expenditures and Labor Income spending by the Industry. IMPLAN also estimates how much the Industry will spend on Taxes on Production and Imports, Less Subsidies (TOPI) and Other Property Income (OPI). However, IMPLAN will not estimate the impact of the TOPI and OPI being spent. This is because this would require assumptions to be made about where, when, and how these dollars would be reinvested. For this reason, IMPLAN leaves it up to each analyst to separately analyze how the government may use tax revenue via TOPI or how the Industry and their stakeholders will invest OPI. Perhaps you know the government will be using the property taxes gained within TOPI towards building a new highway, or perhaps you know the Industry will be using some of their Direct OPI to buy a new piece of equipment. These are capital expenditures that can be analyzed independently from an the businesses operations as these are one-time purchases. 


There are three Institutional Spending Pattern Event Types in IMPLAN designed to analyze capital expenditures: Federal Government Investment, State/Local Government Investment, and Capital. These Events are recommended when little to no information is available about the specific capital expenditure. This article details additional options and when each is most appropriate to use. 

DETAILED INFORMATION:

CONSTRUCTION

Capital expenditures may be invested in new construction. In this case, the capital expenditure going towards cost of construction should be entered in one of the IMPLAN Construction Industries via an Industry Output Event.  Note that new construction is different than repair and maintenance of facilities and needs to be analyzed appropriately.  Learn more about analyzing construction impacts here.

Only the cost of a structure itself should be analyzed through an IMPLAN construction Industry. The Furnishings, Fixtures and Equipment (FF&E) that will be added to the structure to make it fully operational are not captured in construction spending. 

MACHINERY, TECHNOLOGY, & FF&E

Non-construction capital investments include durable tools and appliances purchased and used again and again over time by businesses, households, or government. They can include technology, equipment, or machinery. The first consideration with this is whether or not the capital purchase can be made in your Region. Often times, these large items are not produced locally and therefore should be excluded from your analysis (as they are considered leakages).

Furniture, Fixtures, and Equipment (FF&E) are large, movable investments that businesses make. Like any purchase, choosing the right Event Type & Event settings for your analysis can be confusing. Follow the questionnaire and corresponding chart in the Industry vs. Commodity article to better understand how to enter an FF&E purchase as an Event in IMPLAN. 

If you do not have enough information to categorize your capital purchase using the questionnaire, either do not analyze the purchase or skip to the next section of this article to explore a couple more options. 

INVESTMENT AND INSTITUTIONAL SPENDING PATTERNS

When little is known about the purchase being made you could consider using an Investment Spending Pattern to model the FF&E expenditures. This file has the general capital investment spending patterns for FF&E alone and for FF&E and construction for consolidated Industries. These spending patterns can be put into IMPLAN by analyzing a list of the associated Commodity Events (these can be copied about pasted into a the Commodity Event tab of the Event Template).

If you have no idea where the investment will be spent, there is one final option. You can use an Institutional Spending Pattern Event. The Federal Government Investment and State/Local Government Investment Spending Patterns are appropriate for analyzing general government investment in capital. Although not typically recommended, a general capital investment could be analyzed with the Capital Spending Pattern Specification. The Institutional Spending Pattern Event Type represents a general spending distribution for measuring broad Institutional activity in your Region. The Capital Institutional Spending Pattern reflects the distribution of Commodity purchases for capital investments by all Industries in the Region and Data Year. In an Institutional Spending Pattern Event, enter the total investment amount Value. That Value is then split across a list of Commodities (which can be viewed in the Menu under Advanced). This Event Type will analyze the purchases of local Commodities based on the rate in which each Commodity is purchased in your Region in that Data Year.

Industry vs. Commodity Output

INTRODUCTION:
Whether you are analyzing a capital investment, an Industry’s bill of goods, results of a visitor survey, or some other collection of spending data the question often arises, should I analyze this purchase as an Industry Output Event or a Commodity Output Event? Should the analysis be framed from the perspective of the product or the producer?

Because there are several considerations when making this selection appropriately this article is designed to assist you in making a well informed choice.

IDENTIFYING THE PURCHASE SCENARIO:
The questionnaire and table below outlines all of the potential possibilities when analyzing a purchase. For example, if you know there is a purchase from a local manufacturer, you can simply use an Industry Output Event and specify the appropriate manufacturing Industry. We start with where the item was purchased. By following the outline below, you can find the correct corresponding Event Type & Event settings numbered in the table.

If you do not have enough information to categorize your purchase into one of the scenarios below, the purchase should be omitted from your analysis. Without the necessary information to define the purchase as an Event, IMPLAN has no way of estimating how the purchase affects the Region you’ve selected. In the case of specifically capital purchases, there are a couple other options to consider here.

FROM WHOM WAS THE PURCHASE MADE:
A. Manufacturer
B. Local retailer or wholesaler
C. Non-local retailer or wholesaler

A: Purchase made through manufacturer
Was the product produced locally?
Yes: move on to question A2
No: Purchase Scenario #7
Not sure: Purchase Scenario #5
Do you know what they bought or who they bought it from?
What they bought: Purchase Scenario #3
Who they bought it from: Purchase Scenario #1
Note: Making this choice is most relevant for consideration when the supply of the good or service may be distributed across multiple Industries or Institutions such as government and inventory, which differ by Region. Check the Market Share of a good or service in your Region.

B: Purchase made through local retailer or wholesaler
Do you know what they bought?
No: Purchase Scenario #2
Yes: move on to question B2
Was the product produced locally?
No: Purchase Scenario #2
Yes: Purchase Scenario #4
Not sure: Purchase Scenario #6

C: Purchase made through non-local retailer or wholesaler
Do you know what they bought:
No: Purchase Scenario #7
Yes: move on to question C2
Was the product produced locally:
No: Purchase Scenario #7
Not sure: Remove margins, calculate Producer Marginal Revenue then proceed to Purchase Scenario #5
Yes: Remove margins, calculate Producer Marginal Revenue then proceed to Purchase Scenario #3
PURCHASE SCENARIOS
#

Event Type

Event Specification

Event Value

Margins Selection

LPP Setting

1

Industry Output

Manufacturer

Price paid at place of purchase

N/A

N/A

2

Industry Output

Retailer or Wholesaler

Price paid at place of purchase

Total Revenue

N/A

3

Commodity Output

Product

Price paid at place of purchase

Marginal Revenue

LPP = 100%

4

Commodity Output

Product

Price paid at place of purchase

Total Revenue

LPP = 100%

5

Commodity Output

Product

Price paid at place of purchase

Marginal Revenue

LPP = “SAM” (Region’s Commodity RPC)

6

Commodity Output

Product

Price paid at place of purchase

Total Revenue

LPP = “SAM” (Region’s Commodity RPC)

7

The purchase cannot be analyzed as an Event in the Region

Learn more in the following articles where these purchase scenarios are further explained and exemplified:

Retail and Wholesale: Industry Margins
Retail and Wholesale: Commodity Margins
Analyzing Capital Investments
Manually Marginning Bill of Goods (see example 2 to understand how to manually margin a Commodity and find the Producers’ Marginal Revenue)
ABP Bill of Goods Using Commodity or Industry Events

MRIO: Filtering Complex Analyses

INTRODUCTION:

When using Multi-Regional Input-Output (MRIO), with a few Events in a few Regions, it can become cumbersome to understand how the Filters will display your Results.  Here’s a guide on how to use the Filters to see the Results you want to report.


MRIO_Filtering_-_Table.jpg


REGIONS & EVENTS:

Let’s walk through an example with three Regions: A, B, and C. Here we have two Events generating Direct Effects to start; both in Region A. These Direct Effects in Region A created Indirect and Induced Effects in all three Regions as illustrated below.


MRIO_Filtering_-_Multi-Region.jpg


Using MRIO, you can have Events in more than one Region. This example shows how we have Direct Effects now in Region A (Event 1 and Event 2) and Region B (Event 3). Each of these three Events now yields Indirect and Induced Effects in all three Regions.

MRIO_Filtering_-_Multi-Region_2_Events.jpg


FILTERING YOUR RESULTS:

The Results screen will default with no Filters applied and in the current Dollar Year. If you apply a Region Filter for Region A, your Results will display the total Effects to Region A as a Result of the analysis. In this analysis there are three Events, two of which occur in Region A. Filtering by Region A in this analysis will display the resulting Effects to Region A due to all three Events in the analysis. 


FILTER REGION A

MRIO_Filtering_-_Region_A.jpg


If you remove the Region Filter for Region A and replace it with a Filter for Region B, you will see total Effects to Region B due to all three Events in the analysis.


FILTER REGION B


MRIO_Filtering_-_Region_b.jpg

Changing the Region Filter to only include Region C will not yield a Direct Effect, as there was no Event that occurred in Region C. You will, however, see Indirect and Induced effects in Region C because of the three events.


FILTER REGION C

MRIO_Filtering_-_Region_C.jpg


If you remove the Region Filter completely and choose Event 1 from the Event Filter, your Results will display the total Effects of Event 1, in all three Regions.


FILTER EVENT 1

MRIO_Filtering_-_Event_1.jpg

Applying the Event Filter for only Event 2 will show the effects of only this Event in all three Regions.


FILTER EVENT 2

MRIO_Filtering_-_Event_2.jpg

Applying the Event Filter for only Event 3 will show the effects of only this Event in all three Regions.


FILTER EVENT 3

MRIO_Filtering_-_Event_3.jpg

If you remove all Event Name and Region Filters and instead Filter your Group Name for Group 1, you will see the impact of every Event in this Group (in this example Group 1 includes Event 1 and Event 2) across all three Regions.


FILTER GROUP 1

MRIO_Filtering_-_Group_1.jpg


Where things start to get complicated is when you add multiple Filters at the same time. You can Filter for any number of Event Names, Group Names, or Regions at the same time. Just be careful to ensure you know what you are seeing when you do so. In the example below, the Filter was set for Event 1 and Region C. Therefore, we are only seeing the Effects of Event 1 on Region C.


FILTER EVENT 1 & REGION C

MRIO_Filtering_-_Event_1_and_Region_C.jpg

Understanding Labor Income (LI), Employee Compensation (EC), and Proprietor Income (PI)

INTRODUCTION:

Labor Income is the sum of Employee Compensation (wages and benefits) and Proprietor Income. Labor Income represents the total value of all forms of employment income paid throughout a defined economy during a specified period of time. It reflects the combined cost of total payroll paid to employees (e.g. wages and salaries, benefits, payroll taxes) and payments received by self-employed individuals and/or unincorporated business owners (e.g. capital consumption allowance) across the defined economy.


LPF_Box_-_LI.jpg


DETAILS:

Labor Income consists of two parts. The first, Employee Compensation, is the total payroll cost of wage and salary employees to the employer.  This includes wages and salaries, all benefits (e.g., health, retirement) and payroll taxes (both sides of social security, unemployment insurance taxes, etc.).  It is also referred to as fully-loaded payroll.

The second piece of Labor Income is Proprietor Income (PI). PI consists of payments received by self-employed individuals and unincorporated business owners. More specifically, it represents the current-production income of sole proprietorships, partnerships, and tax-exempt cooperatives. It includes the capital consumption allowance and is recorded on Federal Tax form 1040C. It excludes dividends, monetary interest received by nonfinancial business, and rental income received by persons not primarily engaged in the real estate business.

Note that IMPLAN’s estimated Employee Compensation and Proprietor Income fields represent the average payroll values for all employees that work in a firm, across all Industries that report in the Study Area’s region.

Labor Income generates Induced Effects via the spending by local residents that are employed by the direct business or businesses. The local residents employed by the Indirect businesses also generate Induced Effects due to their spending. If no Labor Income is entered into the Event, IMPLAN will calculate it by the ratio of the Industry’s Labor Income to Output. Note, if Labor Income information is entered in your Event in addition to Output, IMPLAN will not re-balance Output.


WHERE TO FIND IT IN IMPLAN:

Labor Income can be found in IMPLAN Behind the “i” in the Study Area Data tab. Within the Industry Detail table you will find the two forms of Labor Income, Employee Compensation and Proprietor Income, by Industry. Within the Industry Summary table you will find Labor Income as a total and Labor Income per Worker by Industry. 


ON THE REGIONS SCREEN

The REGIONS screen offers a massive assortment of data points Behind the i. Details on the two pieces of Labor Income (EC and PI) can be found by clicking

  > Study Area Data

          > Industry Detail


LI_-_Study_Area_Data.jpg


ON THE IMPACTS SCREEN

On the Impacts screen, you can model Employee Compensation and Proprietor Income by Industry. If you don’t know which Industry the income will be in, you can model a Labor Income Event. The article Types of Events can help you choose which one is best for your analysis.


LI_-_Impacts.jpg


ON THE RESULTS SCREEN

The Summary Results Overview will display Labor Income by Direct, Indirect, and Induced Effects. To dig further into the details, navigate to the Value Added tab. Here you will find all of the details for the four pieces of VA which include Employee Compensation and Proprietor Income.


LI_-_Results.jpg


HOW IS IT CALCULATED?

While Labor Income represents the total value of all employment income paid throughout an economy, Proprietor Income and Employee Compensation help us delineate between types of income more precisely. Specifically, Proprietor Income represents the value of payments received by any self-employed individuals and/or unincorporated business owners, and Employee Compensation represents the fully-loaded value of all payroll paid to any employees. So, Labor Income (LI) values represent the collective cost of both Proprietor Income and Employee Compensation. 

Labor Income contains two pieces:

LI_RED___EC_PI.jpg

And those two pieces are part of Output:

Output___IE_EC_RED_PI_RED_TOPI_OPI.jpg

Loans: Banking on It

INTRODUCTION:

As with all Industries in IMPLAN, there are certain considerations to make when examining the complicated world of banking and lending. Generally speaking, to model the operations of a bank, IMPLAN Industry 441 – Monetary authorities and depository credit intermediation would be the correct choice. This Industry includes commercial banks, savings and loans, and credit unions. Total Employment, Employee Compensation, Proprietor Income, and/or Output can be run through this Industry.  But what if you want to examine the economic impact of the loans that were made? Well, that depends on how the money will be spent.


CONSIDERATIONS ON LOANS:

Analyzing the economic impact of loans is tricky. The first consideration is that of time. A loan may be spread across multiple years and how it is spent may also cross years. In IMPLAN, each year of spending should be modeled separately. 

Also, if this bank didn’t give the loan, there is a possibility that another bank would give the loan. Be careful in attributing the entirety of the investment solely to the existence of this one bank and loans it provides.

The biggest matter, however, is how the loan will be spent by the borrower. There are no lack of possibilities as to how the money could be used, each having drastically different economic impacts. In order to measure the economic impact of the loans, you have to first know how the loan will be spent. Keep in mind that the loan may be spent across a few categories.

OPERATIONS

If the loan will be spent on operations for the business, this can be analyzed using a standard Industry Output Event. Choose the appropriate IMPLAN Industry and enter the loan amount Value. Note that the operations spending may not just be across the board, it may specifically be for new hires or employee raises. 

If the entirety of the loan is modeled through operations, you are assuming that none of the money will be spent on construction or capital. This means that increasing Output doesn’t require any capital purchases. 

CAPITAL

Construction

The loan may be used to fund new construction. If this is the case, the loan amount should be entered in one of the IMPLAN construction Industries via an Industry Output Event.  Note that new construction is different than repair and maintenance of facilities and needs to be analyzed appropriately. 

Machinery, Equipment, & FF&E

Perhaps the loan will be used for a large capital purchase. This could include an investment in real estate, technology, or machinery, for example. The first consideration with this is whether or not the capital purchase can be made in your Region. Often times, these large items are not produced locally and therefore should be excluded from your analysis.

OTHER USES

Perhaps the loan will actually be used to pay off property taxes. They might also use it to pay off another loan or creditor. If the borrowing is to avert a short term crisis, you may be able to argue that the entire operations of the company was dependent on that loan in order to avoid closing completely.


HOUSEHOLDS:

Banks lend money to households for various purposes, as well. It may be for the purchase of a home, student loan, car, or debt consolidation. Just with corporate lending, in order to analyze these loans in IMPLAN,  you must decide how the money will be spent and enter the values in the appropriate Industry. 


INTEREST:

A full debt repayment amount should not be run through the banking Industry in IMPLAN. The payment of principle is considered an asset transfer which has no economic impact. However, if the bank that is receiving the payment is within your Region, the interest portion of the debt can be run through the banking Industry. If the bank that is being repaid is out of Region, the entirety of the debt repayment is considered leakage and should not be included.

Interest payments can be thought of as being separated into two parts: interest payments for lending of assets (like cash) and interest payments that are for the value of services provided by financial institutions. Interest for the value of services are not directly measurable and must be estimated as these are included in the Intermediate Expenditure of the bank. The value of the imputed interest would be the difference between the interest income the business could earn were it to lend that money and the interest paid by the bank on the balance of the account. That difference functionally represents a service charge for maintaining the account, providing credit cards, processing information, etc.  

As another example, a business might borrow money from a bank and pay an interest rate of 5%. The bank would give the business various services like loan processing. In this case, the imputed interest would be the difference between 5% and the amount of money the bank could earn were it to lend the same amount of money without providing any services.  The remaining type of interest income, much like interest income that is solely based on returns to lending, is measured on a net basis and is included as a part of Other Property Income (OPI). 


FINAL CONSIDERATIONS:

In IMPLAN, an Industry’s Leontief Production Function represents operational spending only. It does not include investment in capital goods and therefore

it does not account for depreciation. Consumption of fixed capital is part of Other Property Income (OPI). Therefore, depreciation is captured as part of Output, but it does not generate Indirect or Induced impacts.

So, we have looked at what the bank did with all that loan money. It’s important, however, to consider the alternatives. If the bank didn’t invest in that million dollar loan to a software company, they might have invested in a multi-family housing structure or personal loans for used car purchases. Perhaps the bank could keep the money in reserves. These examples would obviously have very different effects on the local economy. By investing in the software company, the bank no longer has the capital to fund apartment construction or personal loans. The bank foregoes the potential gain from the alternatives and this is the opportunity cost.