Understanding Types of Income
INTRODUCTION:
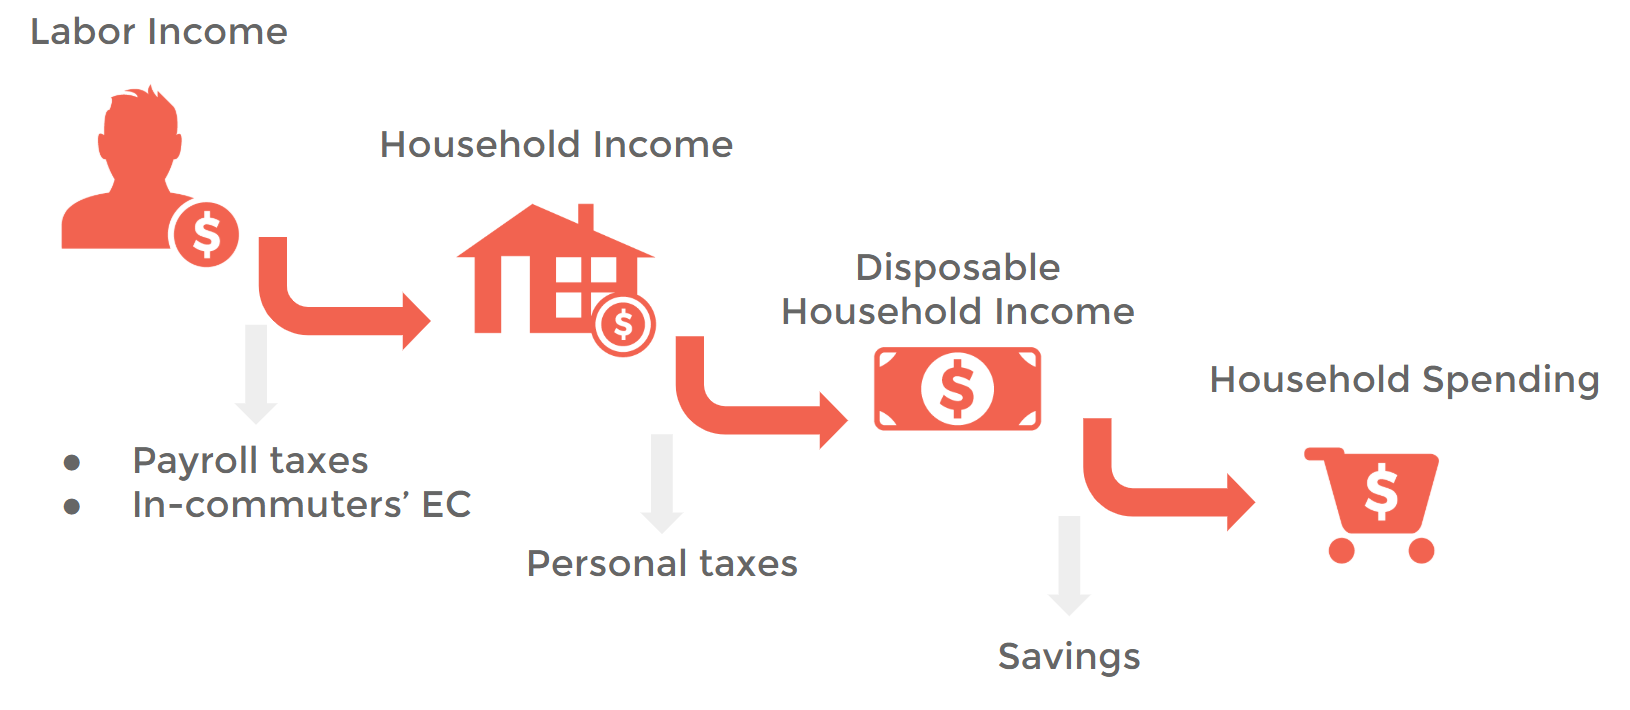
In IMPLAN, there are four types of income that can be identified: Labor Income, household income, disposable income, and household spending. This article breaks down the differences and how IMPLAN data compares to government estimates.
DEFINING INCOME:
First off, let’s define the fours types of income.
LABOR INCOME
Labor Income is the sum of Employee Compensation (wages and benefits) and Proprietor Income.
HOUSEHOLD INCOME
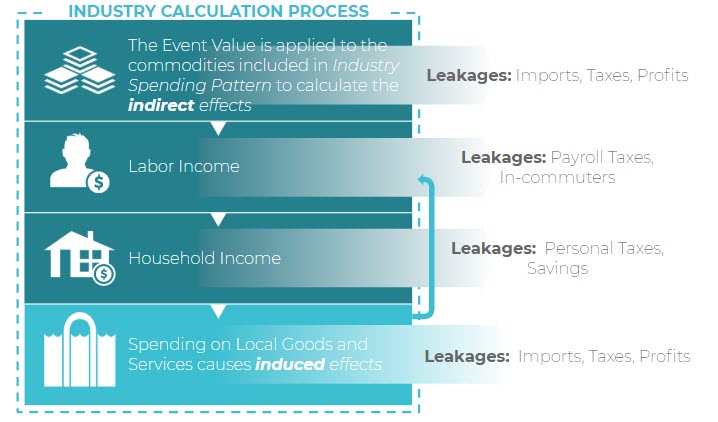
Household income represents the income from all sources received by residents, including total wages & salaries, benefits, interest, dividends, & transfer payments, less all contributions to Social Security/Medicare. Labor Income less payroll taxes and in-commuting income is included in household income in addition to all non-employment sources of household income. This is based on the BEA definition of personal income and is not comparable to money income as defined by the Census Bureau.
DISPOSABLE HOUSEHOLD INCOME
Disposable income is household income less personal taxes. Disposable Income is money that is available to be saved or spent.
HOUSEHOLD SPENDING
Household spending is what is actually expended by households on goods and services less personal taxes and savings.
WHERE TO FIND THEM IN IMPLAN:
LABOR INCOME
Labor Income can be found in IMPLAN Behind the “i” in the Study Area Data tab. Within the Industry Detail table you will find the two forms of Labor Income, Employee Compensation and Proprietor Income, by Industry. Within the Industry Summary table you will find Labor Income as a total and Labor Income per Worker by Industry.
In the Social Accounting Matrix (SAM) you will find Employee Compensation and Proprietor Income represented as columns and rows. The columns reflect the allocation of each of these forms of income to each row, largely to Households. The rows reflect all sources of Employee Compensation and Proprietor Income. Because Labor Income is only earned from Industries, you’ll only find a value in the Industry column of these rows.
HOUSEHOLD INCOME
Household Income can be calculated as the sum of all nine Household Income column totals from the Social Accounting Matrix. Each Household Income row here shows all the sources of Household Income, which in large part will be Labor Income.
DISPOSABLE HOUSEHOLD INCOME
Disposable Household Income can be calculated as Household Income as described above less the payments to government rows within the Household Income columns.
HOUSEHOLD SPENDING
Household Spending can be calculated as the sum of payments to the Commodity total row and Foreign and Domestic Trade rows within each Household Income column in Aggregate SAM. These payments reflect Household Spending on goods and services sourced from within the Region (payments to Commodity row) and outside of the Region (payments to trade rows).
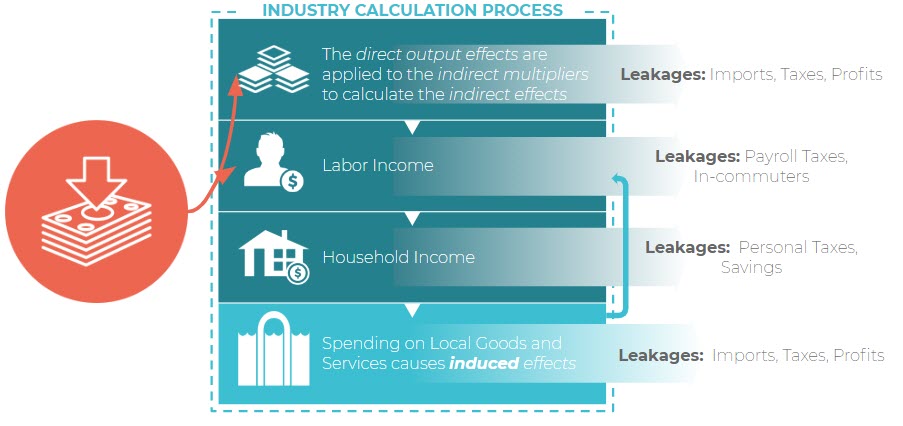
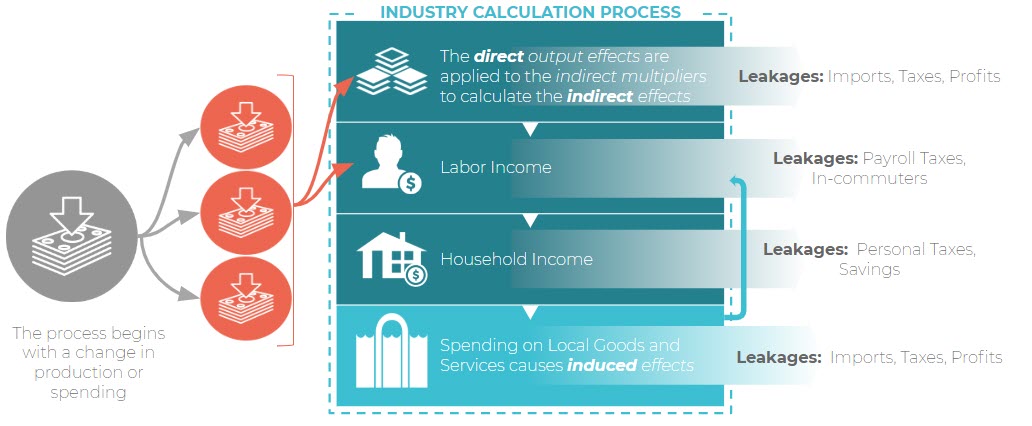
UNDERSTANDING THEIR RELATIONSHIP:
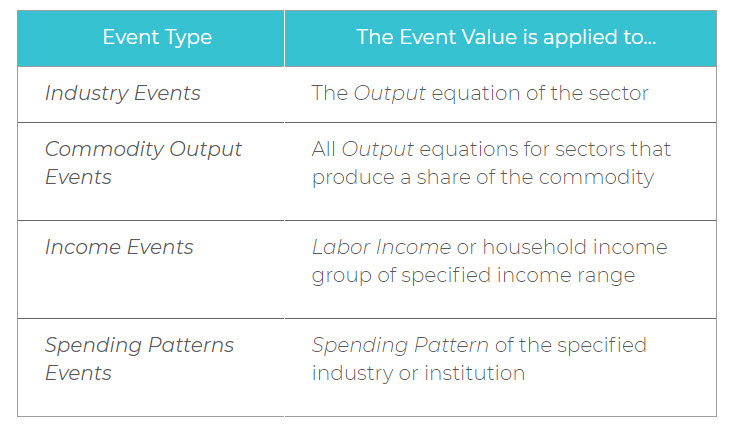
TWO EVENT TYPES:
To model spending of individuals, there are two Event Types in IMPLAN.
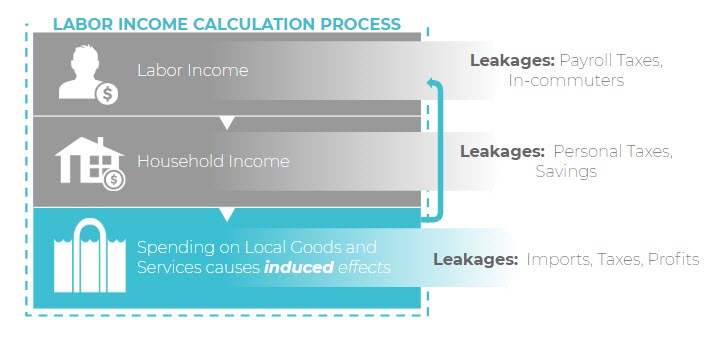
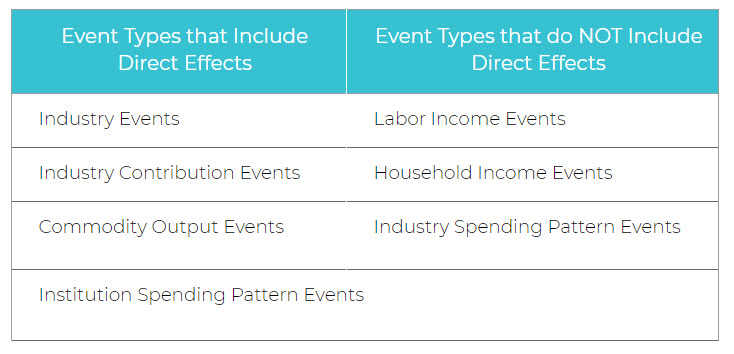
LABOR INCOME EVENTS
Labor Income Events are most appropriate to use when an analyst intends to model a change in labor payments isolated from an industry’s production. When creating a Labor Income Event in IMPLAN, analysts may specify whether the income is earned by employees (wage and salary), by proprietors, or some combination of the two. However, they cannot specify the specific household income categories which will receive that income.
Labor Income Event Value should include all new labor payments in the Region (local workers and in-commuters), including their
- Payroll tax
- Personal tax
- Savings
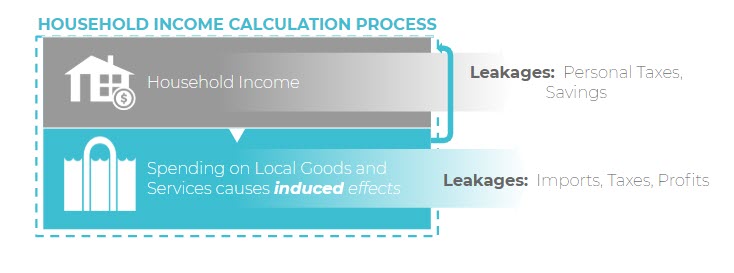
HOUSEHOLD INCOME EVENTS
Household Income Events are most appropriate to use when an analyst intends to model changes in household income that are independent of both production and payroll. In Household Income Events (unlike Labor Income Events), you can specify the specific income group(s) receiving the income into one of nine categories.
Household Income Event Values should include all new household income all residents in the region, including their –
- Personal tax
- Savings
USING WAGE & SALARY INCOME DATA
When you’d like to analyze wage and salary income data, it must be first converted into a fully loaded Employee Compensation value before entering the value into your Labor Income Event. Employee Compensation in IMPLAN is the fully loaded cost of the employee to the employer, therefore a wage and salary value would be missing the employer’s cost of benefits and contribution to Social Insurance Tax.
You can use the following resource to convert your wage and salary income to an Employee Compensation value as well as to convert an Employee Compensation value in the IMPLAN data or Results to a wage and salary income value.
USING DISPOSABLE INCOME OR HOUSEHOLD SPENDING DATA
If you’d like to analyze a change in disposable income, you can adjust a disposable income value to a household income value by dividing your disposable income value by the portion of household income (for a given income group column) allocated to non-government rows. In other words, dividing household income by the portion of household income that is disposable income for a given household income group. This will produce a value that can be entered in a Household Income Event. Similarly, dividing household spending by the portion of household income that is for household spending will produce a value that can be entered in a Household Income Event.
CONSIDERATIONS FOR USING AN INCOME EVENT:
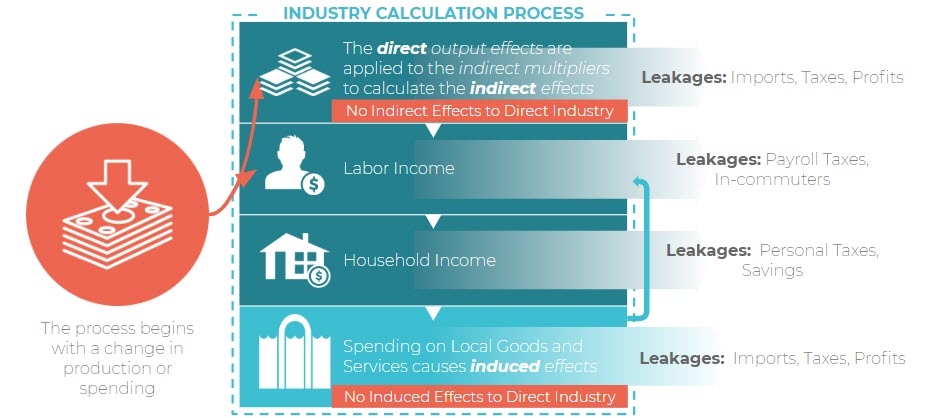
Labor Income Events are commonly and appropriately used for analyzing the impact of wage increases and business operations where Analysis-by-Parts is needed such that Labor Income and Industry Spending on goods and services are analyzed as two separate Events.
Household Income Events are commonly and appropriately used for analyzing new income in a Region due to new residents that live in the Region but do not work there.
Households and individuals may experience other economic shocks that increase or decrease the amount of income available to them. Before analyzing any impacts in IMPLAN its important to consider the underlying assumptions and then state the assumptions made in your analysis when reporting the results.
For example, if a policy change results in savings to households due to a reduction in cost on necessary goods and services such as electricity or insurance, how might these households react? If this household is living paycheck to paycheck, they may spend this newly available income on the items they typically buy. If so, a household income event would be appropriate. If this household already has their expenses covered maybe they go out to the movies more often, maybe they buy a few things on Amazon, or maybe they save it up for a future purchase like a new car. In this case a Household Income Event would not be appropriate since this household would not be appropriate. These considerations are explored further, specifically in the context of Utility Purchases and Energy Rebates here.
ONE MAJOR SOURCE OF CONFUSION:
So, you may look at the data Behind the i and then get ready to email your Customer Success Manager at support@implan.com to announce that what IMPLAN is reporting for Household Income is not even close to what the Census Bureau reports for Household Income. It’s OK, we know.
IMPLAN uses the BEA’s definition, which is not the same as what the Census uses. So, you won’t be able to compare these two sources. For more information on this, check out our article Why is Personal Income for My Region so High? Basically, the BEA definition includes imputed income, adjustments for misreporting and under-reporting, and employment paid benefits.