Dollar Year & Data Year

INTRODUCTION:

Dollar YearData YearSong of the YearYear of the RatWonder Years. There are a lot of years to keep track of. This article will help you understand at least two of them.


DOLLAR YEAR:

Dollar Year is the year represented by the values in your Event.  This is usually (but not always) the same as the year in which your event occurred or is expected to occur. 


IMPACTS SCREEN

On the Impacts screen, Dollar Year should be the year of the data you are inputting. 

RESULTS SCREEN

On the Results screen, Dollar Year shows the year of the value of the economic indicators – the year of what you want your results to show.


For an example of when Dollar Year on the Impacts screen will not be the year in which you event occurred, suppose you were borrowing a visitor expenditure pattern from a survey that was done in 2015.  But let’s say you want to use this data to estimate visitor spending in 2020. In this case, while the year of your event (that is, the year of the visits) is 2020, those dollars still represent 2015 dollars and must be characterized as such in order to generate correct results. By correctly telling IMPLAN that those values are 2015 values (by setting Dollar Year to 2015 on the Impacts screen), IMPLAN will know to inflate those values to the Data Year to ensure the correct values are applied to the multipliers.   

If you are setting up your event with an employment value instead of a dollar value (only recommended if you do not have a dollar value with which to start the set-up of your Event), Dollar Year should be set to the year in which that employment took place or is expected to take place.

Defining Dollar Year in the Impacts screen correctly is essential to getting accurate Results. On the other hand, how Dollar Year is defined in the Results screen is totally up to you and how you want to report your Results. If we want to report the effect of our 2020 visitors is 2020 dollars, we simply need to ensure the Dollar Year in the Results screen is filtered to 2020. Dollar Year in the Results screen will default to the current year. Remember, dollars can only be summed or compared when in like Dollar Years.


DATA YEAR:

Data Year is the year of the dataset that you are utilizing. Currently, IMPLAN has datasets for 2001-2018. We recommend using the Data Year that matches your data, the year your Events took place. If you are modeling something that occurred in the current year or is expected to happen in the future, we recommend using the most current dataset, 2018.

time_series.png

The Regions screen will show you data from 2001-2018 in the 546 Industry Scheme. To access datasets in the 536 Industry Scheme, start your analysis from the Projects screen and click New Project in the upper right.


Dollar_Year_Data_Year_-_New_Project.jpg


FOR 2012 – 2014 DATA YEARS IN THE 536 INDUSTRY SCHEME

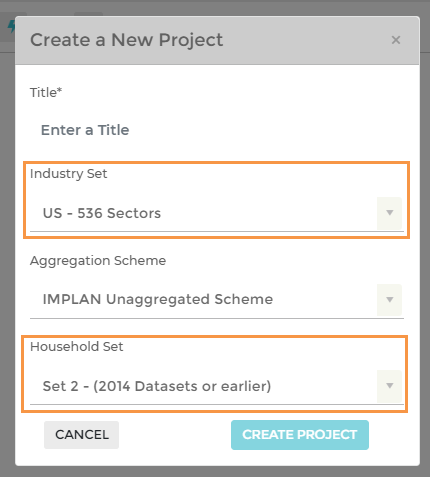
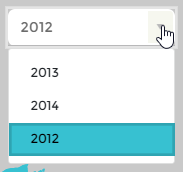
Give your project a name and then under Industry Set choose US – 536 Sectors and Household Set choose Set 2 – 2014 Datasets or earlier.  Once you’ve created the Project you will have access to the datasets from 2012-2014 (in the 536 Industry Scheme) in the drop-down menu at the top of the Regions screen (where you will be automatically redirected).

2012_to_2014.png

 2012_to_2014_dropdown.png


FOR 2015 – 2017 DATA YEARS IN THE 536 INDUSTRY SCHEME

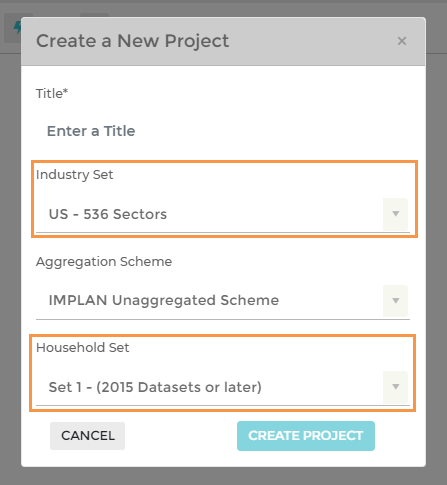
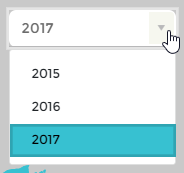
Give your project a name and then under Industry Set choose US – 536 Sectors and Household Set choose Set 1 – 2015 Datasets or later. Once you’ve created the Project you will have access to the datasets from 2015-2017 (in the 536 Industry Scheme) in the drop-down menu at the top of the Regions screen (where you will be automatically redirected).

2015_to_2017.png

 2015_to_2017_dropdown.png

FOR 2018 DATA YEAR IN THE 546 INDUSTRY SCHEME

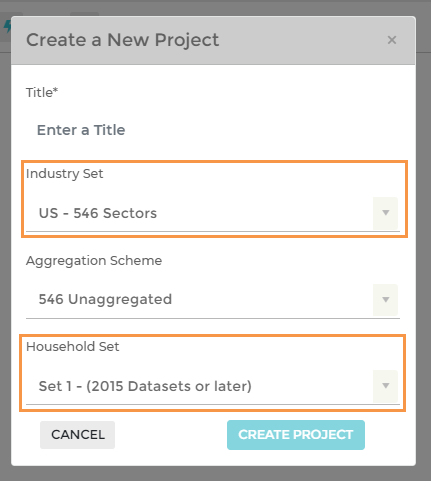
Give your project a name and then under Industry Set choose US – 546 Sectors and Household Set choose Set 1 – 2015 Datasets or later.  This will give you access to the 2018 dataset, which is only available in the 546 Industry Scheme.

2018.png

Construction: Building the Right Model

INTRODUCTION:

There are a few special considerations for modeling construction impacts. Not only are all projects different, they need to be carefully considered in IMPLAN.

Construction Sectors don’t have a perfect NAICS crosswalk as the other Industries do.  Instead, there is the file Definitions of IMPLAN’s 546 Construction Sectors found on our 546 Sector Industries, Conversions, Bridges, & Construction – 2018 Data page. This is where you can find which Sector will be best to use whether you are modeling the construction of a power plant, office, or even a museum.

The value entered in Industry Output for construction should be the full cost of the structure, and only the structure. This includes hard costs and soft costs.  Because Employment, by definition, is based on where the job is located not where an individual resides, Employment should include the full value full-time, part-time and temporary Employment on the job site during the year. Additional considerations of costs attributed to construction are considered below.


SQUARE FOOTAGE:

Sometimes rather than construction cost or Employment, only the square footage of the project is known. Calculators to convert square footage to construction costs, by building type, can be found online.


EMPLOYMENT & SPECIALIZED SKILLS: 

While all Sectors are likely to source some Employment from outside the region, construction Sectors are among a group that may be more likely to do so, because in many cases either:

  • The needed skills for a project may not be available in the region
  • Contractors may be sourced from outside the region

In these cases, it is important to remember that Employment is site based in IMPLAN, so even if a worker is brought in from outside the region they still count as “local” employment during the period of their work.

It is sort of unreasonable to assume that these outside workers will spend their income in the same way as residents. Thus, what we will modify is the Labor Income values for the construction sector. The Employee Compensation and Proprietor Income should be reduced by the amount of payroll that is going to workers outside the region, less the regional commuting rate. But do these outside workers then have no local impacts? That also is unlikely if they are in the region for any period. The best way to capture these impacts is by using per diem spending patterns, ideally from the company’s budget or allowances, but when these are not available government per diems can be used as an estimate. This not only captures a more reflective amount of local spending by these temporary residents, but it also prevents their income from being spent on common resident household expenditures like utilities and the costs of owning a home.

An in-commuting rate is gross regional rates in which local workers commute out of the region to go home. In the calculation of the Induced Effects the in-commuting regional rate reduces the total income before it’s distributed to local households. To avoid underestimating the effects of Labor Income you will want to be sure to account for the commuting rate from the Social Accounting Matrix.


LAND VALUES:

When construction impacts are being considered, a question that often arises is: “What is the impact of the sale of the land?” The truth is, the sale of the land has very little impact on the economy. The purchase of the land necessary for a construction activity should not be included as Industry Output for the construction sectors. Why? Land sales are considered asset transfers, where one person receives money while the other receives tangible property. Thus, the land sale itself has no value in IMPLAN. Some small impact may be captured however, by creating an Event for real estate fees, and for large commercial projects, legal fees.


HARD & SOFT COSTS:

Construction spending patterns in IMPLAN include architectural engineering, legal fees and other common soft costs, so these should be included into the Industry Output value. However, if you want to specify these values or have soft costs that are significantly different than a typical construction project in your selected Sector, these can be modeled separately.


FURNITURE, FIXTURES, & EQUIPMENT:

Furniture, Fixtures, and Equipment (FF&E) are large, moveable investments that businesses make.  FF&E consists of movable furniture, fixtures, and other equipment that is not directly attached to a building.  FF&E should not be modeled through the construction Sector.

Often times, the specialized FF&E will not be produced in your region of study. If you know that everything is being brought in, it is considered leakage and you can omit the spending from your model. You may know that it was purchased through a local retailer or wholesaler, so then you can model the purchases through the appropriate Sector. Maybe you know that some of the purchases will be sourced locally. Then you can again choose the appropriate Sector, like 370 – Wood office furniture manufacturing, and enter the spending.  

European Union Data

INTRODUCTION:

Guten Tag!

You may not know this, but IMPLAN is working on other projects besides the beloved economic impact software for the US. In fact, IMPLAN economists have been researching European Union (EU) data behind the scenes. Just as IMPLAN was a pioneer in I-O modeling in the US, we are doing the same in the EU. That’s right, IMPLAN is crossing the pond!


PRODUCT DETAILS:

IMPLAN has produced tables for 2010-2016 for all 28 EU member countries and subregions within them. The data sources are Eurostat and the World Input-Output Database (WIOD).  

Just like the creation of our longstanding US I-O tables, IMPLAN economists take publicly available data and assemble it into fully disclosed, entirely balanced tables. You can go pull some EU data, but IMPLAN has taken the hard work out of organizing it.  No need to worry about imputing missing values or ensuring your entire 28 country, 64 Industry I-O matrix is fully balanced.  

The data is NUTS; Nomenclature of territorial units for statistics.  There are four levels of NUTS.

  • NUTS0: 28 countries
  • NUTS1: 98 major socio-economic regions
  • NUTS2: 276 basic regions for the application of regional policies
  • NUTS3: 1,342 small regions for specific diagnosis

EU Countries 1 

EU_-_NUTS_Members.jpg

There are 64 Industries and Commodities in the dataset. And guess what! It is even ready for MRIO with inter-regional commodity trade flows, inter-regional commuting flows, and of course a balanced Social Accounting Matrix (SAM).

You don’t have to learn any foreign languages to use the data, either.  All of the resources are in English. The monetary figures are all reported in Million Euros (€ Million).

The kicker is that the data isn’t available in app.implan.com. Yet. Therefore, in order to use it, you must be familiar with manipulating I-O tables in Excel.  


DATA SOURCES:

Eurostat is the official statistical office of the EU. It is located in Luxembourg with a mission to “provide high quality statistics for Europe.” 2 Eurostat doesn’t collect data, but instead creates the standards by which EU members are to collect their data. They then compile it for use across the EU and have compilations through 2018 for some countries.

The World Input-Output Database (WIOD) was launched in 2009 with funding from the European Commission. 3 They are aimed at examining global integration and inequality across nations. The most recent released WIOD data in 2016 covers 43 countries’ data from 2000 to 2014. They have 64 industries and corresponding commodities in the supply and use tables, and 56 industries in the social economic accounts.


DIFFERENCES FROM US DATA:

There are a few differences between the IMPLAN US data you are familiar with and the new EU data other than the fact that it isn’t in app.implan.com so far. The US data uses a gravity model, while the EU data uses a radiation model. This is due to limitations with the EU dataset that don’t have enough raw data details for a full gravity model to be constructed.  

Employment figures are a little different, too. While the US data counts jobs, the EU data counts people. So if a person has multiple jobs, they will only be classified under their primary one. They will not show up as an employee in their second (or third or fourth) jobs.

In terms of differences in the SAM structure, The EU data also does not have sufficient granularity to break out household income classes. Therefore, you will only find one household income group. The EU data does distinguish households from nonprofit institutions serving households (NPISH), while the US data distributes these over household groups. Also, taxes are reported as gross values, with subsidies reported separately; US data reports net taxes less subsidies.

The EU dataset is reported in Basic Prices. Basic Prices are the amount realized by the producer after taxes and subsidies.  The U.S. data is reported in Producer Prices, which are the amount realized by the producer before taxes and subsidies. 4 In the EU data, Taxes less Subsidies on Products are included in the TOPI for the U.S. data, but not for the EU data.


Producer_Price___Basic_Price.png

In detail, this means the intermediate use and final demand values are net of Margins and net of Taxes less Subsidies on Products. In the U.S. using the Producers’ Prices system, those values are only net of Margins. While the Employee Compensation, Proprietor Income, Other Property Income, and Taxes on Production and Imports Less Subsidies (TOPI) are included in the U.S. Value Added at Producers’ Prices, the difference from EU Value Added at Basic Prices lies in TOPI. TOPI in the U.S. includes two pieces: Other taxes less Subsidies on Production and Taxes less Subsidies on Products. Each industry’s value of Other Taxes less Subsidies on Products is equal between the two price systems.  The difference is in the remaining portion, which is known as Taxes less Subsidies on Products. While the sum total of this part of TOPI is the same in either price system, each industry’s value is different. Technically, in a Basic Prices framework, Taxes less Subsidies on Products are not part of Value Added. IMPLAN has estimated TOPI values for converting Basic Prices Value Added / Industry Output to Producers’ Prices Value Added / Industry Output. IMPLAN has also estimated Taxes less Subsidies on Products and Margins, which make the data available to convert from Basic Prices to Purchasers’ Prices as well.

Finally, in terms of support, users will have unlimited access to IMPLAN Community Forum at support.implan.com for any data sources and methodology questions you may have that are not addressed by the provided support document.  IMPLAN economists will gladly respond to all data sources and methodology questions on IMPLAN’s Community forum within 5 business days at no additional charge. The sample data is provided for the user to fully understand the data they are receiving. IMPLAN does not support data-application or related questions via email, phone, project consultation, or community forum.


LICENSE AGREEMENT:

Access to the IMPLAN EU data is protected with a custom license agreement.  The license agreement will be presented when you are ready to purchase data. Sorry, the lawyers make us do it.


GRAB YOUR PASSPORT:

To learn more about our new European Union data or to see a sample dataset, please contact IMPLAN at 800-507-9426 or sales@implan.com.

Cheerio!


SAMPLE DATA:

Read Me File

Data Dictionary

Study Area Sample Data

Trade Flow Sample Data

Commuting Flows Sample Data

Transfers Sample Data

SAM Sample Data

Type 1 Multipliers Sample Data

Type SAM Multipliers Sample Data


RESOURCES:

Eurostat 

World Bank

World Input-Output Database (WIOD)

https://ec.europa.eu/eurostat/web/nuts/nuts-maps
https://ec.europa.eu/eurostat/about/overview
http://www.wiod.org/project
https://datahelpdesk.worldbank.org/knowledgebase/articles/114947-what-is-the-difference-between-purchaser-prices-p
 

What are Direct, Indirect, and Induced Impacts?

INTRODUCTION:

So you ran your Industry Event impact and you get to the Results screen. Great!  But have you ever wondered exactly what each of those boxes in your summary results mean? This is the article for you!  

There are nuances with each type of Event you run. This article specifically addresses the  Industry Output, Industry Employment, Industry Employee Compensation, and Industry Proprietor Income Event types.


INTERPRETING THE RESULTS:

Let’s walk through an example.  Andrew’s Bootleg, a craft vodka company, went legit in 2019. We modeled his $1.5M in Output on the state of North Carolina. Our results are as follows:

What_are_Direct_Indirect_and_Induced.jpg


Now let’s unpack exactly what his sales mean for the North Carolina economy.  We see a total impact of 4.3 jobs, $471,347 in Labor Income, $1.4M in Value Added, and $2.0M in Output. This is the total economic impact from Andrew’s Bootleg; the sum of the Direct, Indirect, and Induced effects. Each of the next sections outlines what each part of this impact actually means.


EMPLOYMENT:

What_are_Direct_Indirect_and_Induced_-_Emp.jpg

DIRECT EMPLOYMENT

The 0.95 Direct Employment show that with $1.5M in Direct Output, it looks like Andrew can almost support himself full-time. This figure is the direct number of job years associated with the Output. But remember, jobs in IMPLAN are average annual employment. To switch between IMPLAN jobs and FTE, use the 536 FTE & Employee Compensation Conversion Table (2017). Using this converter, we see that the 0.95 IMPLAN jobs translate to .91 FTE jobs.

INDIRECT EMPLOYMENT

Andrew has to buy things like corn and yeast for his distilling. Because he is able to purchase some of his inputs from within the state, 1.19 jobs are supported in business-to-business transactions with the corn and yeast (and other) suppliers, as well as suppliers of those suppliers in the state.  This Indirect employment represents the number of job years that are supported by business to business transactions as a result of the economic activity generated by the Event.

INDUCED EMPLOYMENT

Andrew himself, and the employees in the businesses supported by Andrew’s operational purchases, spend a lot of their take-home income in North Carolina on things like paying rent and buying groceries. Through this, 2.16 jobs are supported in industries like real estate, health care and restaurants.  Induced employment represents the number of job years that could potentially be supported by household spending as a result of the economic activity generated by the Event.


LABOR INCOME:

What_are_Direct_Indirect_and_Induced_-_LI.jpg

DIRECT LABOR INCOME

Andrew pays himself well. The $292,512 in Direct Labor Income is the sum of the Employee Compensation (EC) and Proprietor Income (PI) paid to that one (0.95) employee. Even though EC includes wages and salaries, all benefits (e.g., health, retirement), and payroll taxes, he still takes home quite a bit. To switch between IMPLAN Employee Compensation and Wage & Salary figures, we can again use the 536 FTE & Employee Compensation Conversion Table (2017). Using this converter, we estimate that Andrew will take home $236,276 in wages. Direct Labor Income is the initial income earned by the Direct employees of the Industry specified in the Event.

INDIRECT LABOR INCOME

The $83,289 in Indirect Labor Income is the EC and PI that Andrew’s Bootleg supports in the corn and yeast (and other) suppliers. Indirect Labor Income is the amount of EC and PI that is associated with business-to-business transactions as a result of the economic activity generated by the Event.

INDUCED LABOR INCOME

Because Andrew and the other supported workers are spending their paychecks around the state, there is an Induced Labor Income of $95,546, including both EC and PI. Induced Labor Income is the amount of EC and PI that is associated with household spending as a result of the economic activity generated by the Event.


VALUE ADDED:

What_are_Direct_Indirect_and_Induced_-_VA.jpg

DIRECT VALUE ADDED

Value Added is akin to Gross Domestic Product (GDP) or at the North Carolina level, Gross State Product (GSP). Value Added includes the Labor Income dollars, as well as Taxes on Production and Imports (TOPI) and Other Property Income (OPI). Andrew’s Bootleg contributes $1.0M in Direct Value Added.  Remember, this includes the $292,512 in Labor Income, plus TOPI plus OPI.

INDIRECT VALUE ADDED

Through the business-to-business transactions, the company contributes $131,417 to Value Added or GSP. Again, this includes the $83,289 in Indirect Labor Income plus TOPI plus OPI. This is the specific Value Added that is generated  by business to business transactions as a result of the economic activity generated by the Event.

INDUCED VALUE ADDED

Because of the spending of the employee working at Andrew’s Bootleg and the supply chain companies, $175,477 of Value Added is supported.  This includes the $95,546 of Induced Labor Income, plus TOPI plus OPI. This is the specific Value Added that is generated from household spending as a result of the economic activity generated by the Event.


OUTPUT:

What_are_Direct_Indirect_and_Induced_-_Output.jpg

DIRECT OUTPUT

Andrew’s Bootleg has a Direct Output of $1.5M.  We know this because that’s what we modeled. Output is equal to Value Added plus Intermediate Expenditures; it is the total value of production. Remember, it includes Value Added (and Value Added includes Labor Income). Output is also the basis for all other calculations in IMPLAN. Total production value or Output, includes unsold production and excludes sold inventory. If Andrew sells all of his vodka produced this year within the year and only sells vodka produced this year, his $1.5M of Direct Output will be equivalent to his 2019 revenue.  

INDIRECT OUTPUT

Because of the business-to-business transactions resulting from local input purchases by Andrew’s Bootleg, $244,801 in Output is supported. Indirect Output represents all of the Output generated because of the Direct business to business spending. This figure includes the $131,417 in Indirect Value Added; and that Value Added then includes the $83,289 in Indirect Labor Income. 

INDUCED OUTPUT

Finally, $304,130 of Induced Output is supported when the employees working at the distillery and their suppliers (and the suppliers of their suppliers) spend their money throughout the economy. Induced Output is the total value that all industries take in as a result of household spending. This figure includes the $175,477 in Induced Value Added; and that Value Added then includes the $95,546 in Induced Labor Income.


BOOTLEG BREAKDOWN:

And that’s it! You can use this guide to help you understand the individual effects of your IMPLAN analysis.  I’ll drink to that!

How Commuter Employee Compensation is Estimated

INTRODUCTION:

While payroll taxes are paid in the county of employment, personal income taxes on that same income are paid in the county of residence, and these two places differ for commuters. Additionally, household demand is generated at the location of the household (that is, at the employee’s place of residence). Therefore, a proper measure of regional and inter-regional induced effects requires accounting for these inter-regional flows of employment-based income. IMPLAN derives region specific commuting flows as described below.  

It should be noted that while IMPLAN accounts for commuting precisely so that more spending is kicked off in the place of residence than in the place of work, where that spending ultimately occurs is based largely on IMPLAN’s trade flow model. For example, suppose that an employee in Mecklenburg County, NC lives in neighboring Rowan County and therefore takes his Employee Compensation less payroll taxes (unofficially termed “Commuter EC” for the purposes of this article) home with him to Rowan County, where he then pays personal income taxes on that income. Now suppose that this individual likes to go bowling, but there is no bowling alley in Rowan County.  These bowling expenditures occur back in Mecklenburg County. Thus, while the commuting data ensure that the employee’s demand originates in the place of residence, the fulfillment of that demand may occur in the place of work (or any number of other counties).


COUNTY COMMUTING DATA:

Initial estimates of Commuter EC between counties is derived from U.S. Census data. The Census Bureau’s Journey-To-Work (JTW) data provide information on commuting flows of people from county-of-residence to county-of-employment (including commuting to the same county as residence, or intra-commuting). IMPLAN combines the Census county-to-county commuting data with IMPLAN’s own annual estimates of county-level Commuter EC to estimate flows of compensation from the county in which compensation is earned back to the county of residence. Commuter EC is the remaining portion of Employee Compensation (EC) once payroll taxes and foreign commuting are removed. This adjustment needs to be made as payroll taxes are paid in the region in which compensation is earned and foreign commuting is treated as a leakage from the model. On the question of foreign commuting, IMPLAN uses U.S. level data on worker earnings that flow out of and into the country, from NIPA, distributed to states and counties based on EC and household income, respectively.

Unfortunately, the Census’s JTW data are lagged compared to IMPLAN’s annual Commuter EC estimates. Therefore, IMPLAN turns to the BEA REA data on earnings flows, which while only providing in- and out-flow data for a region and not its flow partner, are more up-to-date. As the JTW data include intra-flows and the REA gross flows data do not, IMPLAN also utilizes REA data on earnings by place of work to derive intra flows. These data (the gross in- and out-flows and the intra-flows) are used as controls in a matrix RAS of the Commuter EC previously derived from the JTW data. As the REA data are also lagged, IMPLAN does not control strictly to their values. Once completed, updated coefficients of commuting flows are derived, which are applied to annual county-level Commuter EC values. 

The resulting county level commuting flows are utilized in the generation of regional SAMs. Their inclusion allows for the calculation of the share of regionally generated compensation that leaks from the region (i.e., the region’s in-commuting rate). A region’s in-commuting rate is calculated as:

Commuter EC outflows / total EC generated in the region
    Commuter EC outflows are displayed in the IxC SAM as transfers of the EC column to
    Domestic Trade and Foreign Trade

The in-commuting rate is then used to determine leakages of EC in a region. For example, a region with a 25% in-commuting rate will see 25% of earned EC stemming from an impact analysis treated as leakage from the local economy.

The Commuter EC data are also utilized in Multi-Regional Input-Output analysis (MRIO); Commuter EC outflows from a region to linked model regions generate induced effects in the linked model regions. To continue with the prior example, if the entirety of the 25% in-commuting rate in the direct effect region represented commuters from the linked region, then the entirety of the 25% leaked Commuter EC in the direct effect region would be treated as additional household income in the linked region.

Note, in-commuting rates are region specific but not industry specific. If your analysis of an industry requires that you adjust the in-commuting rate, please see our article on adjusting compensation to account for a known in-commuting rate.


ZIP CODE & CONGRESSIONAL DISTRICTS COMMUTING DATA:

Flows of Commuter EC (EC less payroll taxes) between zip codes are calculated by distributing the flows of Commuter EC between the Counties to which those zip codes belong among those zip codes. The shares for out-flows of Commuter EC are based on total EC generated by each zip code in the county, while the shares for in-flows of Commuter EC are based on total receipts of EC less payroll taxes by households in each of the zip codes. Commuter EC flows for zip code-based regions like Congressional Districts or custom city models are simply sums of the component zip codes’ Commuter EC flows. 

Estimating Employee Compensation Adjustments for Known Commuting Rates

INTRODUCTION:

IMPLAN estimates an in-commuting rate for all regions – how many people work in the region and go home to another region. This article will show you how to see what IMPLAN estimates as the in-commuting rate and how to adjust it if you have more specific information for your project. The good news is that although there are quite a few calculations to adjust for your known in-commuting rate, we have a spreadsheet to ease the pain.


FINDING IN-COMMUTING RATES:

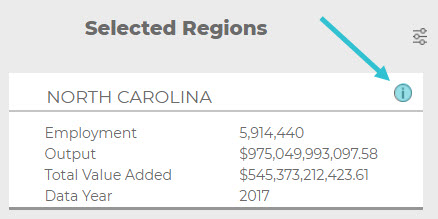
There are a few steps to figure out the in-commuting rate in IMPLAN. To view the data for your region, click behind the “i” to find the study area data for your region.


Commuting_Rate_-_Behind_the_i.jpg


Next, we can find the in-commuting data for the Region. Navigate to: 

     Social Accounts > IxC Social Accounting Matrix > Aggregate IxC SAM

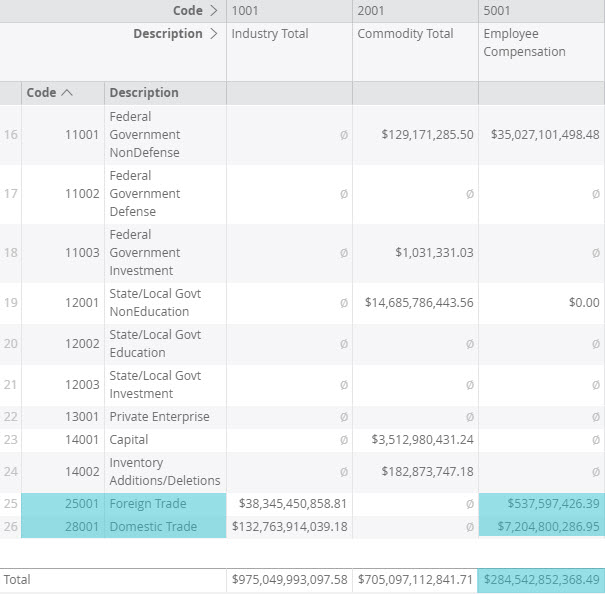
The Social Accounting Matrix (SAM) can be interpreted as columns making payments to rows. We will be focusing on the Employee Compensation (EC) (5001) column. The payments from the EC column to the Domestic Trade (28001) and Foreign Trade (25001) row are the household income dollars paid to employees that work in the Region but do not live in the Region, or in-commuters. This is referred to in IMPLAN as Commuter EC – the remaining portion of Employee Compensation (EC) once payroll taxes and foreign commuting are removed.

To get an estimate of the in-commuting rate for your region, add the Foreign Trade (20551) + the Domestic Trade (28001) row and divide by the total EC. Below is an example from North Carolina in 2017.


Commuting_Rate_-_Domestic___Foreign_Trade.jpg


So, we take 

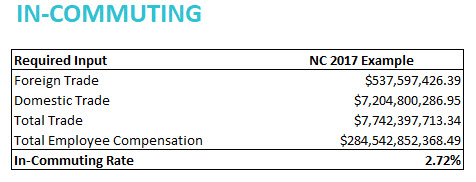
     $537,597,426.39 + $7,204,800,286.95 = $7,742,397,713.34. 

Then divide that by the total EC

     $7,742,397,713.34 / $284,542,852,368.49 = 2.72% 

This is the in-commuting rate which you can calculate using the file Commuting Rate – Calculations by filling in the teal boxes.


Commuting_-_Finding_In-Commuting.jpg


ADJUSTING FOR KNOWN IN-COMMUTING RATE:

Adjusting for your known in-commuting rate is necessary when IMPLAN’s in-commuting rate differs from yours, particularly when the difference is significant. The portion of EC earned in the Region by these in-commuters, according to the in-commuting rate, is treated as a leakage in IMPLAN.  Because EC by definition occurs at the site of employment, EC earned by in-commuters is still considered Direct EC to the Region, but because it is earned by non-residents, this EC will not generate any Indirect or Induced Effect in the Region. 

Now that you have your commuting rates, we can use one more table to adjust IMPLAN’s estimated regional commuting rate to your known regional commuting rate. Remember, your known commuting rate needs to be the value of the compensation that leaves the region. It cannot include payroll taxes.

We have four variables:

     MyEC = original, unmodified employee compensation
     MyCR = your known commuting rate
     SamCR = commuting rate reported in the SAM
     NewEC = the EC value you want to use when running the analysis

So the formula is:

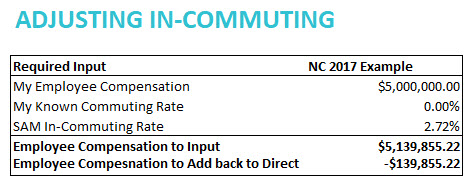
     NewEC = MyEC* [ (1-MyCR) / (1-SamCR) ]

For our NC example, we see

     NewEC = $5,000,000 * [ (1-0.00%) / (1-2.72%) ] = $5,139,855.22


Commuting_-_Adjusting_In.jpg


This number, $5,139,855.22 is what you will run through your EC event. But you aren’t quite done yet.

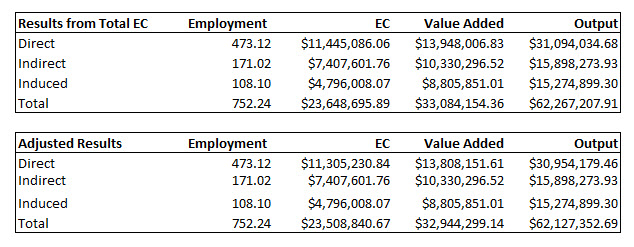
After the analysis has been run, add the difference (MyEC – NewEC) back to your direct EC effect. This is because the adjusted EC value (NewEC) used to run the analysis was just a means of estimating the appropriate Induced Effect based on the known commuting rate. In this example, the difference between MyEC and NewEC is the -$139,855.22. Since EC is a component of Value Added and Value Added is a component of Output, you also need to add this figure to the Direct Effects of Value Added and Output.


Commuting_-_Results.jpg


OUT-COMMUTING:

Sometimes you as the researcher might want to look at data on out-commuting from your region.  Out-commuting will show up as a payment from the Foreign Trade (25001) and Domestic Trade (28001) columns to the nine household (10001-10009) rows.  To get a out-commuting rate, divide the sum of these payments (across the 9 household types in both the Foreign Trade and Domestic Trade columns) by the sum of the nine household column totals. For this one, it’s easier to do your calculations in Excel. 

Use the three dots icon to download the IxC Aggregate SAM table. 3_Dots.jpg

You will then add up the totals of AB10 to AC18 to get the total trade value for the first household group.  Then add the totals for each of the nine household categories J30 to R30, to get the total household value. 

So, in our NC example, we take

     $10,786,102,053.85 / $469,722,964,305.19 = 2.30% 

This is the out-commuting rate which again you can calculate using the file Commuting Rate – Calculations by filling in the teal boxes.


Commuting_-_Finding_Out-Commuting.jpg

IMPLAN Pro System Requirements

INTRODUCTION:

So you aren’t ready to move to our new platform app.implan.com?  We understand. This article is just for you to ensure that your Pro desktop system keeps running smoothly for you in an ever-changing world of technology.


OPERATING SYSTEM:

At this point, there is no limit on what Windows Operating System is required for IMPLAN Pro.  However, changes may occur that impair the functionality as Windows is continuously being updated.  This is one of the main reasons that we are working hard on our new platform at app.implan.com. 


.NET FRAMEWORK

Software applications require .NET framework to run on Windows. You really don’t need to know anything about this to run IMPLAN, but you may run into an error message that will prompt you to update your .NET framework.  


Pro_Requirements_-_dot_net_error.PNG

So it isn’t really an update, it’s actually kind of a downdate since it requires an older version. Depending on the permissions you may or may not have on your computer, you may need to loop in your IT team.

Use your computer’s Search Bar at the bottom left of your screen to find the “Turn Windows Features On or Off” option in order to activate the older version of .NET Framework

Pro_Requirements_-_features.png

Turn on the version of .Net Framework that was unchecked:.

Pro_Requirements_-_Turn_On.jpg


Now attempt re-downloading the IMPLAN Pro software. If this still gives you issues you may need to consult your IT Team to ensure they can activate .NET Framework 2.0.


FURTHER SUPPORT:

If your version of IMPLAN Pro still isn’t working, please contact your Customer Success Manager at support@implan.com or 800-507-9426.

Dollar Year

Dollar Year is the year represented by the values in your Event.  This is usually (but not always) the same as the year in which your event occurred or is expected to occur. 

On the Impacts screen, Dollar Year should be the year of the data you are inputting. 

On the Results screen, Dollar Year should be the year of which you want to report your results.

This should not be confused with the Data Year which is the year of the dataset that you are utilizing. 


Data Year

Known Issues in IMPLAN

INTRODUCTION:

This article is designed to offer IMPLAN users some important descriptions of, temporary solutions for, and status updates regarding known technological issues which have been identified and are actively being addressed within IMPLAN. Should you encounter any issues which are not addressed in this article, please let us know by contacting us at (800) 507-9426 or at support@implan.com. Issues which were previously identified, but have since been resolved, are documented in IMPLAN’s product release notes which are published upon the release of new features and capabilities within the IMPLAN tool.


ISSUES BEING ADDRESSED:

Each of the technological bugs described below have been identified and are being addressed (as you read!) by the IMPLAN Product Team. So don’t worry—we’re on it! But, should you encounter any of these issues between now and the deployment of their official fixes, there are workarounds which can provide effective (albeit manual) solutions in the meantime.


1. MRIO ANALYSES TAKE LONGER TO FINISH CALCULATING RESULTS

The Issue
An MRIO study requires a much higher number of calculations than non-MRIO studies as the trade of all the sectors are analyzed between regions. As such, we expect these types of studies to take longer to finish than non-MRIO studies. The amount of time it takes to finish will depend on the number of events and the number of groups that the user has entered. The expected time for an MRIO analysis to finish can range between a few minutes for smaller studies to several hours for larger studies.

The Workaround
The best practice for MRIO and other larger studies is to leave yourself lots of time to run the analysis! Keep an eye on the Progress Panel in the lower right corner of the Impact screen that will provide notification of the progress of the study. Notification will be provided if the study has timed out. That can happen for various reasons with the most common being that the size of the study exceeds our processing limits. While we have made great strides in increasing the processing power, you still may see longer wait times. That said, in order to minimize wait times or potential for “timing out” with regard to processing performance, we suggest limiting your MRIO analyses to a) include a maximum of ten Events and b) limit your number of combined Groups to four or five. If your MRIO analysis absolutely must include more than ten Events or Groups which contain more than three Combined Regions, we suggest that you contact your Customer Success Manager at 800-507-9426 or support@implan.com to personally discuss potential strategies for managing the size and/or complexity of your study.


2. WHEN RUNNING MULTIPLE STUDIES, SMALL STUDIES CAN TAKE AN UNUSUALLY LONG TIME TO FINISH

The Issue
The user kicks off a large study and wants to run a second study while the first is processing. Even if the second study is a small study, it doesn’t finish in the expected time frame.

The Workaround
The best practice for larger studies, including MRIO that we expect to take longer, is to plan ahead. Run smaller studies first since studies that are kicked off after a large study get placed in queue and will not start until the large study has completed. This is to prevent too much data hitting the server at once and crashing the system. The second study analysis will automatically begin without any further action from the user.


3. GROUPS WITH MORE THAN 100 EVENTS MAY NOT COMPLETE.

The Issue
Groups with more than 100 events may not complete or may take a long time to complete.

The Workaround
We are still exploring, testing, and discovering the current limits of the tool’s processing power and the amounts of data that it can communicate to our servers at any one time. That said, in order to minimize wait times or potential for “timing out” with regard to large studies, we recommend keeping the number of Events in your Groups to less than 100. If your study requires more, contact your Customer Success Manager by calling 800-507-9426 or emailing support@implan.com to personally discuss potential strategies for managing the size and/or complexity of your study.


4. FILTERING IN REGION OVERVIEW

The Issue
When looking at the data in the Regions Overview, there is an intermittent issue facing filtering.  In a section that requires the use of a filter to choose a specific Industry or Commodity, the list of possibilities is not always populating after the first use of the search.

The Workaround
To do another search, just navigate back to the same screen and the Industry or Commodity list should be there again.  


5. ALL EVENTS WIPING OUT DESPITE SAVING THEM 

The Issue
If the users time out on the impacts screen, all events are being erased even if their work is saved. This occurs when a user is idle for too long causing the project to crash. Our product team is actively working towards fixing this issue. 

The Workaround
We recommend that a user leave the impact screen while the project is running or any other time that they are NOT actually active creating or editing on the page.


6. NO NOTIFICATION WHEN AN INDUSTRY DOES NOT EXIST IN A REGION 

The Issue
When running an Industry Event on a Sector that does not have any activity (no Output, no Employment, etc.) in the Region used in the analysis, the user will get all zero results. This is because there is no data or Sector averages for that industry in the Region, which is necessary for IMPLAN to estimate the effect of some change in that Sector within the given Region. IMPLAN does not provide any notification to the user that the Sector does not exist. When running an Industry Event on a Sector that doesn’t exist in the Region in combination with other Events that successfully produce non-zero results, it is very possible to overlook the fact that one of the Events has produced all zero results. 

The Workaround
You can ensure the Sectors you will be impacting exist by checking for data on the given Sector in the Region Details. Study Area Data (Industry Summary table) is a great place to check. Users can model the effects of a new Sector being introduced to a given Region by either first adding the Sector by customizing your Region and then modeling the effect using an Industry Event or by taking an Analysis-by-Parts approach


7. THE EVENTS TEMPLATE WILL NOT UPLOAD EVENTS WITH INDUSTRY SPECIFICATIONS GREATER THAN 536

The Issue

When uploading large numbers of events using the events template, industry specifications cannot be greater than 536 sectors. For the 2018 data set and later, this means that industries 537-546 cannot be included in an events template.

The Workaround

We would encourage that you familiarize yourself with our special industries before using them in a study. As industries 537-546 are commodity-only or administrative payroll specifications, it is unlikely that they would be included for a study that makes use of the events template. If you need to include them, these industries can be added manually by clicking “Add New Event.”


8. DIRECT OUTPUT EFFECT OF COMMODITY EVENTS NOT EQUAL TO EVENT VALUE WHEN THEY SHOULD MATCH

The Issue

When only Industries are the producers of a Commodity in a given Region (according to the Commodity Market Share), 100% of the Event Value for these Commodity Output Events should generate Direct Output. Therefore, when Dollar Year on the Impacts Screen matches the Dollar Year on the Results Screen the Event Value and Direct Output Effect should be exactly equal. Things are working just fine when Dollar Year and Data Year are the same in the Impact Screen. The issue arises whenever Dollar Year and Data Year on the Impact Screen do not match. In this situation, currently, there is some discrepancy between the Event Value and the Direct Output when there are multiple Industry producers (and no Institutional producers) even though these values should match when Dollar Year in the Impact Screen and Results Screen are the same.

The Workaround

Aside from disregarding the slight discrepancy, a workaround to this issue is to multiply the Commodity Output Value by the Commodity Market Shares to convert the Commodity Output into Industry Output. The portions of Commodity Output produced by Industries can be analyzed as multiple Industry Output Events.  


9. CUSTOMIZED REGIONS

The Issue

Chrome is the recommended browser for using IMPLAN.  When customizing a Region, if you are using Edge as a browser, it will not allow any number below one to be entered. 

Once you have completed your Region customization, the Customized Region will not automatically appear in the Selected Region field. 

The Workaround

Once you have completed your Region customization, search for and select the name of the Customized Region in the search field on the Region screen. The Region will be shown in the Selected Region field. If the Region is still building your will see a spinning wheel on the Region window. Once the Region is built, you can check for your customization Behind the i


10. NORMALIZATION RESETS UNEDITED LPP’S TO THE SAM VALUE

The Issue

In an industry spending pattern, the option to set a local purchase percentage for each commodity is available. If you uncheck the box labeled “SAM” which sets the LPP for the commodity to the RPC pulled from our Social Accounting Matrix (SAM), the software will update the LPP to 100%. If you uncheck the SAM box to set to 100% and then use the Normalize feature, the checkbox is reset to the SAM value.

The Workaround

The appropriate methodology would be to make edits to your commodities and normalize, then set custom LPP’s if they are known. If you would still like to enter LPP’s before normalization, any commodity that you intend to have a 100% LPP for should have the LPP field cleared, and a “1” entered.


11. FALSE ERROR AFTER CANCELING A PROJECT

The Issue

If you are running a project, hit cancel, hit run again, and then navigate away from the Impacts Screen, when you return to the Impacts Screen a coral error bar will appear. There is actually no error, however.

The Workaround

Good news! There is nothing you need to do (aside from ignoring that coral error message).


12. COMMODITY EVENTS AND USER-DEFINED LPP

The Issue

When using a Commodity Event, with Total Revenue (default) selected, and changing the LPP to anything besides the default 100%, the change in LPP is not sticking.

The Workaround

This fix is in the works and should be out soon. To adjust for this, only enter the percentage that you want applied to the multipliers in the Event Value.


13. COMBINED REGION NAME CHANGE

The Issue

If you have two Combined Regions with the same name, and you run a project using one of them, you may find the name changed when you return to the Impacts screen.

The Workaround

Have no fear on this one. Although the name may have changed, because you have two identical Combined Regions with the same name, IMPLAN just pulled in the other name for it.


IMPLAN's Core Data Release is now live! Current subscribers can automatically access the new data in-app. If you aren’t a subscriber, you can schedule a demo today to learn more about becoming one.

X